. 2018 Sep 17;14(9):e1007290.
doi: 10.1371/journal.ppat.1007290. eCollection 2018 Sep.

Longitudinal transcriptomic characterization of the immune response to acute hepatitis C virus infection in patients with spontaneous viral clearance

Affiliations

Longitudinal transcriptomic characterization of the immune response to acute hepatitis C virus infection in patients with spontaneous viral clearance

Brad R Rosenberg et al. PLoS Pathog. .

Abstract

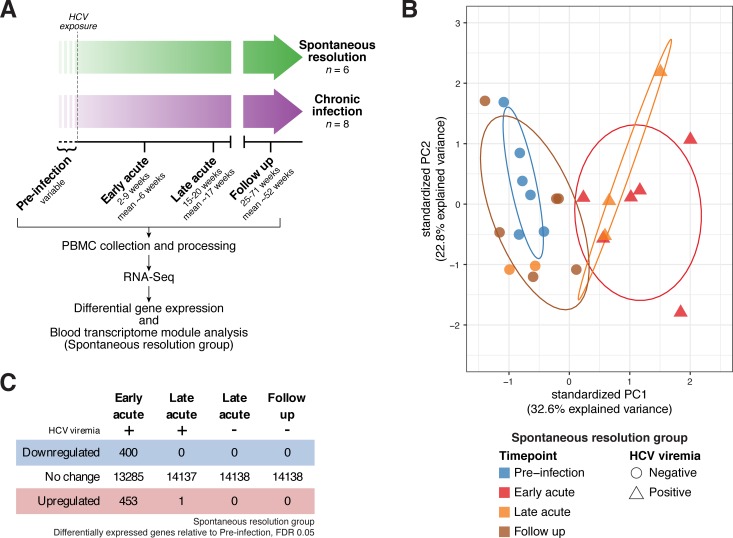
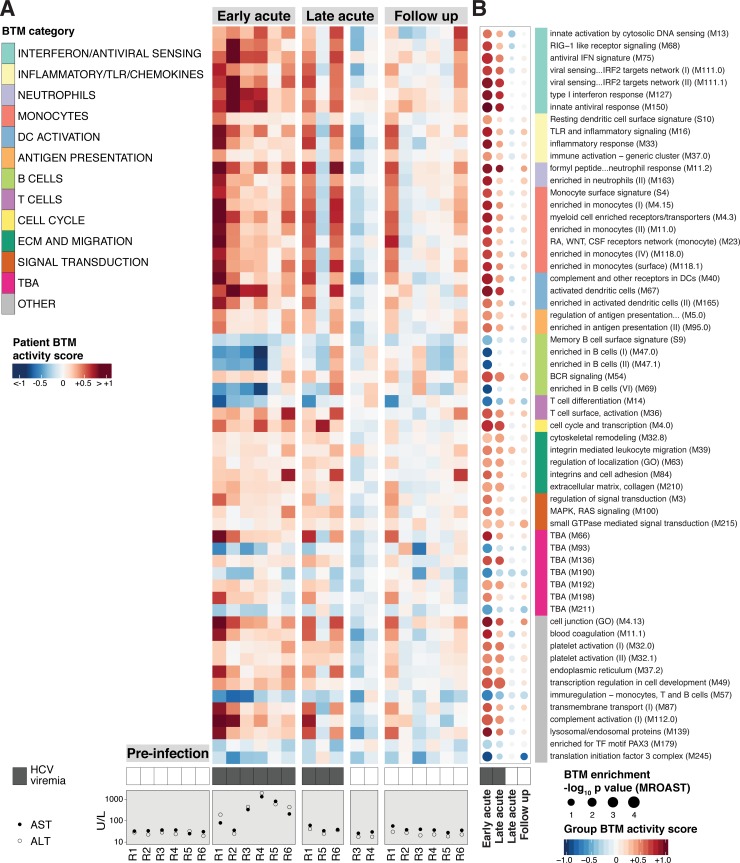
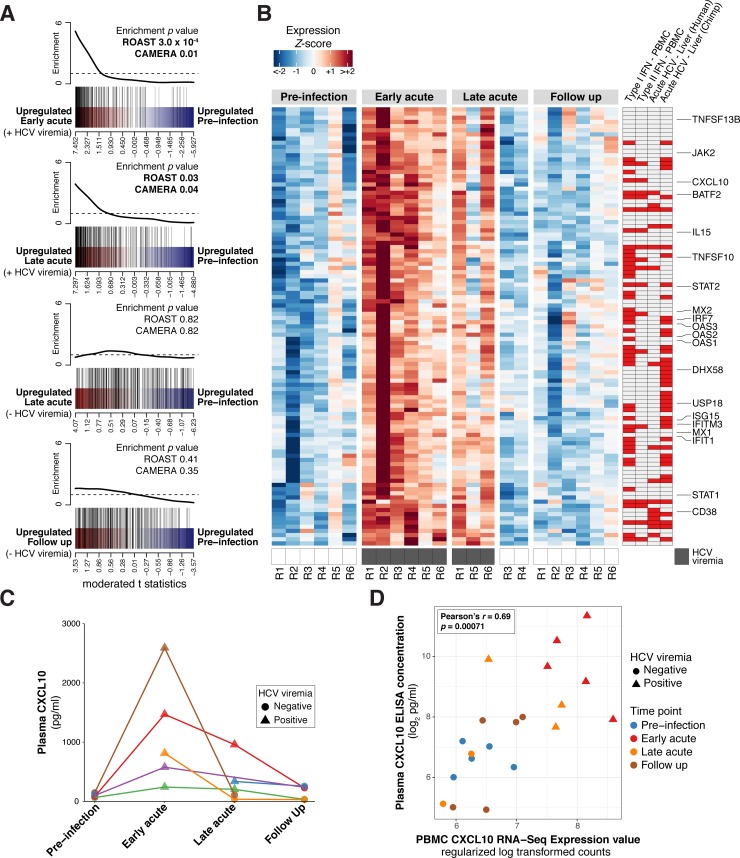
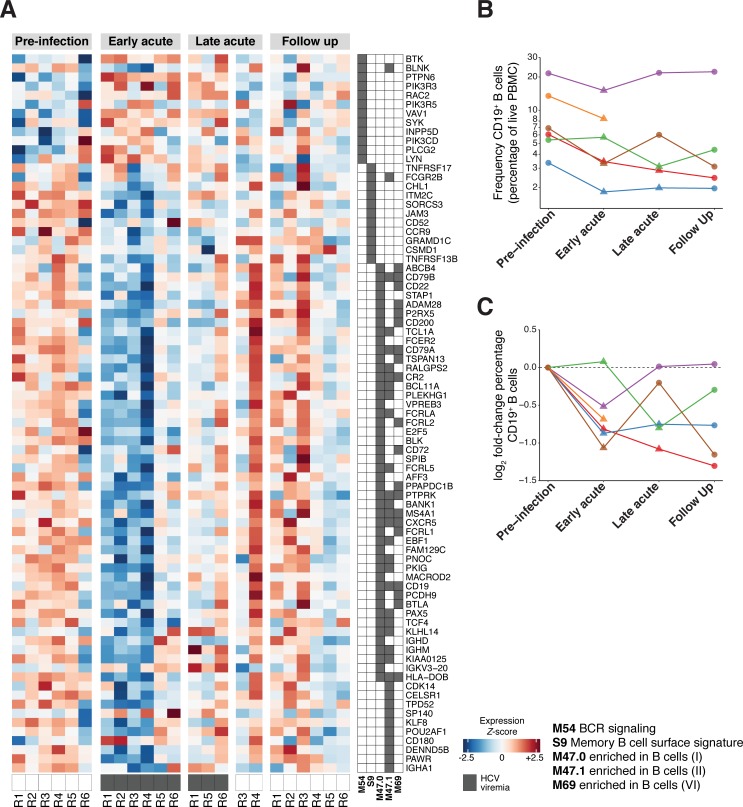
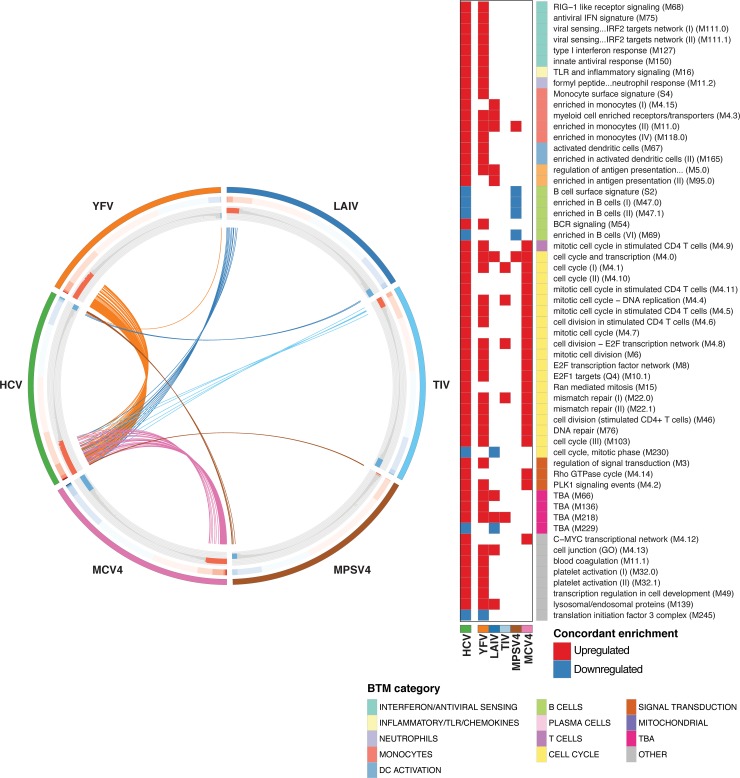
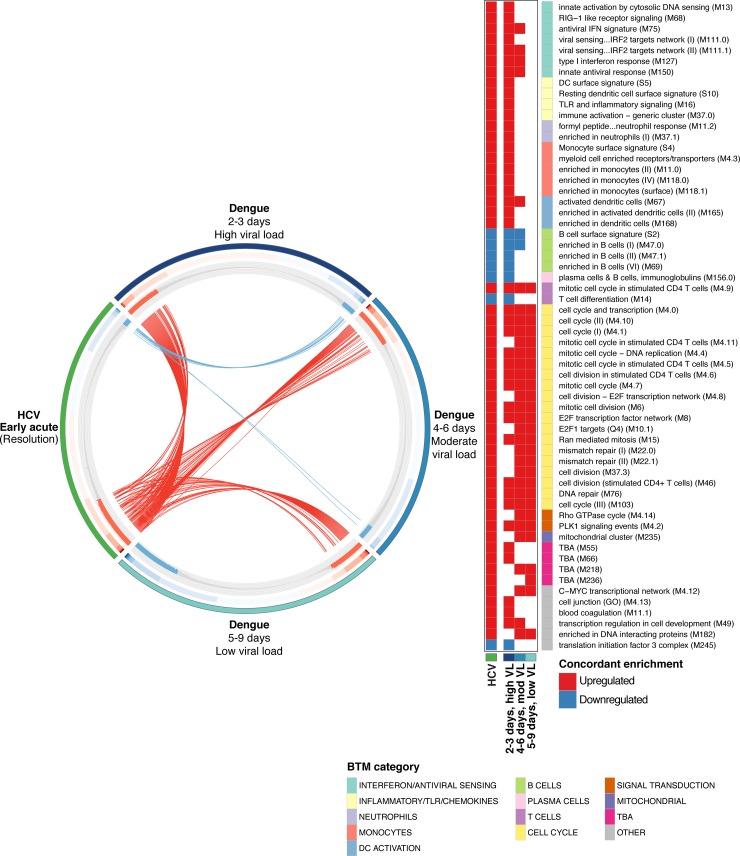
Most individuals exposed to hepatitis C virus (HCV) become persistently infected while a minority spontaneously eliminate the virus. Although early immune events influence infection outcome, the cellular composition, molecular effectors, and timeframe of the host response active shortly after viral exposure remain incompletely understood. Employing specimens collected from people who inject drugs (PWID) with high risk of HCV exposure, we utilized RNA-Seq and blood transcriptome module (BTM) analysis to characterize immune function in peripheral blood mononuclear cells (PBMC) before, during, and after acute HCV infection resulting in spontaneous resolution. Our results provide a detailed description of innate immune programs active in peripheral blood during acute HCV infection, which include prominent type I interferon and inflammatory signatures. Innate immune gene expression rapidly returns to pre-infection levels upon viral clearance. Comparative analyses using peripheral blood gene expression profiles from other viral and vaccine studies demonstrate similarities in the immune responses to acute HCV and flaviviruses. Of note, both acute dengue virus (DENV) infection and acute HCV infection elicit similar innate antiviral signatures. However, while transient in DENV infection, this signature was sustained for many weeks in the response to HCV. These results represent the first longitudinal transcriptomic characterization of human immune function in PBMC during acute HCV infection and identify several dynamically regulated features of the complex response to natural HCV exposure.


Conflict of interest statement

The authors have declared that no competing interests exist.

Figures

Fig 1
Fig 1. Study design and differential gene expression analysis in the Resolution group.
(A) Overall study design. (B) Principal component analysis (PCA) of gene expression in the Resolution group (patient-specific gene expression variation removed as detailed in Materials and Methods). Color denotes time point, shape denotes HCV viremia status. Ellipses indicate 68% normal probability for each group (for Resolution group, Late Acute timepoint, ellipse plotted for positive HCV viremia samples only). (C) Summary of differential gene expression analysis results in the Resolution group. See also S1 and S2 Tables.
Fig 2
Fig 2. Acute HCV infection elicits a dynamic host response in peripheral immune cells.
(A) Heatmap of median log2 fold-change sample level activity scores for the 60 BTMs differentially enriched (MROAST q-value < 0.05) at any time point (relative to Pre-Infection). Rows represent individual BTMs (category indicated on color sidebar, right), columns represent individual patient samples at indicated time points. HCV viremia (presence/absence of viral RNA by RT-PCR) and transaminase (AST, ALT) data are presented below corresponding samples. (B) “BTM dot plot” of differentially enriched BTMs by analysis group (relative to Pre-infection, any time point, MROAST q-value < 0.05). Dot color and intensity indicate direction and magnitude (group-level BTM activity score), respectively, of differential BTM enrichment. Dot size is proportional to significance (-log10 p-value, MROAST). BTM category indicated on color sidebar. HCV viremia status (presence/absence of viral RNA by RT-PCR) is denoted by filled/unfilled boxes at bottom of plot. See also S3 Table. BTM list order is preserved between (A) and (B).
Fig 3
Fig 3. The peripheral immune response to acute HCV infection is characterized by upregulated innate antiviral/interferon signatures.
(A) Barcode plots depicting differential enrichment of a PBMC ISG set for the indicated acute HCV time points relative to Pre-Infection. Red-blue color bar represents all genes ordered by differential expression statistics (moderated t statistic) for the designated contrast. PBMC ISG set member genes are highlighted by vertical black lines. Corresponding line plot displays sliding average of set enrichment. MROAST and CAMERA test p-values for PBMC ISG set enrichment are presented with each plot. (B) Heatmap displaying scaled expression values (normalized log2 read counts per million, scaled to z-scores by gene) for acute HCV PBMC ISG signature genes (as described in text) at Pre-Infection and Early acute time points. Select ISGs are annotated. Sidebars designate differential ISG expression in the indicated transcriptomics study (red indicates concordant upregulation): Type I IFN–PBMC and Type II IFN–PBMC [30], Acute HCV–Liver (Human) [19], Acute HCV–Liver (Chimpanzee) [25]. See also S4 Table. (C) Plasma CXCL10 concentration (pg/mL) for the indicated acute HCV time points. Each color (points/lines) denotes data from a single patient. (D) Plasma CXCL10 concentration (pg/mL) and CXCL10 RNA-Seq gene expression measures (regularized log transformed counts) from corresponding PBMC samples. Point color denotes time point analysis group, point shape denotes HCV viremia status (presence/absence of viral RNA by RT-PCR).
Fig 4
Fig 4. Decreased B cell transcriptional signatures in acute HCV infection.
(A) Heatmap displays individual patient sample scaled expression values (normalized log2 read counts per million, scaled to z-scores by gene) for expressed genes composing select B cell-associated BTMs. BTM gene membership is denoted in accompanying grid annotation. Dark grey boxes along bottom of heatmap indicate detectable HCV viremia. (B) CD19+ B cell frequency (percentage of live PBMC as measured by flow cytometry) at indicated time points during acute HCV infection and resolution. Each color (points/lines) denotes data from a single patient. Y-axis on log10 scale to facilitate visualization across different patients. (C) Log2 fold-change (relative to corresponding patient pre-infection baseline) of CD19+ B cell frequency (percentage of live PBMC as measured by flow cytometry) at indicated time points during acute HCV infection and resolution. Each color (points/lines) denotes data from a single patient.
Fig 5
Fig 5. Comparison of immune responses to acute HCV and different vaccines.
CIRCOS plot indicating BTM enrichment patterns shared between the Early acute HCV and indicated vaccine responses (day 7 post-vaccination versus pre-vaccination baseline). BTMs are ordered along each vaccine (or HCV) segment by GSEA Normalized enrichment score (NES) values in the corresponding dataset. Outer track color indicates HCV/vaccine dataset. Middle track heatmap plots NES values for each BTM. Inner track histogram plots -log10 p-values (GSEA pre-ranked) for BTM enrichment (relative to baseline); red positive bars indicate upregulation, blue negative bars indicate downregulation. For each vaccine group, each BTM demonstrating concordant activity (i.e. enriched, same directionality) with the response to Early acute HCV (Resolution group) is linked by an arc (colored by vaccine) to the HCV segment. BTMs concordant between Early acute HCV and any vaccine dataset are listed at right. Filled cells denote concordant enrichment relative to baseline (GSEA pre-ranked q-value < 0.01); red indicates upregulation, blue indicates downregulation. BTM category indicated on color sidebar.
Fig 6
Fig 6. Comparison analysis of immune response to acute HCV and acute DENV infection.
CIRCOS plot indicating BTM enrichment patterns shared between the Early acute HCV and acute DENV responses (DENV subgroups as defined in the main text). BTMs are ordered along each DENV subgroup (or HCV) segment by GSEA NES values in the corresponding dataset. Outer track color indicates HCV/DENV dataset. Middle track heatmap plots NES values for each BTM. Inner track histogram plots -log10 p-values (GSEA pre-ranked) for BTM enrichment (relative to baseline); red positive bars indicate upregulation, blue negative bars indicate downregulation. For each DENV subgroup, each BTM demonstrating concordant activity (i.e. enriched, same directionality) with the response to acute HCV is linked by an arc to the HCV segment. Each arc is colored by directionality of concordant enrichment (red indicates upregulation, blue indicates downregulation). BTMs concordant between acute HCV and any DENV subgroup dataset are listed at right. Filled cells denote concordant enrichment relative to baseline (Both acute HCV and indicated DENV subgroup datasets GSEA pre-ranked q-value < 0.01); red indicates upregulation, blue indicates downregulation. BTM category indicated on color sidebar.

Similar articles

Cited by

References

    1. Martin NK, Vickerman P, Dore GJ, Hickman M. The hepatitis C virus epidemics in key populations (including people who inject drugs, prisoners and MSM): the use of direct-acting antivirals as treatment for prevention. Curr Opin HIV AIDS. 2015;10(5):374–80. Epub 2015/08/08. 10.1097/COH.0000000000000179 ; PubMed Central PMCID: PMCPMC4659815. - DOI - PMC - PubMed
    1. Hajarizadeh B, Grebely J, Dore GJ. Epidemiology and natural history of HCV infection. Nat Rev Gastroenterol Hepatol. 2013;10(9):553–62. Epub 2013/07/03. 10.1038/nrgastro.2013.107 . - DOI - PubMed
    1. Abdel-Hakeem MS, Shoukry NH. Protective immunity against hepatitis C: many shades of gray. Front Immunol. 2014;5:274 Epub 2014/07/02. 10.3389/fimmu.2014.00274 ; PubMed Central PMCID: PMCPmc4058636. - DOI - PMC - PubMed
    1. Park SH, Rehermann B. Immune responses to HCV and other hepatitis viruses. Immunity. 2014;40(1):13–24. Epub 2014/01/21. 10.1016/j.immuni.2013.12.010 . - DOI - PMC - PubMed
    1. Ball JK, Tarr AW, McKeating JA. The past, present and future of neutralizing antibodies for hepatitis C virus. Antiviral Res. 2014;105:100–11. Epub 2014/03/04. 10.1016/j.antiviral.2014.02.013 ; PubMed Central PMCID: PMCPMC4034163. - DOI - PMC - PubMed

Publication types

MeSH terms

Substances