. 2018 Dec:117:38-42.
doi: 10.1016/j.ypmed.2018.09.006. Epub 2018 Sep 14.

Understanding individual differences in vulnerability to cigarette smoking is enhanced by attention to the intersection of common risk factors

Affiliations

Understanding individual differences in vulnerability to cigarette smoking is enhanced by attention to the intersection of common risk factors

Diann E Gaalema et al. Prev Med. 2018 Dec.

Abstract

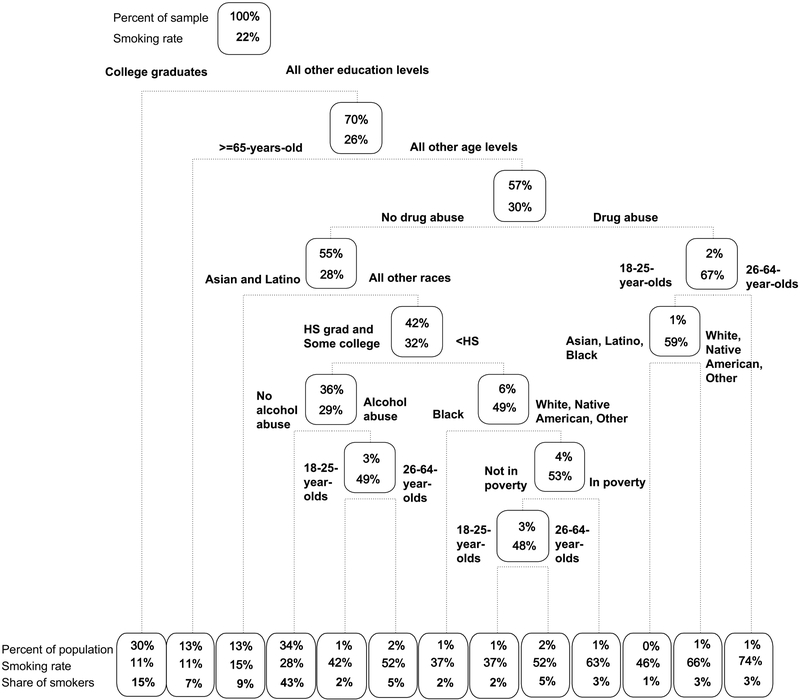
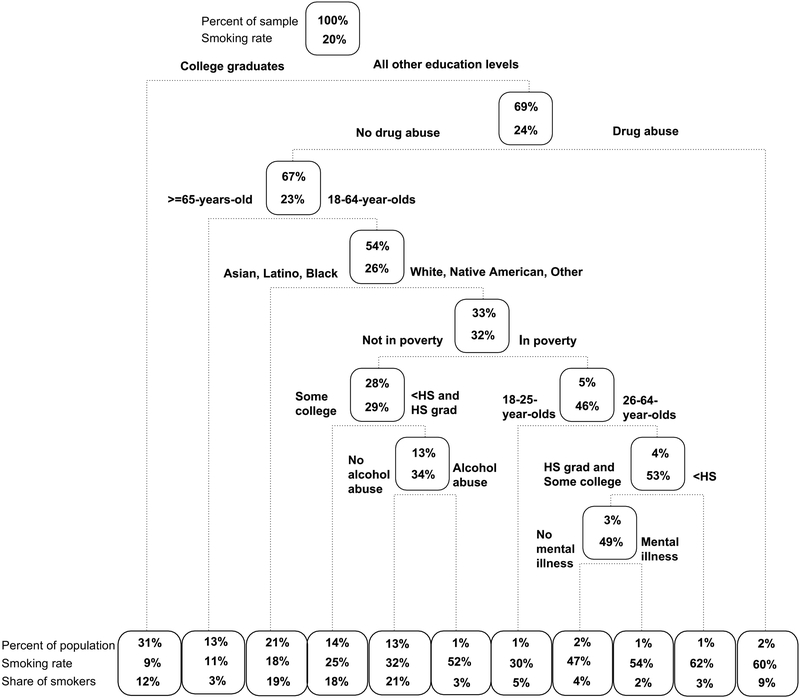
While smoking prevalence in the U.S. and other industrialized countries has decreased substantially, this change has been unevenly distributed, with dramatic decreases in certain subpopulations but little change or even increases in others. Accordingly, considerable attention has been fruitfully devoted to identifying important risk factors for smoking (e.g., mental illness, other substance use disorders). However, there has been little research on the intersection of these risk factors. As risk factors rarely occur in isolation, it is important to examine risk-factor profiles as is commonly done in studying other chronic conditions (e.g., cardiovascular disease). The purpose of this Commentary is to encourage greater interest in the intersection of multiple risk factors using cigarette smoking as an exemplar. We focus on the intersection of eight well-established risk factors for smoking (age, gender, race/ethnicity, educational attainment, poverty, drug abuse/dependence, alcohol abuse/dependence, mental illness). Studying the intersection of risk factors is likely to require use of innovative data-analytic methods. We illustrate, using years 2011-2016 of the US National Household Survey on Drug Use and Health, how Classification and Regression Tree (CART) analysis can be an effective tool for identifying risk profiles for smoking. Examination of the intersection of these risk factors elucidates a series of risk profiles with associated, orderly gradations in vulnerability to current smoking, including the striking and reliable strength of a college education as a stand-alone profile predicting low risk for current smoking, and illustrating the potentially increasing importance of drug abuse/dependence as a risk factor.

Keywords: Cigarette smoking; Classification and regression tree analysis; Risk factors; Risk profiles; Tobacco use; Vulnerability; Vulnerable populations.


Conflict of interest statement

Conflict of Interest: The authors declare there is no conflict of interest.

Figures

Figure 1:
Figure 1:
A pruned, weighted classification and regression tree (CART) model of associations between current (past 30 days) smoking status and the following eight risk factors in the U.S. adult (≥18 years of age) population: educational attainment, age, race/ethnicity, past year drug abuse/dependence, past year alcohol abuse/dependence, annual income below federal poverty level, and past year mental illness in years 2011–2013 of the National Survey on Drug Use and Health (N = 114,246). Rectangles (nodes) represent the entire population (top-most node) or population subgroups (all other nodes). Within each node the top line lists the percent of the overall adult population represented within that node and the second line represents the smoking rate for that node. Using the root node as an example, this node represents 100% of the U.S. non-institutionalized adult population and 22% of them are smokers. Lines below nodes represent the binary branching around particular risk factors and risk-factor levels into subgroup nodes with further potential partitioning based on additional risk factors/levels. The bottom row comprises terminal nodes (i.e., final partitioning for a particular subgroup, minimal terminal node size set to ≥1000 individuals). Terminal nodes contain the same information as the other nodes plus an additional line showing percent of all adult current smokers represented by that node.
Figure 2:
Figure 2:
A pruned, weighted classification and regression tree (CART) model of associations between current (past 30 days) smoking status and the following eight risk factors in the U.S. adult (≥18 years of age) population: educational attainment, age, race/ethnicity, past year drug abuse/dependence, past year alcohol abuse/dependence, annual income below federal poverty level, and past year mental illness in years 2014–2016 of the National Survey on Drug Use and Health (N = 127,857). Rectangles (nodes) represent the entire population (top-most node) or population subgroups (all other nodes). Within each node the top line lists the percent of the overall adult population represented within that node and the second line represents the smoking rate for that node. Using the root node as an example, this node represents 100% of the U.S. non-institutionalized adult population and 20% of them are smokers. Lines below nodes represent the binary branching around particular risk factors and risk-factor levels into subgroup nodes with further potential partitioning based on additional risk factors/levels. The bottom row comprises terminal nodes (i.e., final partitioning for a particular subgroup, minimal terminal node size set to ≥1000 individuals). Terminal nodes contain the same information as the other nodes plus an additional line showing percent of all adult current smokers represented by that node.

References

    1. Breiman L; Friedman JH Olshen RA; Stone CJ Classification and regression trees. Belmont, CA: Wadsworth; 1984.
    1. Currie J, & Moretti E (2003). Mother's education and the intergenerational transmission of human capital: Evidence from college openings. The Quarterly Journal of Economics, 118(4), 14951532.
    1. Cutler DM, Huang W, & Lleras-Muney A (2015). When does education matter? The protective effect of education for cohorts graduating in bad times. Social Science & Medicine, 127, 63–73. - PMC - PubMed
    1. Cutler DM, & Lleras-Muney A (2010). Understanding differences in health behaviors by education. Journal of health economics, 29(1), 1–28. - PMC - PubMed
    1. Dickerson F, Schroeder J, Katsafanas E, Khushalani S, Origoni AE, Savage C, . & Yolken RH. (2018). Cigarette Smoking by Patients With Serious Mental Illness, 1999–2016: An Increasing Disparity. Psychiat Serv , 69, 147–153 - PubMed

Publication types