Multicenter Study
. 2019 Jan:75:72-83.
doi: 10.1016/j.bbi.2018.09.018. Epub 2018 Sep 14.

Brain glial activation in fibromyalgia - A multi-site positron emission tomography investigation

Affiliations
Multicenter Study

Brain glial activation in fibromyalgia - A multi-site positron emission tomography investigation

Daniel S Albrecht et al. Brain Behav Immun. 2019 Jan.

Abstract

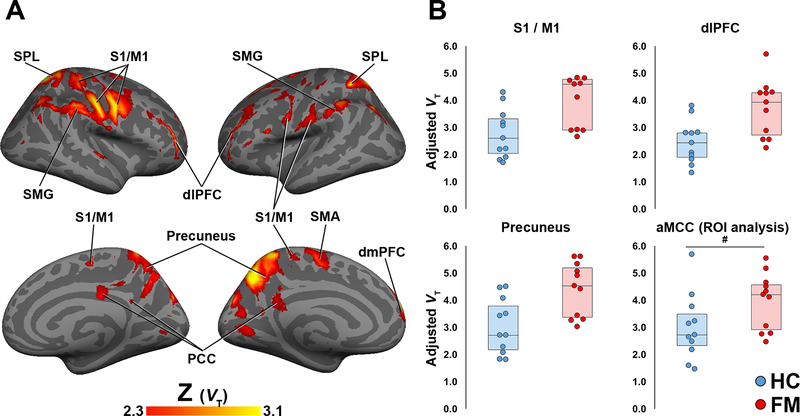
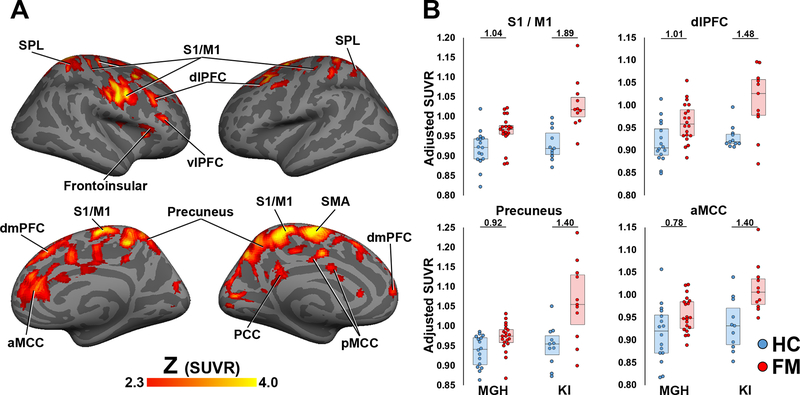
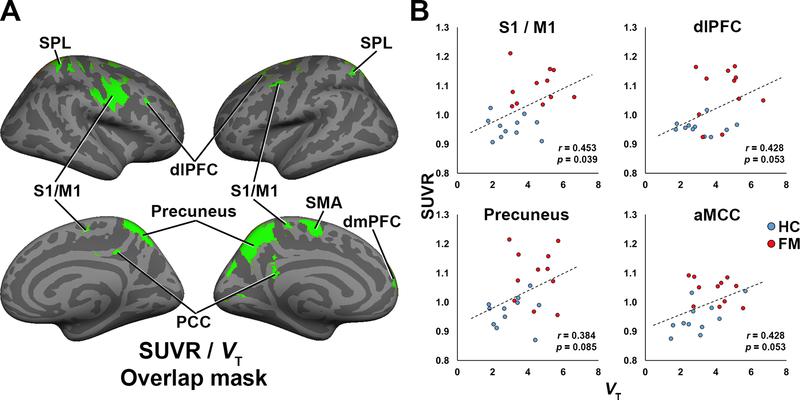
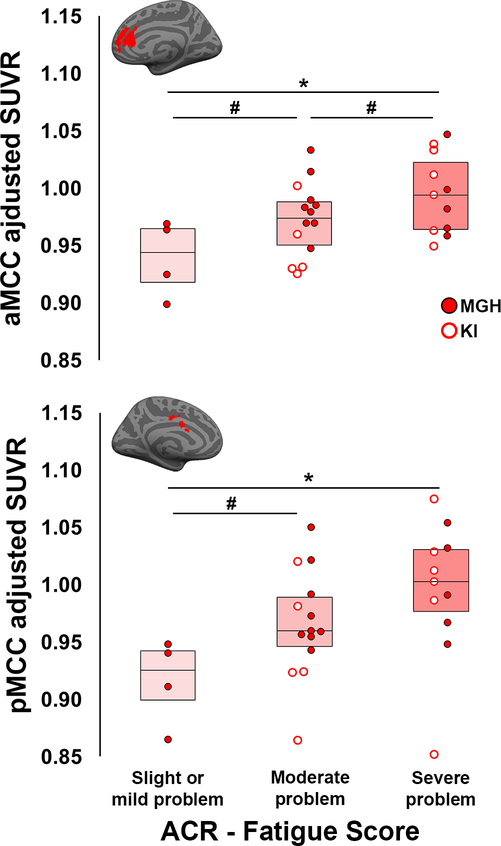
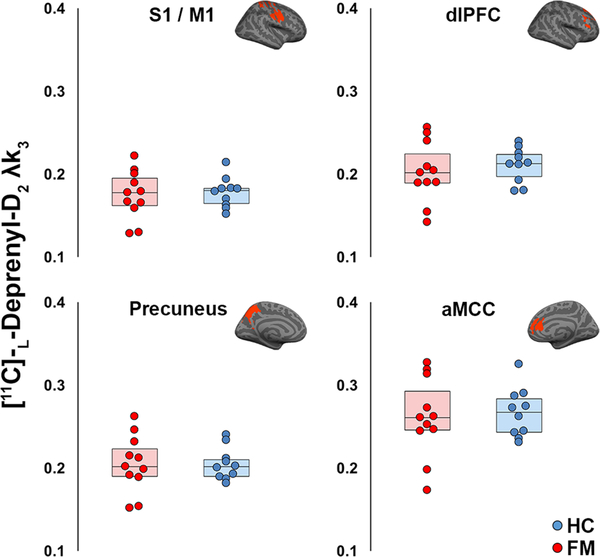
Fibromyalgia (FM) is a poorly understood chronic condition characterized by widespread musculoskeletal pain, fatigue, and cognitive difficulties. While mounting evidence suggests a role for neuroinflammation, no study has directly provided evidence of brain glial activation in FM. In this study, we conducted a Positron Emission Tomography (PET) study using [11C]PBR28, which binds to the translocator protein (TSPO), a protein upregulated in activated microglia and astrocytes. To enhance statistical power and generalizability, we combined datasets collected independently at two separate institutions (Massachusetts General Hospital [MGH] and Karolinska Institutet [KI]). In an attempt to disentangle the contributions of different glial cell types to FM, a smaller sample was scanned at KI with [11C]-L-deprenyl-D2 PET, thought to primarily reflect astrocytic (but not microglial) signal. Thirty-one FM patients and 27 healthy controls (HC) were examined using [11C]PBR28 PET. 11 FM patients and 11 HC were scanned using [11C]-L-deprenyl-D2 PET. Standardized uptake values normalized by occipital cortex signal (SUVR) and distribution volume (VT) were computed from the [11C]PBR28 data. [11C]-L-deprenyl-D2 was quantified using λ k3. PET imaging metrics were compared across groups, and when differing across groups, against clinical variables. Compared to HC, FM patients demonstrated widespread cortical elevations, and no decreases, in [11C]PBR28 VT and SUVR, most pronounced in the medial and lateral walls of the frontal and parietal lobes. No regions showed significant group differences in [11C]-L-deprenyl-D2 signal, including those demonstrating elevated [11C]PBR28 signal in patients (p's ≥ 0.53, uncorrected). The elevations in [11C]PBR28 VT and SUVR were correlated both spatially (i.e., were observed in overlapping regions) and, in several areas, also in terms of magnitude. In exploratory, uncorrected analyses, higher subjective ratings of fatigue in FM patients were associated with higher [11C]PBR28 SUVR in the anterior and posterior middle cingulate cortices (p's < 0.03). SUVR was not significantly associated with any other clinical variable. Our work provides the first in vivo evidence supporting a role for glial activation in FM pathophysiology. Given that the elevations in [11C]PBR28 signal were not also accompanied by increased [11C]-L-deprenyl-D2 signal, our data suggests that microglia, but not astrocytes, may be driving the TSPO elevation in these regions. Although [11C]-L-deprenyl-D2 signal was not found to be increased in FM patients, larger studies are needed to further assess the role of possible astrocytic contributions in FM. Overall, our data support glial modulation as a potential therapeutic strategy for FM.

Keywords: Astrocytes; Chronic overlapping pain conditions; Deprenyl-D2; Fibromyalgia; Functional pain; MRI/PET; Microglia; Neuroimmunology; Neuroinflammation; Positron emission tomography; TSPO.


Conflict of interest statement

All authors report no conflicts of interest

Figures

Figure 1.
Figure 1.. Voxelwise group differences in [11C]PBR28 VT.
A: Surface projection maps displaying areas with significantly elevated [11C]PBR28 VT in FM patients compared to controls (FM – n=11; HC – n=11) in voxelwise analyses (KI-only sample). B: average ± standard deviation VT extracted from several regions. The S1/M1, dLPFC and precuneus data were extracted from the clusters identified as statistically significant in the voxelwise VT analysis. For these regions, the plots are displayed for illustrative purposes only, and the level of statistical significance noted for each plot reflects that of the voxelwise analyses. For the aMCC, the data was extracted from a region, independently identified based on the results of the SUVR voxelwise analysis (see Fig. 2). The level of statistical significance noted for this region reflects the result of a region-of-interest analysis. SPL – superior parietal lobule, S1 – primary somatosensory cortex, M1 – primary motor cortex, SMG – supramarginal gyrus, dlPFC – dorsolateral prefrontal cortex, SMA – supplementary motor area, PCC – posterior cingulate cortex, dmPFC – dorsomedial prefrontal cortex. The barplots for S1/M1, dlPFC and Precuneus are for illustrative purposes. The barplot for aMCC illustrates an ROI analysis (p=0.071)
Figure 2.
Figure 2.. Voxelwise group differences in [11C]PBR28 SUVR
A: Surface projection maps displaying areas with significantly elevated [11C]PBR28 SUVR in FM patients compared to controls (FM – n=31; HC – n=27), in voxelwise analyses (KI+MGH sample). B: average ± standard deviation SUVR extracted from several of the clusters identified as statistically significant in the voxelwise SUVR analysis. Data from individual research sites (MGH or KI) are displayed separately, and the number above each ROI pairing corresponds to the effect size (Cohen’s d) of PET signal differences between FM patients and controls for each site. These data show that overall SUVR group differences, while larger for the KI dataset, are elevated in FM patients compared to controls in both datasets when evaluated independently. pMCC – posterior middle cingulate cortex, aMCC – anterior middle cingulate cortex. All data have been adjusted for genotype and injected dose.
Figure 3.
Figure 3.. Agreement between SUVR and VT analyses
A: Surface projection displaying the regions showing elevated PET signal across both SUVR (KI+MGH combined dataset) and VT (KI-only) analyses. B: Cross-correlations between SUVR and VT, extracted from regions identified in the overlap mask or, for the aMCC, from the SUVR analyses, in FM patients and HC from the KI site.
Figure 4.
Figure 4.. Associations between [11C]PBR28 SUVR and clinical variables
Significant differences in [11C]PBR28 SUVR in the aMCC (top) and pMCC (bottom) between FM patients reporting different severity of fatigue on the ACR 2011 questionnaire. Surface projections of individual ROIs are displayed in red above the plots. All data have been adjusted for TSPO genotype. * - Significant difference in post-hoc tests between FM patients reporting different levels of fatigue severity (p<0.01) # - Trend-level difference in post-hoc tests between FM patients reporting different levels of fatigue severity (p<0.10)
Figure 5.
Figure 5.. Absence of group differences in [11C]-L-deprenyl-D2 λk3.
Four representative regions showing significant group differences in the [11C]PBR28 SUVR analysis (Fig 2) show no differences in [11C]-L-deprenyl-D2 λk3 (p≥0.53 uncorrected). Surface projections of individual regions are displayed in red above the plots.

Similar articles

Cited by

References

    1. Abourbeh G, Theze B, Maroy R, Dubois A, Brulon V, Fontyn Y, Dolle F, Tavitian B, Boisgard R, 2012. Imaging microglial/macrophage activation in spinal cords of experimental autoimmune encephalomyelitis rats by positron emission tomography using the mitochondrial 18 kDa translocator protein radioligand [(1)(8)F]DPA-714. J Neurosci 32, 5728–5736. - PMC - PubMed
    1. Albrecht D, Ahmed S, Kettner N, Borra R, Cohen-Adad J, Deng H, Houle T, Opalacz A, Roth S, Melo MV, 2018. Neuroinflammation of the spinal cord and nerve roots in chronic radicular pain patients. Pain. - PMC - PubMed
    1. Albrecht DS, MacKie PJ, Kareken DA, Hutchins GD, Chumin EJ, Christian BT, Yoder KK, 2016. Differential dopamine function in fibromyalgia. Brain Imaging Behav 10, 829–839. - PMC - PubMed
    1. Albrecht DS, Normandin MD, Shcherbinin S, Wooten DW, Schwarz AJ, Zurcher NR, Barth VN, Guehl NJ, Johnson-Akeju O, Atassi N, Veronese M, Turkheimer F, Hooker JM, Loggia ML, 2017. Pseudo-reference regions for glial imaging with (11)C-PBR28: investigation in two clinical cohorts. J Nucl Med. - PMC - PubMed
    1. Alshikho MJ, Zurcher NR, Loggia ML, Cernasov P, Chonde DB, Izquierdo Garcia D, Yasek JE, Akeju O, Catana C, Rosen BR, Cudkowicz ME, Hooker JM, Atassi N, 2016. Glial activation colocalizes with structural abnormalities in amyotrophic lateral sclerosis. Neurology 87, 2554–2561. - PMC - PubMed

Publication types

MeSH terms