. 2019 Jan 1:184:242-255.
doi: 10.1016/j.neuroimage.2018.09.029. Epub 2018 Sep 14.

Decoding motion direction using the topography of sustained ERPs and alpha oscillations

Affiliations

Decoding motion direction using the topography of sustained ERPs and alpha oscillations

Gi-Yeul Bae et al. Neuroimage. .

Abstract

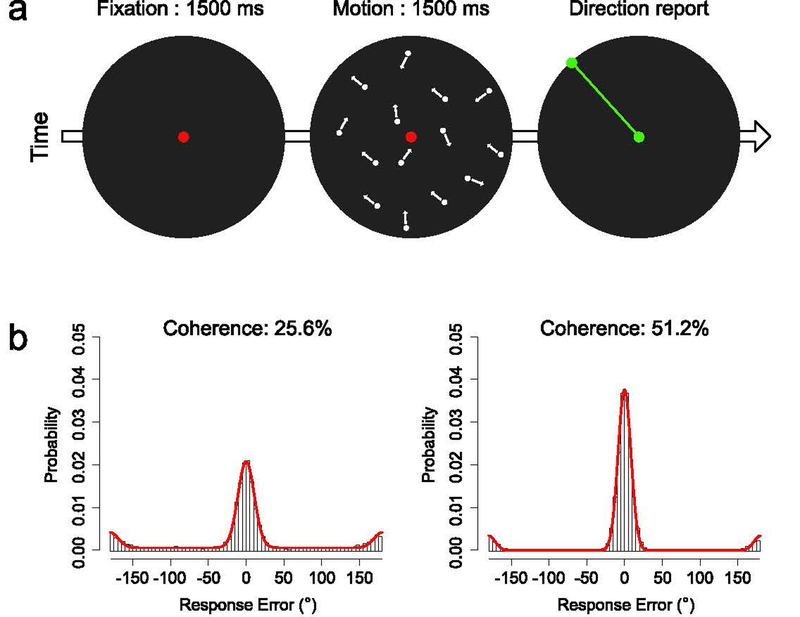
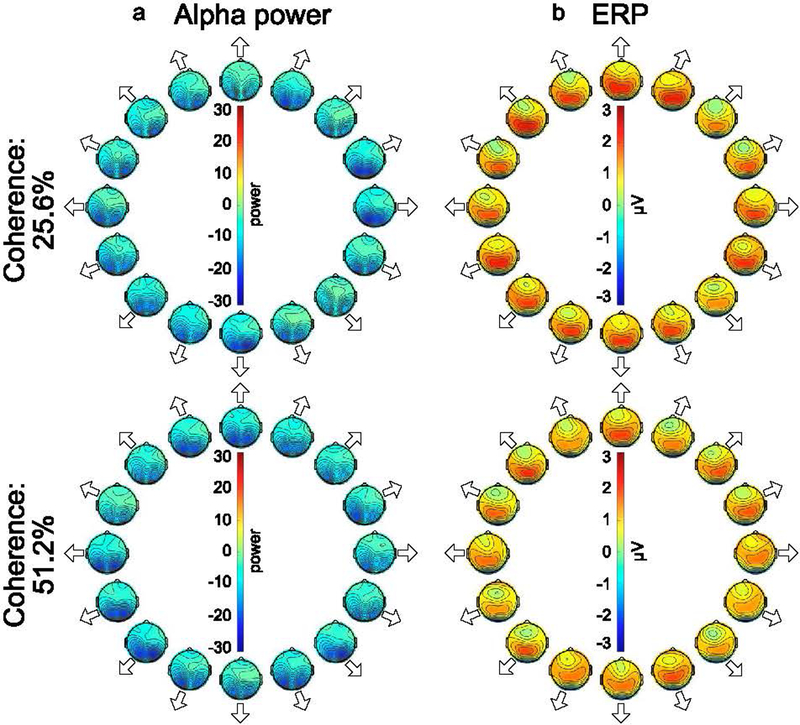
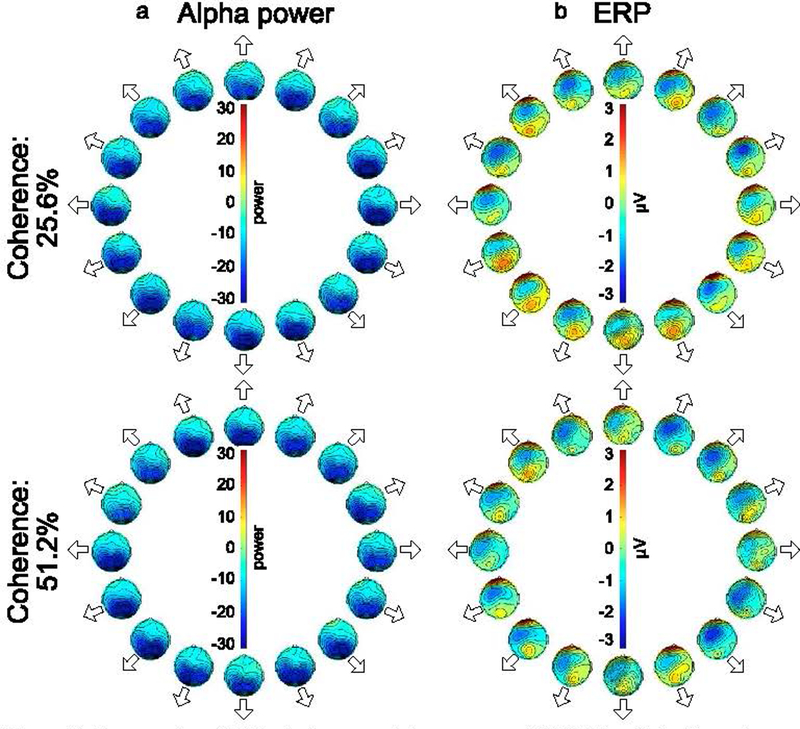
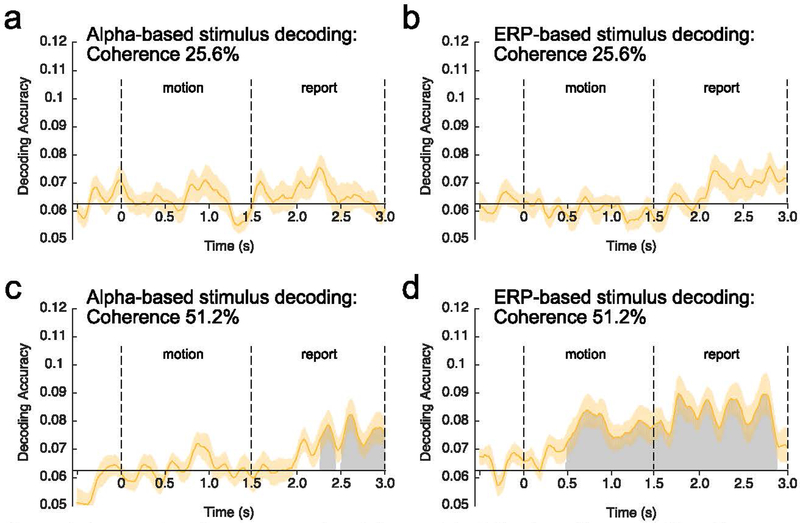
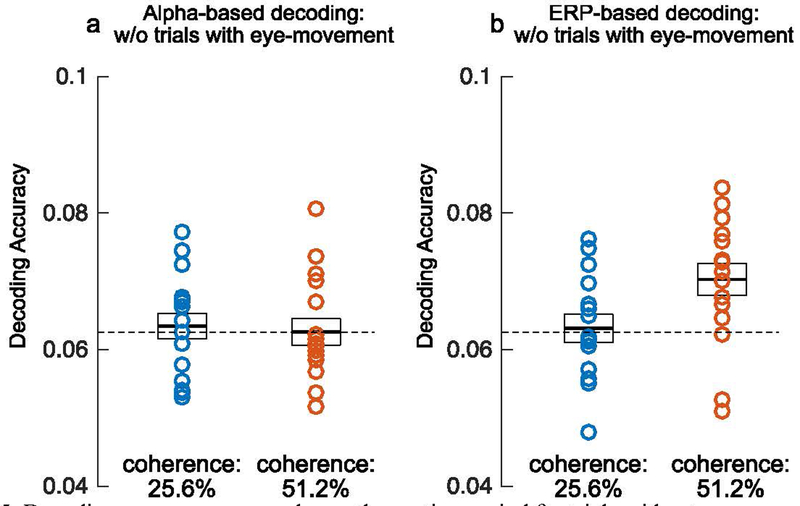
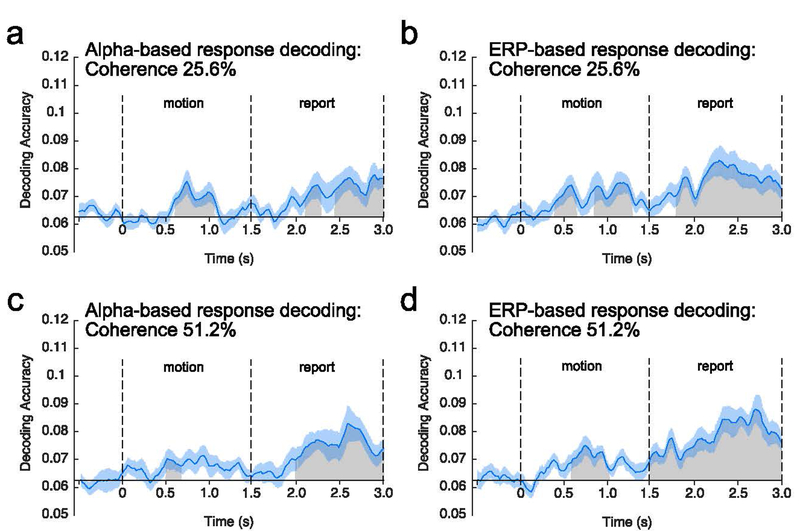
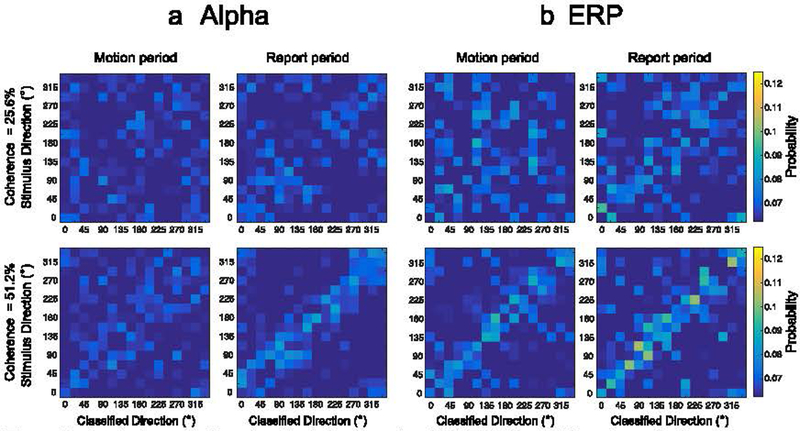
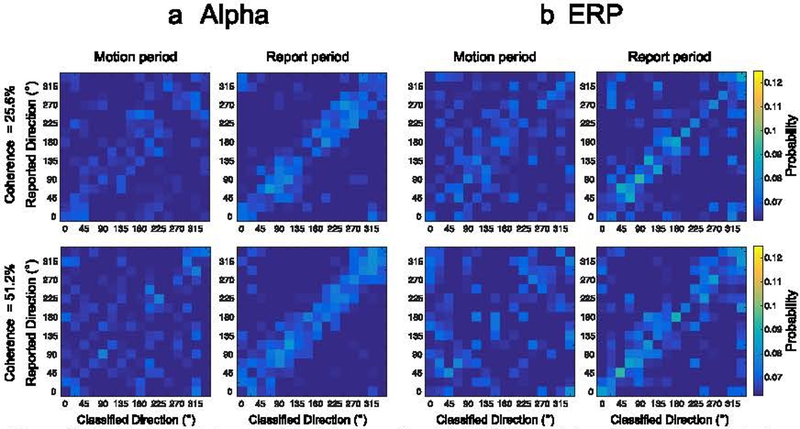
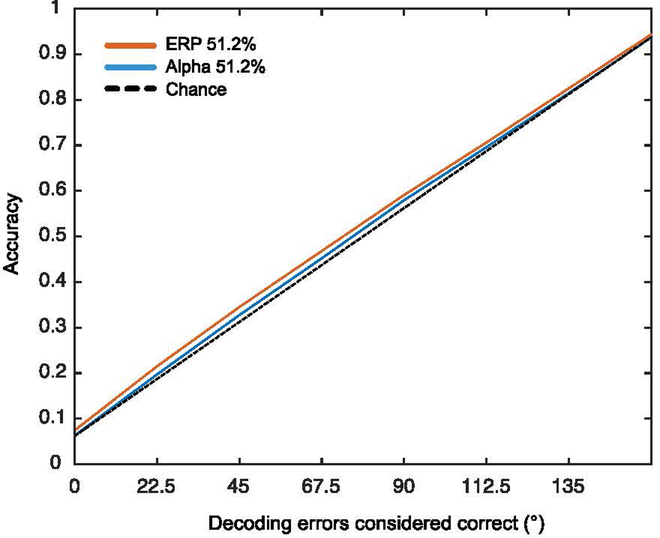
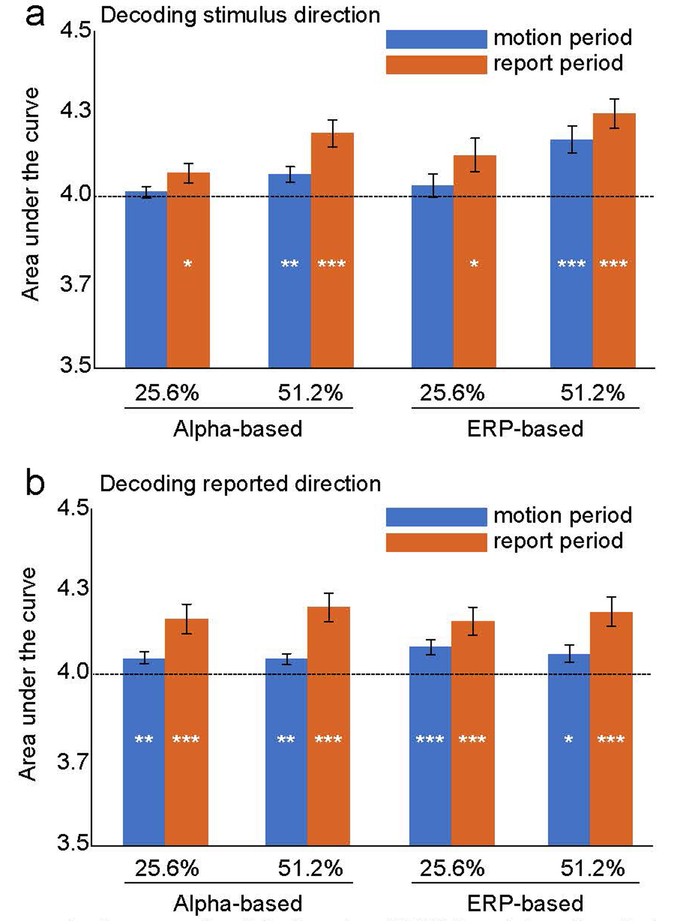
The present study sought to determine whether scalp electroencephalogram (EEG) signals contain decodable information about the direction of motion in random dot kinematograms (RDKs), in which the motion information is spatially distributed and mixed with random noise. Any direction of motion from 0 to 360° was possible, and observers reported the precise direction of motion at the end of a 1500-ms stimulus display. We decoded the direction of motion separately during the motion period (during which motion information was being accumulated) and the report period (during which a shift of attention was necessary to make a fine-tuned direction report). Machine learning was used to decode the precise direction of motion (within ±11.25°) from the scalp distribution of either alpha-band EEG activity or sustained event-related potentials (ERPs). We found that ERP-based decoding was above chance (1/16) during both the stimulus and the report periods, whereas alpha-based decoding was above chance only during the report period. Thus, sustained ERPs contain information about spatially distributed direction-of-motion, providing a new method for observing the accumulation of sensory information with high temporal resolution. By contrast, the scalp topography of alpha-band EEG activity appeared to mainly reflect spatially focused attentional processes rather than sensory information.

Keywords: Alpha-band oscillations; Decoding; EEG; ERPs; Motion perception.


Conflict of interest statement

Conflict of Interest: The authors declare no competing financial interests.

Figures

Figure 1.
Figure 1.
(a) Overview of procedure. On each trial, the observer fixated the central red dot for 1500 ms and then saw a random dot kinematogram (RDK) for 1500 ms. Motion coherence was either 25.6% or 51.2%, and the coherent motion could be in any direction from the 360° space. At the end of the RDK, the central dot turned green, indicating that the observer should report the motion direction by adjusting a green line to match the perceived motion direction. (b) Probability distribution of response errors for each coherence level, collapsed across observers. The red curve in each panel represents the maximum likelihood estimate of the simple model of task performance described in the main text.
Figure 2.
Figure 2.
Topography of (a) alpha power and (b) ERP activity for each combination of motion directions and motion coherences during the stimulus period. The data were averaged across observers and the entire 1500-ms stimulus duration. The arrow adjacent to each topographic map indicates the direction of motion corresponding to that map.
Figure 3.
Figure 3.
Topography of (a) instantaneous alpha power and (b) ERP activity for each combination of motion direction and motion coherence during the report period. The data were averaged across observers and the first 1500 ms of the report period. The position of each scalp map corresponds to the direction of motion.
Figure 4.
Figure 4.
Average decoding accuracy at each time point relative to motion onset. Decoding was applied either to alpha-band activity (a, c) or sustained event-related potential (ERP) activity (b, d), and the decoding was performed separately for the 25.6% motion coherence (a, b) and for the 51.2% motion coherence (c, d). Time 0 represents motion onset, and time 1.5 represents motion offset. The gray regions represent clusters of time points for which the decoding accuracy was greater than chance after correction for multiple comparisons. The orange shading indicates ±1 SEM.
Figure 5.
Figure 5.
Decoding accuracy averaged over the motion period for trials without eye movements for (a) alpha-band activity and for (b) sustained event-related potential (ERP) activity. The black horizontal line inside the white box represents average decoding accuracy, and the top and bottom edges of the box represent ±1 SEM. Each circle represents the decoding accuracy for an individual observer.
Figure 6.
Figure 6.
Average accuracy for decoding of the reported direction, plotted as in Figure 4. In these analyses, each trial was binned in terms of the reported direction rather than the stimulus direction. Time 0 represents motion onset and time 1.5 represents motion offset. The gray regions represent clusters of time points for which the decoding accuracy was greater than chance after correction for multiple comparisons. The blue shading indicates ±1 SEM.
Figure 7.
Figure 7.
Confusion matrices for (a) alpha-based and (b) ERP-based decoding of stimulus direction during motion period (left column) and during the report period (right column) for the two coherence levels. The proportion of classification responses for a given stimulus direction was averaged over the entire motion duration (0–1.5 s) and report duration (1.5– 3.0 s). (b) Confusion matrices for ERP-based decoding potted as (a).
Figure 8.
Figure 8.
Confusion matrices for (a) alpha-based and (b) ERP-based decoding of the reported direction of motion (rather than the actual direction of motion), plotted as in Figure 7.
Figure 9.
Figure 9.
Decoding accuracy as a function of the range of decision window for 51.2% coherence level during the stimulus period of the stimulus decoding.
Figure 10.
Figure 10.
Mean area under the curve for alpha-based and ERP-based decoding during the stimulus and report periods for decoding of the actual stimulus direction (a) and the reported direction (b). Asterisks indicate statistical significance after application of the false discovery rate correction for multiple comparisons (* = p < .05; ** = p < .01; *** = p < .001).

References

    1. Ahlfors SP, Simpson GV, Dale AM, Belliveau JW, Liu AK, Korvenoja A, & Ilmoniemi RJ (1999). Spatiotemporal activity of a cortical network for processing visual motion revealed by MEG and fMRI. Journal of Neurophysiology, 82(5), 2545–2555. - PubMed
    1. Bastiaansen M, Mazaheri A, & Jensen O (2012). Beyond ERPs: Oscillatory neuronal dynamics In Luck SJ & Kappenman ES (Eds.), The Oxford Handbook of ERP Components (pp. 31–49). New York: Oxford University Press.
    1. Bae GY & Luck SJ (2018a). Dissociable decoding of spatial attention and working memory from EEG oscillations and sustained potentials. Journal of Neuroscience, 38, 409–422. - PMC - PubMed
    1. Bae GY & Luck SJ (2018b). Motion perception in 360°. Vision Science Society annual meeting, St Pete Beach, FL.
    1. Benjamini Y, & Hochberg Y (1995). Controlling the false discovery rate: a practical and powerful approach to multiple testing. Journal of the royal statistical society. Series B (Methodological), 289–300.

Publication types