. 2018 Sep 15;8(3):51.
doi: 10.3390/metabo8030051.

Mind the Gap: Mapping Mass Spectral Databases in Genome-Scale Metabolic Networks Reveals Poorly Covered Areas

Affiliations

Mind the Gap: Mapping Mass Spectral Databases in Genome-Scale Metabolic Networks Reveals Poorly Covered Areas

Clément Frainay et al. Metabolites. .

Abstract

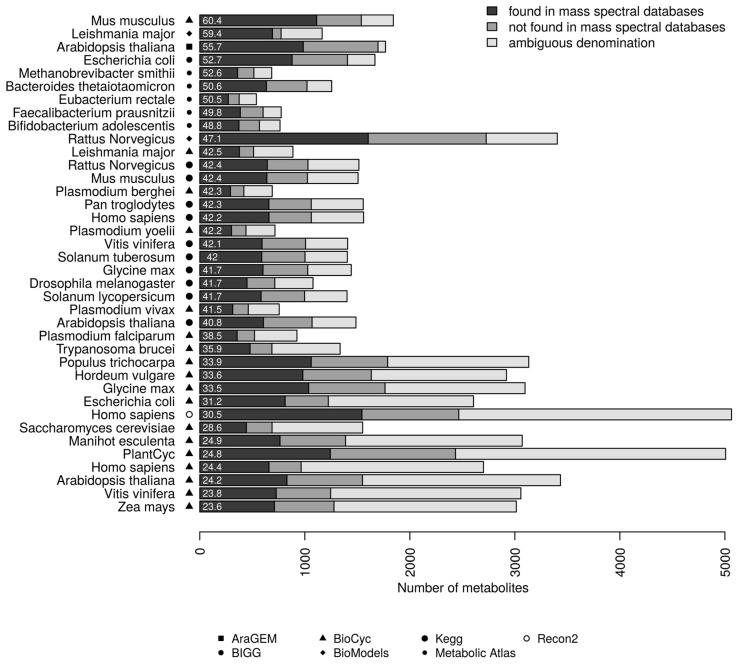
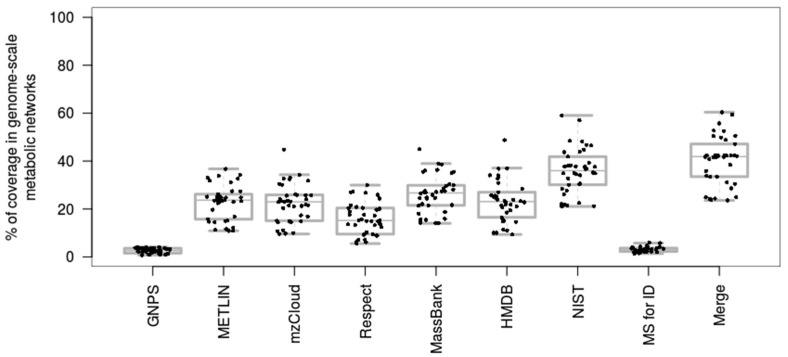
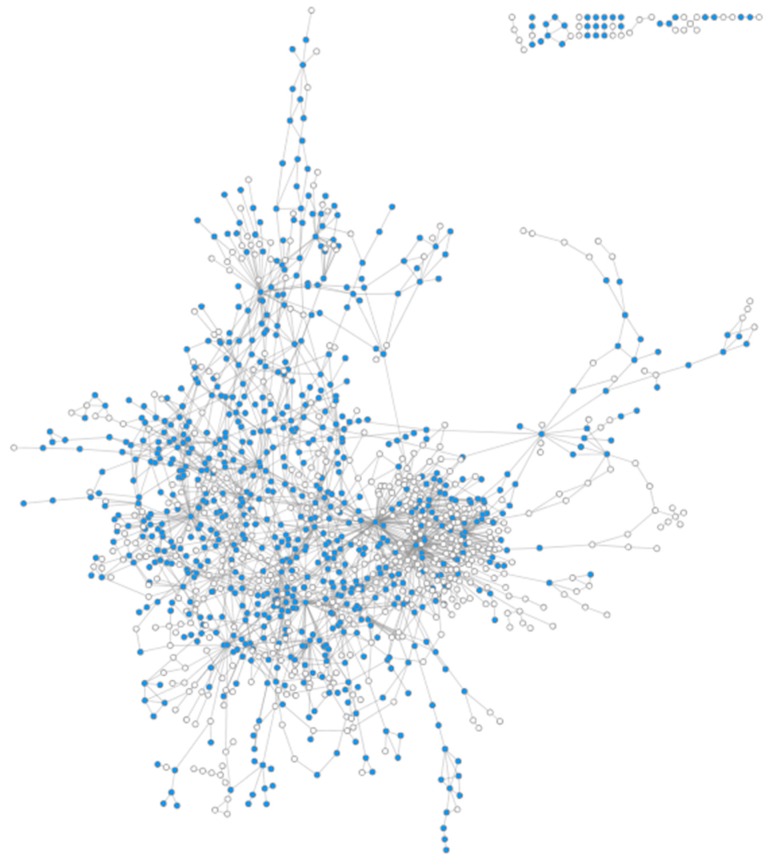
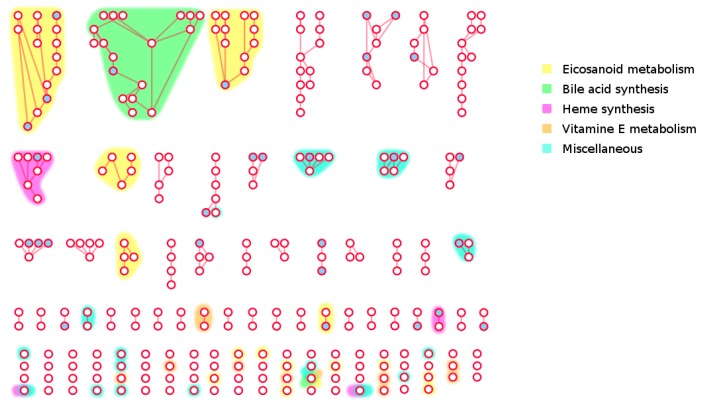
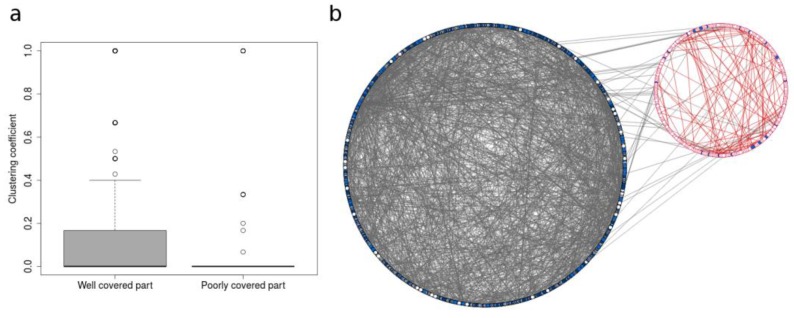
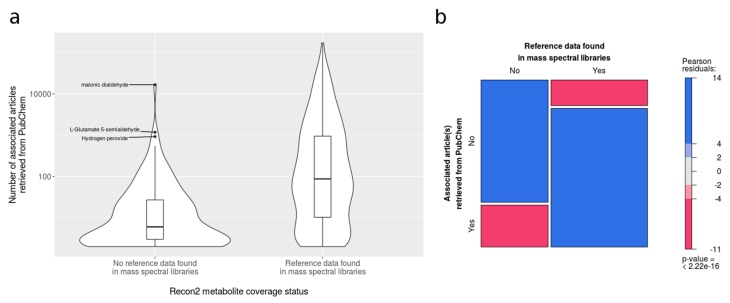
The use of mass spectrometry-based metabolomics to study human, plant and microbial biochemistry and their interactions with the environment largely depends on the ability to annotate metabolite structures by matching mass spectral features of the measured metabolites to curated spectra of reference standards. While reference databases for metabolomics now provide information for hundreds of thousands of compounds, barely 5% of these known small molecules have experimental data from pure standards. Remarkably, it is still unknown how well existing mass spectral libraries cover the biochemical landscape of prokaryotic and eukaryotic organisms. To address this issue, we have investigated the coverage of 38 genome-scale metabolic networks by public and commercial mass spectral databases, and found that on average only 40% of nodes in metabolic networks could be mapped by mass spectral information from standards. Next, we deciphered computationally which parts of the human metabolic network are poorly covered by mass spectral libraries, revealing gaps in the eicosanoids, vitamins and bile acid metabolism. Finally, our network topology analysis based on the betweenness centrality of metabolites revealed the top 20 most important metabolites that, if added to MS databases, may facilitate human metabolome characterization in the future.

Keywords: mass spectral libraries; metabolic networks; metabolite annotation; metabolomics data mapping.


Conflict of interest statement

Authors declare no conflict of interest.

Figures

Figure 1
Figure 1
Graph reconstruction process. (a) Hexokinase reaction as described in the Recon2 database. Colored circles provide information on shared substructures between substrates and products. (b) Compound graph: each substrate is connected to each product of the reaction. Edges are weighted by the number of carbon atoms shared between each substrate to each product. (c) Final graph: transitions that do not involve the preservation of at least one carbon atom between the source and the target were removed.
Figure 2
Figure 2
Coverage of prokaryotic and eukaryotic metabolic networks by mass spectral libraries. The genome-scale metabolic models are listed according to an increasing percentage of metabolites covered by mass spectral libraries. The percentage from 60.4 down to 23.6 is displayed to the left of each bar. “Found in mass spectral databases” refers to metabolites that can be mapped in at least one mass spectral database. “Not found in mass spectral databases” refers to compounds with an InChI from metabolic models that could not be matched with any compound in any mass spectral databases. “Ambiguous denomination” refers to compounds with undefined structures or insufficient information to retrieve the unambiguous InChIKey identifier; these compounds were not mapped.
Figure 3
Figure 3
Coverage of prokaryotic and eukaryotic metabolic networks by individual mass spectral databases. HMDB and NIST include MS2 and electron ionization (EI)-MS spectral information. Box plots show the distribution of the percentages of coverage in 38 different genome-scale metabolic networks.
Figure 4
Figure 4
Coverage of the human metabolic network. Blue nodes: Covered by MS databases. White nodes: not covered by MS databases. Isolated nodes have been removed for easy viewing of the metabolic network.
Figure 5
Figure 5
Relative coverage of metabolites’ neighborhood. Metabolites are categorized according to the coverage of their neighborhood, from fully covered to 90–100% uncovered. The Y-axis represents the number of metabolites in each category, with mapped metabolites displayed in grey, and non-mapped metabolites displayed in white.
Figure 6
Figure 6
The ‘dark side’ of Human metabolism. The least covered subgraph of Recon 2.03 obtained from LPA using mapping status as the initial state. White circles: Non-mapped metabolites. Blue circles: mapped metabolites. Edges: Substrate-product relationships. Metabolites with ambiguous identifier have been removed. Colored Hulls: Pathways overrepresented in the poorly mapped area of the human metabolic network Recon 2.03. Right-tailed Fisher exact test with Benjamini-Hochberg correction, α = 0.05.
Figure 7
Figure 7
Topological analysis of the least covered areas. (a) Clustering coefficient distribution in well covered and poorly covered parts of human metabolism. Only the main component of the whole human metabolic network is considered. (b) Well-covered area vs. poorly-covered area in the human metabolic network. Blue nodes: mapped; white nodes: unmapped. Left: Well-covered group; right: poorly covered group. The poorly covered group appears quite small and sparsely connected compared to the well-covered one. Also, there are few connections (i.e., biochemical transformation with some carbon backbone conservation) between the two groups.
Figure 8
Figure 8
Relationship between the coverage status of Recon2 metabolites and the scientific literature. (a) Violin plots showing the distribution of the number of articles associated with mapped and non-mapped metabolites in Recon2. Y axis shows the number of articles (logarithmic scale) obtained from PubMed references in PubChem entries. Only metabolites with at least one associated article are considered. (b) Mosaic plot showing the proportion of Recon2 metabolites with PubMed references. Only metabolites with PubChem CID annotation were considered. The area of the tiles is proportional to the number of metabolites within each category. The color and shade of the tiles correspond to the sign and magnitude of the Pearson residuals. The Pearson residuals represent the contribution of the tile to the chi-squared statistics, assessing whether the two variables are independent or not. Red tiles indicate the proportion of under-represented metabolites, namely, metabolites with a smaller number of PubMed references than expected if the two variables (i.e., an entry in spectral libraries and a PubMed article in PubChem) were independent, while blue tiles indicate over-represented metabolites, namely, metabolites with a greater number of PubMed references than expected.

Similar articles

Cited by

References

    1. Patti G.J., Yanes O., Siuzdak G. Innovation: Metabolomics: The apogee of the omics trilogy. Nat. Rev. Mol. Cell Biol. 2012;13:263. doi: 10.1038/nrm3314. - DOI - PMC - PubMed
    1. Panopoulos A.D., Yanes O., Ruiz S., Kida Y.S., Diep D., Tautenhahn R., Herrerías A., Batchelder E.M., Plongthongkum N., Lutz M., et al. The metabolome of induced pluripotent stem cells reveals metabolic changes occurring in somatic cell reprogramming. Cell Res. 2012;22:168–177. doi: 10.1038/cr.2011.177. - DOI - PMC - PubMed
    1. Slebe F., Rojo F., Vinaixa M., García-Rocha M., Testoni G., Guiu M., Planet E., Samino S., Arenas E.J., Beltran A., et al. FoxA and LIPG endothelial lipase control the uptake of extracellular lipids for breast cancer growth. Nat. Commun. 2016;7:11199. doi: 10.1038/ncomms11199. - DOI - PMC - PubMed
    1. Jorge T.F., Rodrigues J.A., Caldana C., Schmidt R., van Dongen J.T., Thomas-Oates J., António C. Mass spectrometry-based plant metabolomics: Metabolite responses to abiotic stress. Mass Spectrom. Rev. 2016;35:620–649. doi: 10.1002/mas.21449. - DOI - PubMed
    1. Barkal L.J., Theberge A.B., Guo C.-J., Spraker J., Rappert L., Berthier J., Brakke K.A., Wang C.C.C., Beebe D.J., Keller N.P., et al. Microbial metabolomics in open microscale platforms. Nat. Commun. 2016;7:10610. doi: 10.1038/ncomms10610. - DOI - PMC - PubMed

LinkOut - more resources