

An Analytical Framework for Integrating the Spatiotemporal Dynamics of Environmental Context and Individual Mobility in Exposure Assessment: A Study on the Relationship between Food Environment Exposures and Body Weight
- PMID: 30223592
- PMCID: PMC6163926
- DOI: 10.3390/ijerph15092022
An Analytical Framework for Integrating the Spatiotemporal Dynamics of Environmental Context and Individual Mobility in Exposure Assessment: A Study on the Relationship between Food Environment Exposures and Body Weight
Abstract
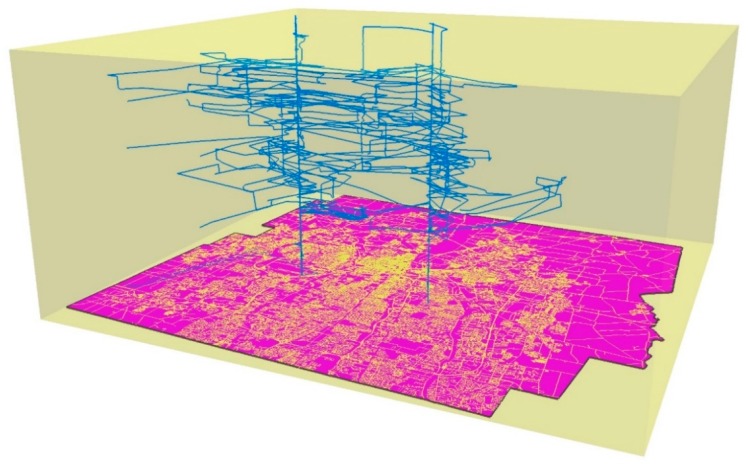
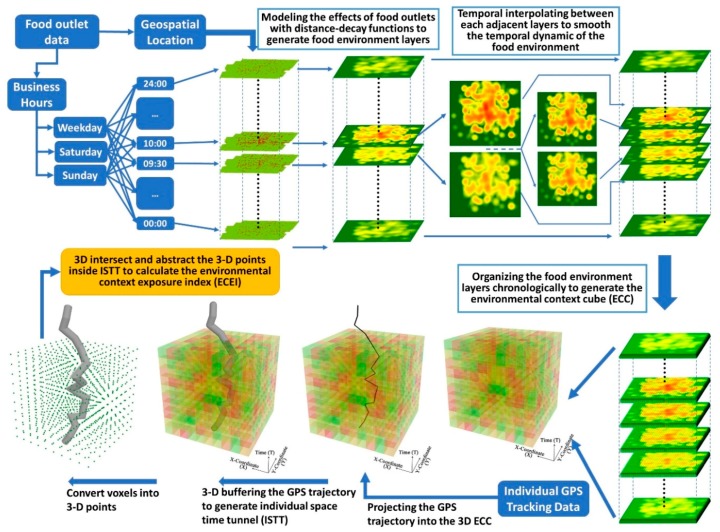
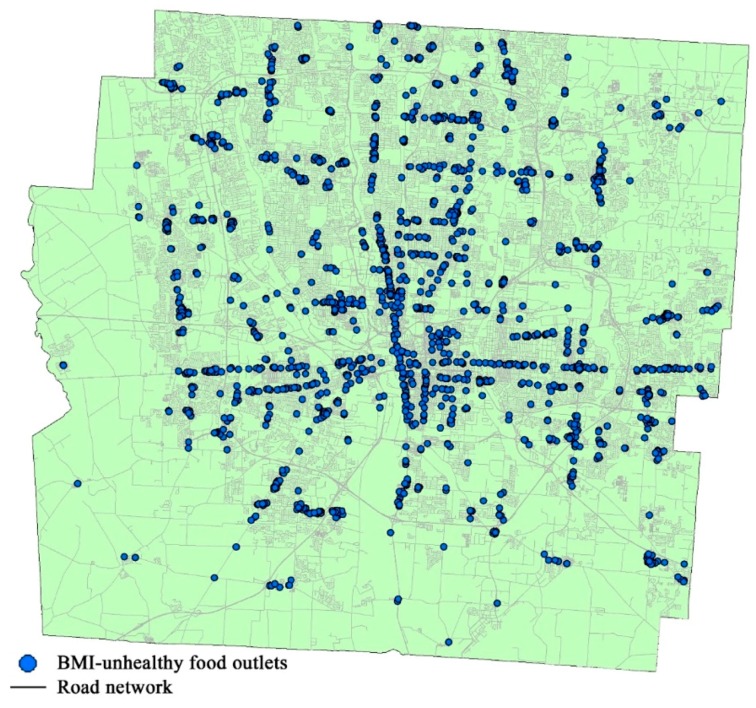
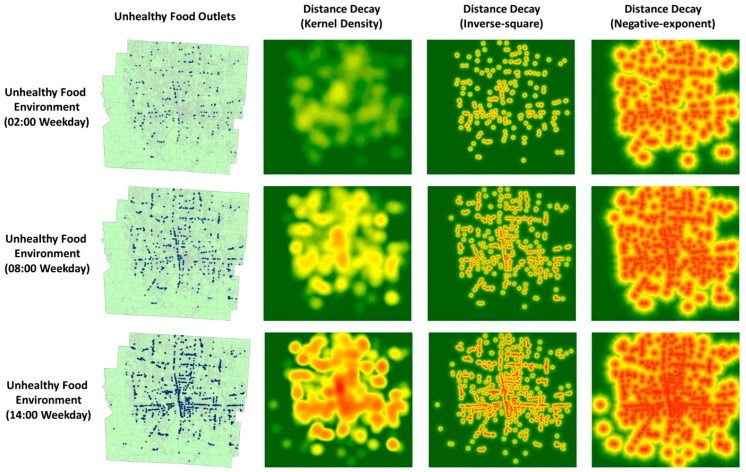
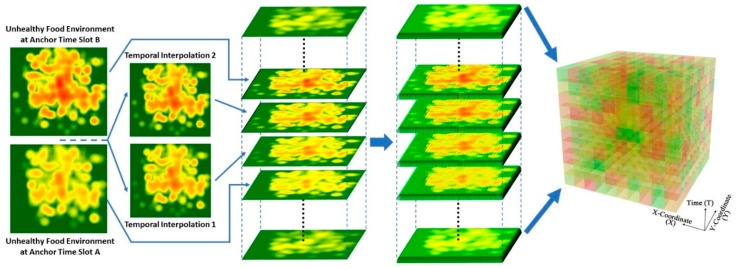
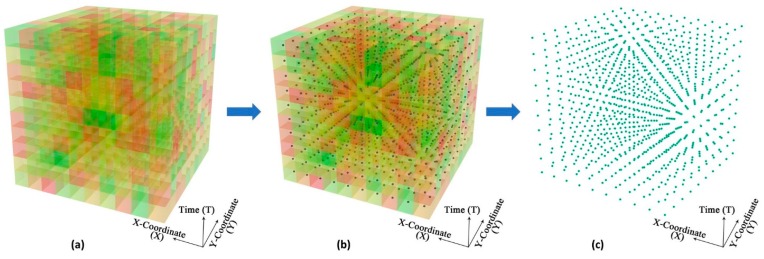
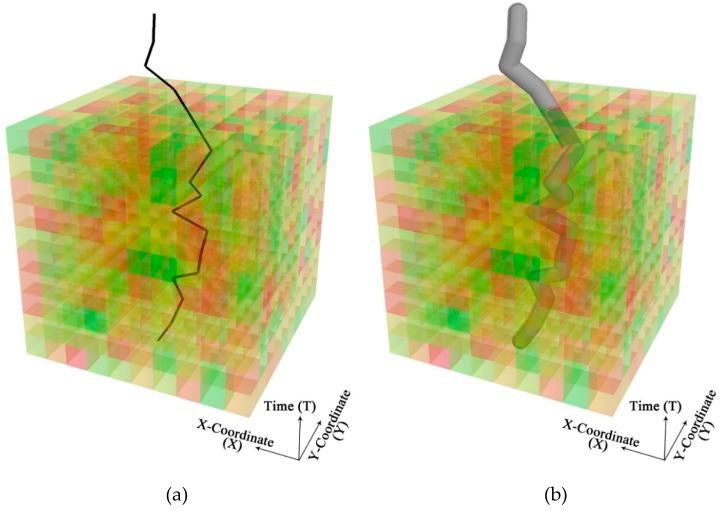
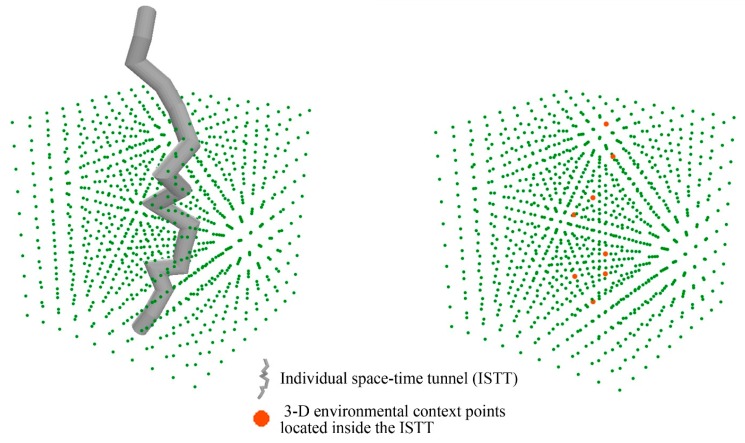
In past studies, individual environmental exposures were largely measured in a static manner. In this study, we develop and implement an analytical framework that dynamically represents environmental context (the environmental context cube) and effectively integrates individual daily movement (individual space-time tunnel) for accurately deriving individual environmental exposures (the environmental context exposure index). The framework is applied to examine the relationship between food environment exposures and the overweight status of 46 participants using data collected with global positioning systems (GPS) in Columbus, Ohio, and binary logistic regression models. The results indicate that the proposed framework generates more reliable measurements of individual food environment exposures when compared to other widely used methods. Taking into account the complex spatial and temporal dynamics of individual environmental exposures, the proposed framework also helps to mitigate the uncertain geographic context problem (UGCoP). It can be used in other environmental health studies concerning environmental influences on a wide range of health behaviors and outcomes.
Keywords: GIS; GPS; environmental context cube; environmental context exposure index; environmental health; food environment; the uncertain geographic context problem (UGCoP).
Conflict of interest statement
The authors declare no conflict of interest.
Figures
References
-
- Prüss-Ustün A., Wolf J., Corvalán C., Bos R., Neira M. Preventing Disease Through Healthy Environments: A Global Assessment of the Burden of Disease from Environmental Risks. WHO Press; Geneva, Switzerland: 2016.
-
- Sallis J.F., Cerin E., Conway T.L., Adams M.A., Frank L.D., Pratt M., Salvo D., Schipperijn J., Smith G., Cain K.L., et al. Physical activity in relation to urban environments in 14 cities worldwide: A cross-sectional study. Lancet. 2016;387:2207–2217. doi: 10.1016/S0140-6736(15)01284-2. - DOI - PMC - PubMed
-
- Ta N., Chai T.Y., Kwan M.P. Suburbanization, daily lifestyle and space-behavior interaction: A study of suburban residents in Beijing, China. Acta Geogr. Sin. 2015;70:1271–1280.
Publication types
MeSH terms
Grants and funding
LinkOut - more resources
Full Text Sources
Other Literature Sources
Medical
Miscellaneous
