. 2018 Sep 16;5(3):74.
doi: 10.3390/bioengineering5030074.

Adverse Hemodynamic Conditions Associated with Mechanical Heart Valve Leaflet Immobility

Affiliations

Adverse Hemodynamic Conditions Associated with Mechanical Heart Valve Leaflet Immobility

Fardin Khalili et al. Bioengineering (Basel). .

Abstract

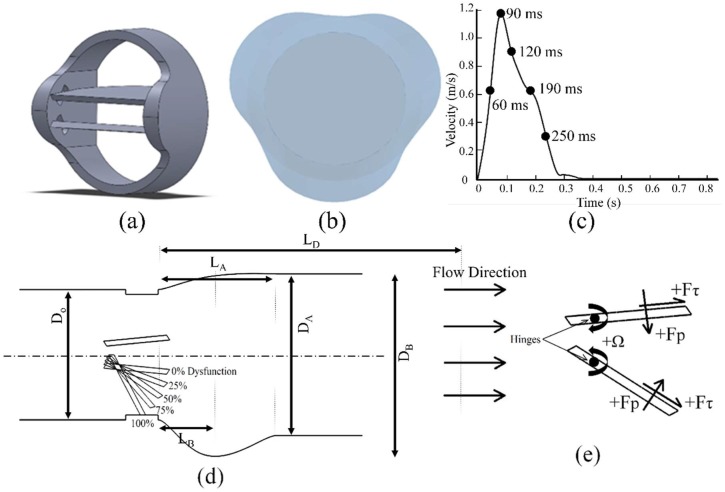
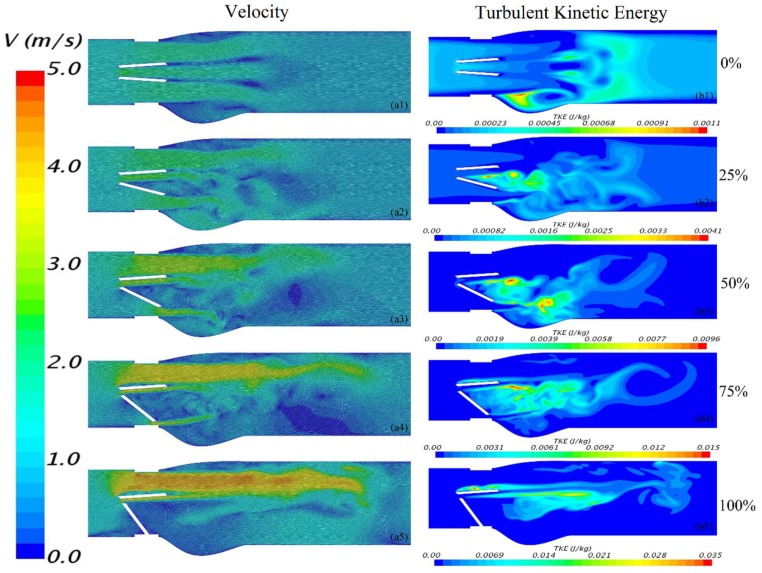
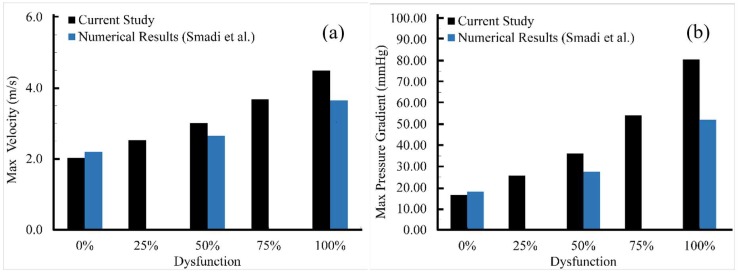
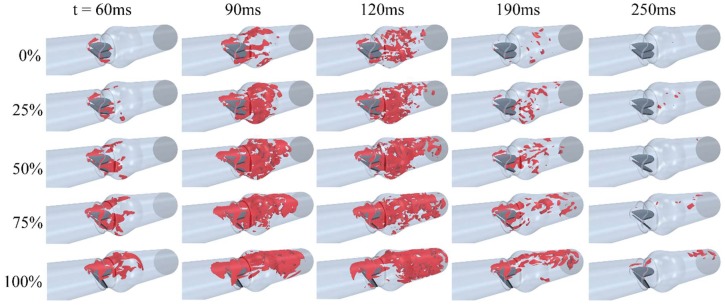
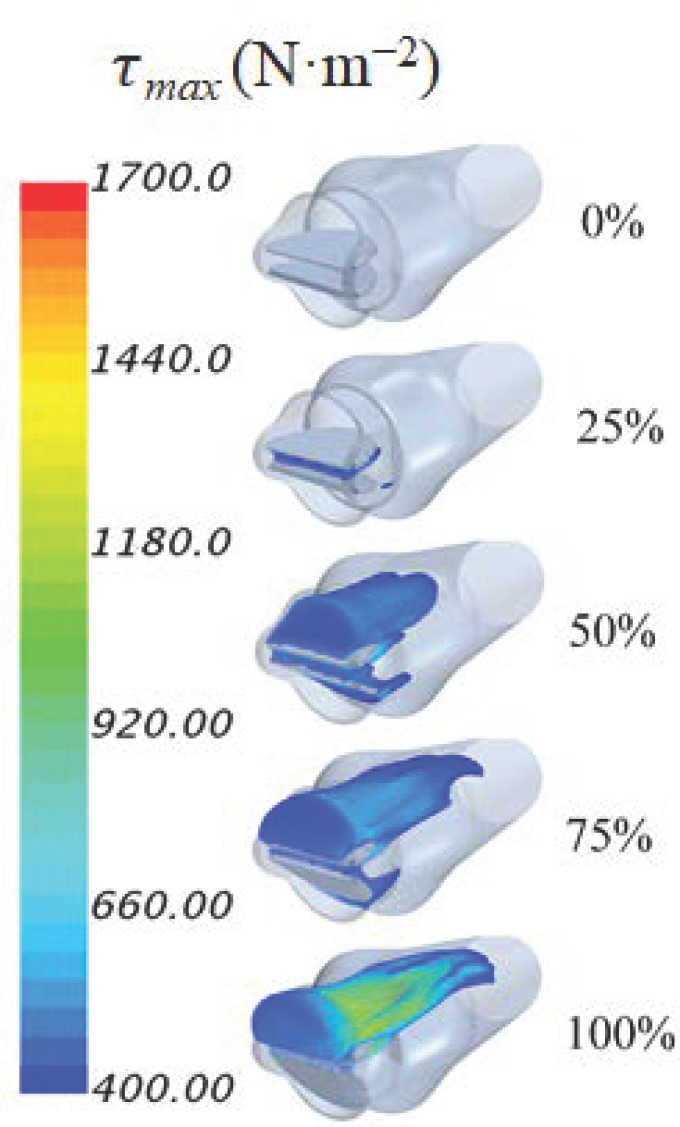
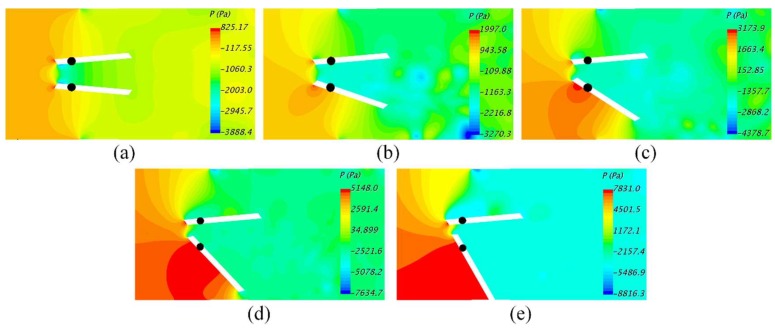
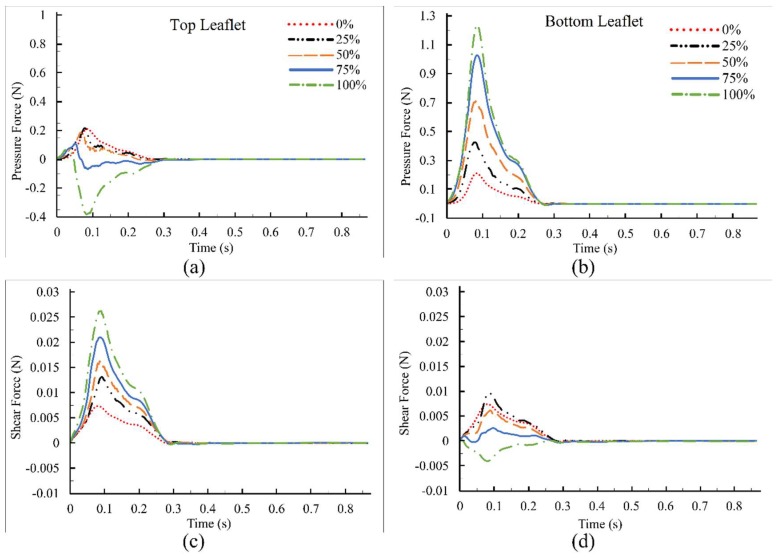
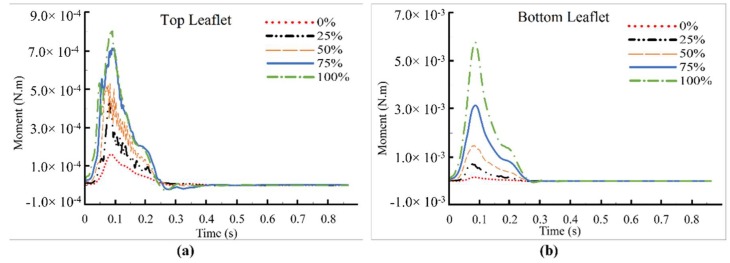
Artificial heart valves may dysfunction, leading to thrombus and/or pannus formations. Computational fluid dynamics is a promising tool for improved understanding of heart valve hemodynamics that quantify detailed flow velocities and turbulent stresses to complement Doppler measurements. This combined information can assist in choosing optimal prosthesis for individual patients, aiding in the development of improved valve designs, and illuminating subtle changes to help guide more timely early intervention of valve dysfunction. In this computational study, flow characteristics around a bileaflet mechanical heart valve were investigated. The study focused on the hemodynamic effects of leaflet immobility, specifically, where one leaflet does not fully open. Results showed that leaflet immobility increased the principal turbulent stresses (up to 400%), and increased forces and moments on both leaflets (up to 600% and 4000%, respectively). These unfavorable conditions elevate the risk of blood cell damage and platelet activation, which are known to cascade to more severe leaflet dysfunction. Leaflet immobility appeared to cause maximal velocity within the lateral orifices. This points to the possible importance of measuring maximal velocity at the lateral orifices by Doppler ultrasound (in addition to the central orifice, which is current practice) to determine accurate pressure gradients as markers of valve dysfunction.

Keywords: adverse hemodynamics; bileaflet mechanical heart valve; blood damage; computational fluid dynamics; platelet activation; transvalvular pressure gradients; turbulent shear stresses.


Conflict of interest statement

No conflict of interest to be declared.

Figures

Figure 1
Figure 1
The geometry, inlet conditions and sign convention used in the current study: (a) Valve geometry; (b) Cross-section of the aortic root sinuses; (c) Inlet velocity profile; (d) Degrees of bottom leaflet dysfunction; and (e) Sign conventions for forces acting on the leaflets.
Figure 2
Figure 2
High quality mesh generated (a) close to the wall and leaflet surfaces; (b) in the flow domain; and (c) cross-sectional view of the mesh in the aortic root sinuses region downstream of the heart valve.
Figure 3
Figure 3
(a) Velocity profile at the entrance of the aortic sinuses for different grid solution; (b) Fine-grid solution with discretization error bars.
Figure 4
Figure 4
(a) Normalized velocity profiles at 7 mm downstream of the valve (at the peak systole) in the current study compared to previous experimental [53] and computational [13] studies. More agreement can be seen between the current and the experimental study; (b) Normalized velocity profiles at the trailing edge of the leaflets (105 ms after the peak systole) in the current study compared to previous experimental [43] and computational [7] studies.
Figure 5
Figure 5
Velocity (a1–a5) and turbulent kinetic energy (b1–b5) at 90 ms for different degrees of lower leaflet dysfunction. There was a general trend of increased maximum velocity and TKE with increased dysfunction. (Note that the scale for TKE was increased with dysfunction).
Figure 6
Figure 6
Comparison of the current study results with available data from a previous computational study [2]: (a) Maximum velocity at the entrance of the aortic sinuses, and (b) maximum pressure gradients across the valve computed from simplified Bernoulli equation. Both quantities continuously increased with dysfunction. While the trends were similar, differences may be due to the geometrical variations and the fact that the current study performed 3D compared to 2D simulation.
Figure 7
Figure 7
Helicity isosurfaces (isovalue = 414 m.s−2) at different times and dysfunctions. A general increase in helicity was observed with dysfunction.
Figure 8
Figure 8
Principal shear stresses for different levels of dysfunction at the peak systole. Elevated levels of principal stresses were observed with dysfunction, which increase blood damage risks. Published cutoff stress value for damage is above 400 N·m−2 [25].
Figure 9
Figure 9
(a) 0%; (b) 25%; (c) 50%; (d) 75%; and (e) 100%. For dysfunction ≥ 75%, a region of high pressure developed at the bottom surface of the functional leaflet upstream of the hinge, which would generate moments that tend to keep that leaflet open.
Figure 10
Figure 10
Net pressure and shear forces on leaflets: (a) Fp on top leaflet; (b) Fp on bottom leaflet; (c) Fτ on top leaflet; and (d) Fτ on bottom leaflet. The sign of some forces started to reverse at high levels of dysfunction. The legends are consistent for all four figures.
Figure 11
Figure 11
Net moments on: (a) Top leaflet, and (b) Bottom leaflet. The moments tended to be in the directions of leaflet opening. All moments increased with dysfunction. In most cases of dysfunction, the moments on the dysfunctional leaflet were higher (note the different scale for the dysfunctional leaflet).

Similar articles

Cited by

References

    1. WHO Fact sheet: Cardiovascular Diseases (CVDs) [(accessed on 16 September 2018)]; Available online: http://www.who.int/mediacentre/factsheets/fs317/en/
    1. Smadi O., Hassan I., Pibarot P., Kadem L. Numerical and experimental investigations of pulsatile blood flow pattern through a dysfunctional mechanical heart valve. J. Biomech. 2010;43:1565–1572. doi: 10.1016/j.jbiomech.2010.01.029. - DOI - PubMed
    1. Khalili F., Gamage P.P.T., Mansy H.A. Prediction of Turbulent Shear Stresses through Dysfunctional Bileaflet Mechanical Heart Valves using Computational Fluid Dynamics; Proceedings of the 3rd Thermal and Fluids Engineering Conference (TFEC); Fort Lauderdale, FL, USA. 4–7 March 2018; pp. 1–9.
    1. Emery R.W., Mettler E., Nicoloff D.M. A new cardiac prosthesis: the St. Jude Medical cardiac valve: In vivo results. Circulation. 1979;60:48–54. doi: 10.1161/01.CIR.60.2.48. - DOI - PubMed
    1. Gott V.L., Alejo D.E., Cameron D.E. Mechanical Heart Valves: 50 Years of Evolution. Ann. Thorac. Surg. 2003;76:2230–2239. doi: 10.1016/j.athoracsur.2003.09.002. - DOI - PubMed

LinkOut - more resources