. 2018 Sep 17;18(1):31.
doi: 10.1186/s12880-018-0266-4.

Standardized quality metric system for structural brain magnetic resonance images in multi-center neuroimaging study

Affiliations

Standardized quality metric system for structural brain magnetic resonance images in multi-center neuroimaging study

Michael E Osadebey et al. BMC Med Imaging. .

Abstract

Background: Multi-site neuroimaging offer several benefits and poses tough challenges in the drug development process. Although MRI protocol and clinical guidelines developed to address these challenges recommend the use of good quality images, reliable assessment of image quality is hampered by the several shortcomings of existing techniques.

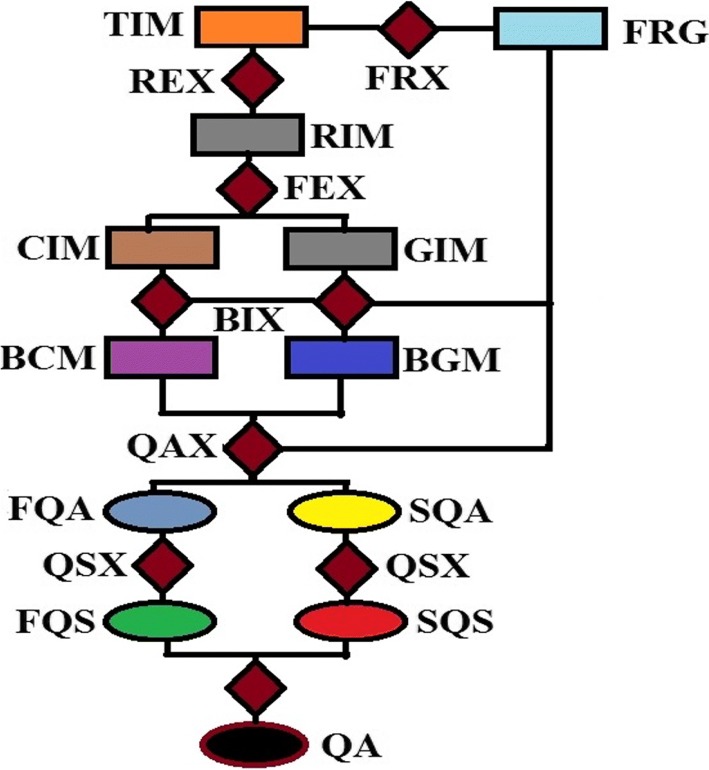
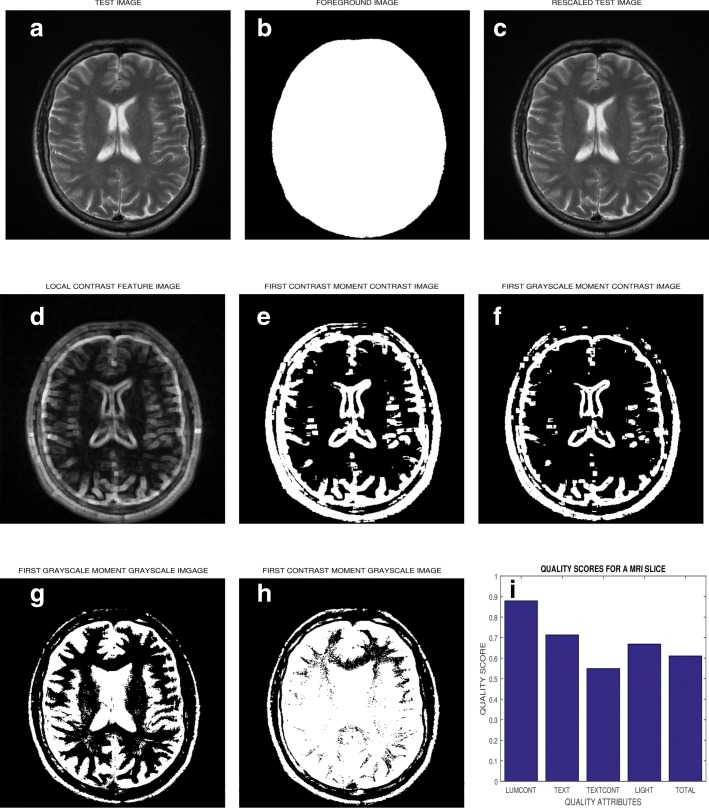
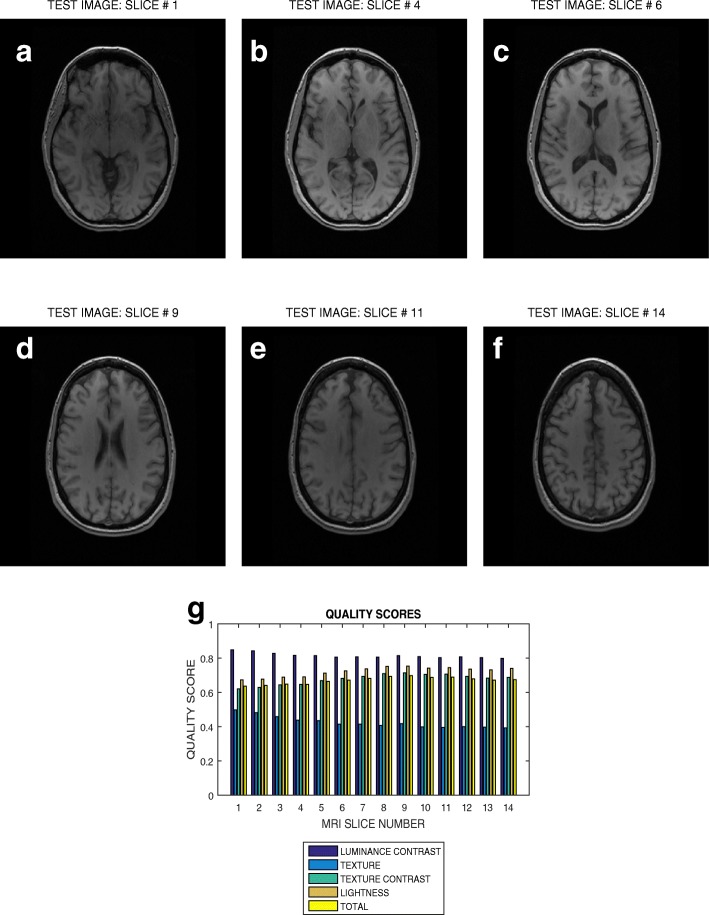
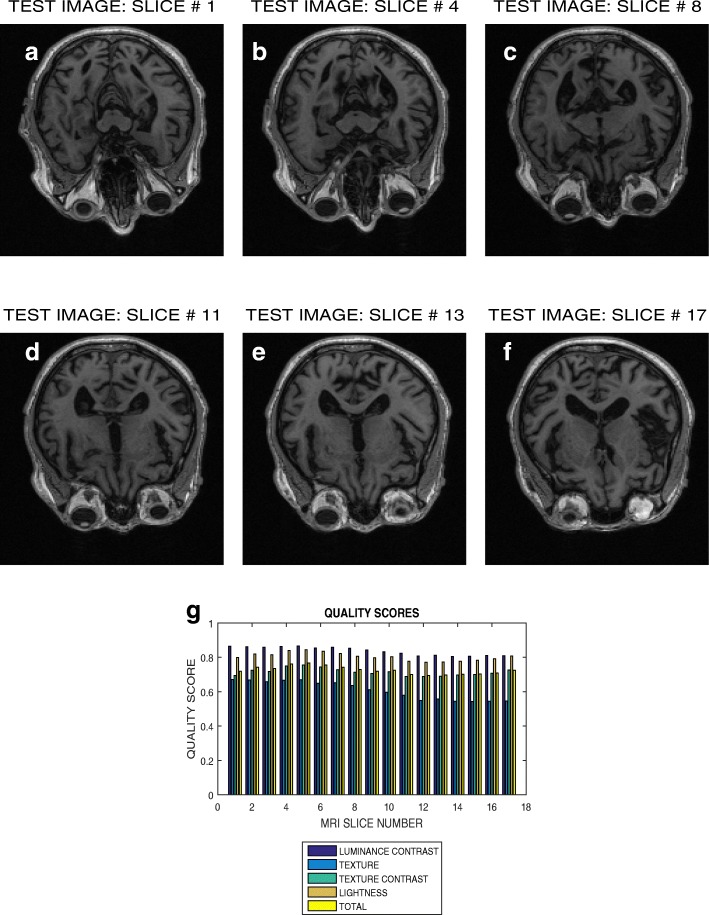
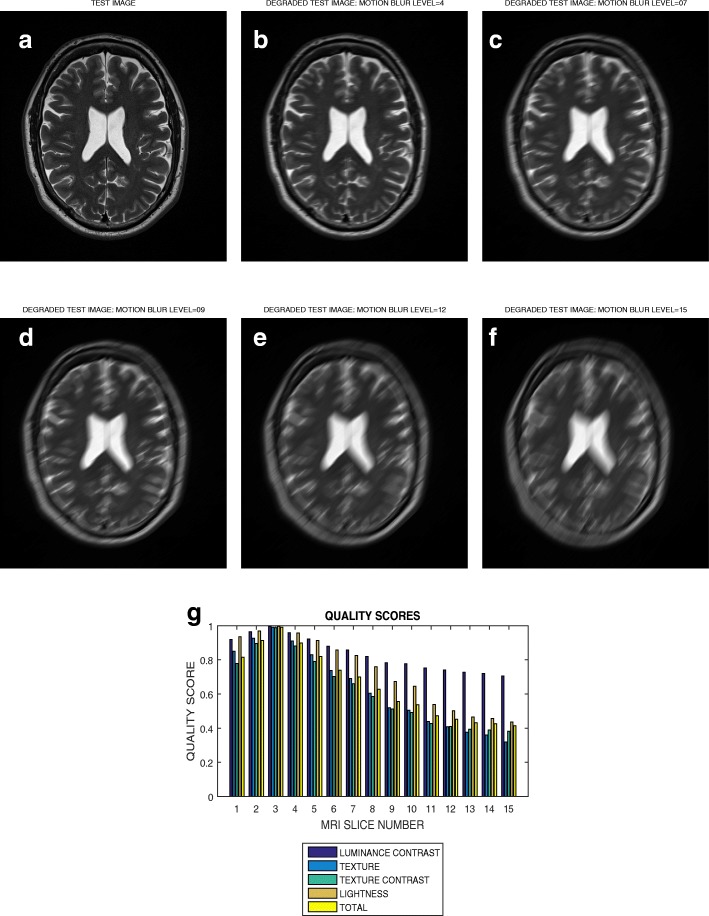
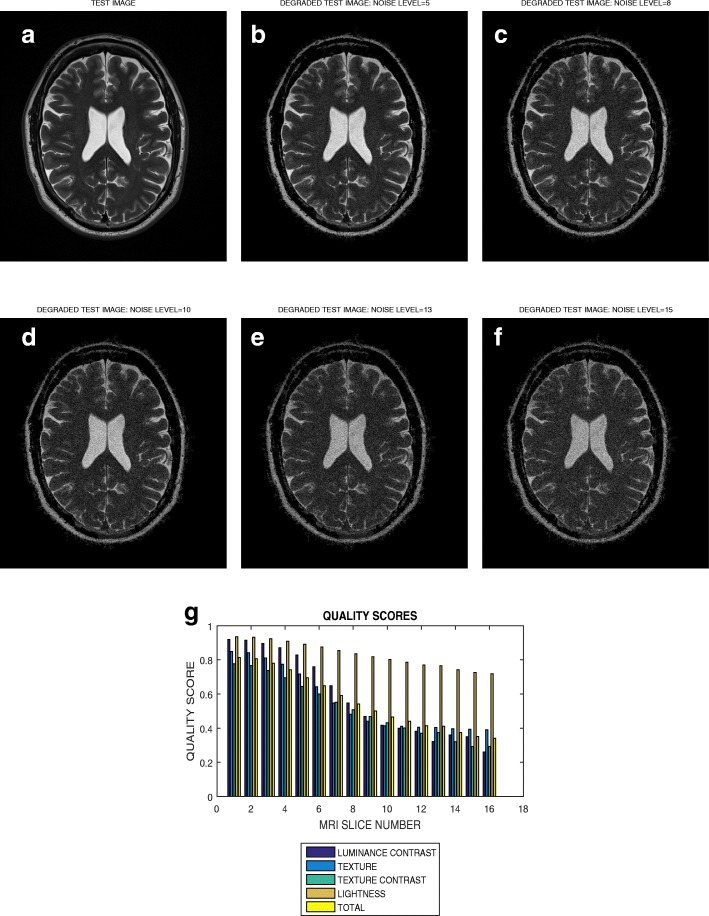
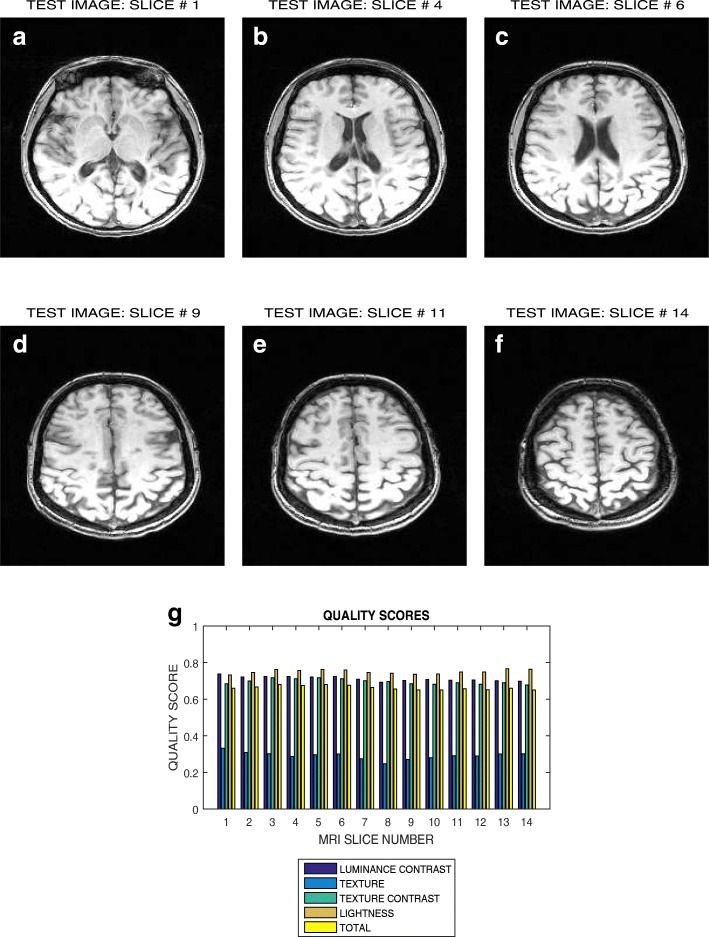
Methods: Given a test image two feature images are extracted. They are grayscale and contrast feature images. Four binary images are generated by setting four different global thresholds on the feature images. Image quality is predicted by measuring the structural similarity between appropriate pairs of binary images. The lower and upper limits of the quality index are 0 and 1. Quality prediction is based on four quality attributes; luminance contrast, texture, texture contrast and lightness.

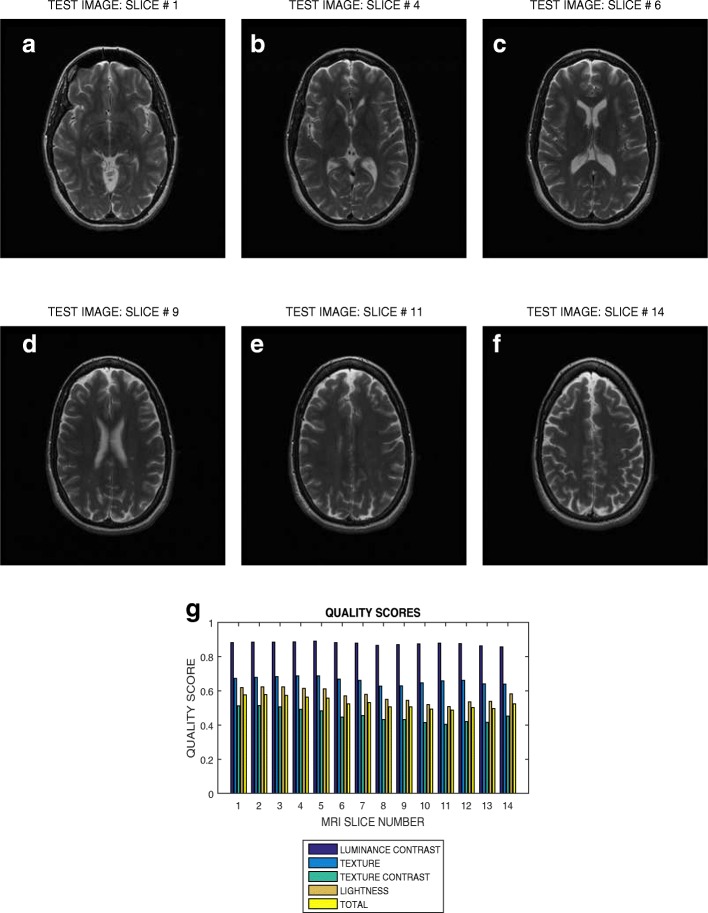
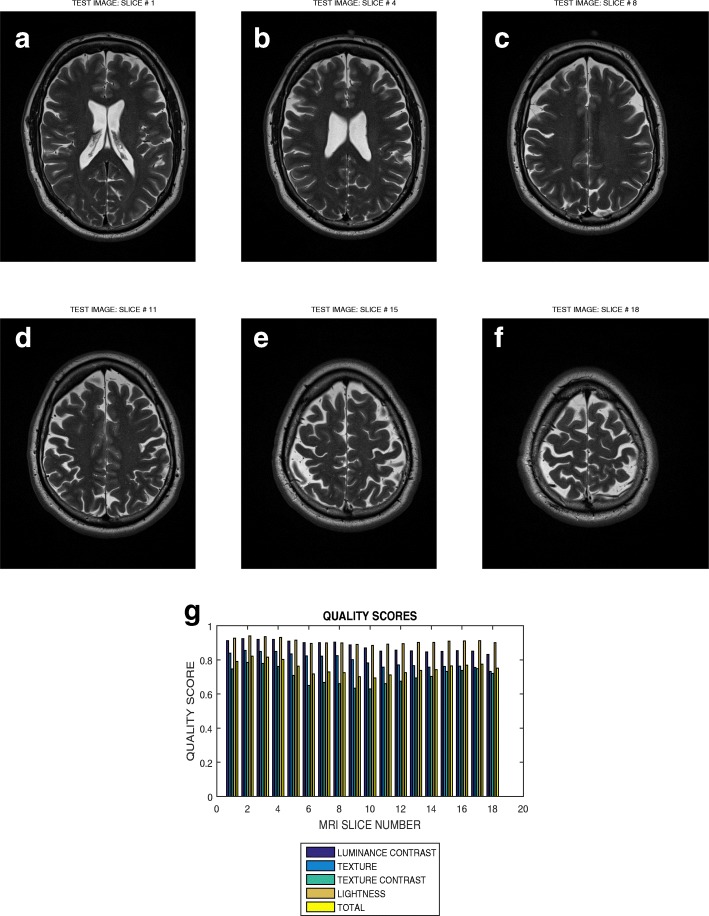
Results: Performance evaluation on test data from three multi-site clinical trials show good objective quality evaluation across MRI sequences, levels of distortion and quality attributes. Correlation with subjective evaluation by human observers is ≥ 0.6.

Conclusion: The results are promising for the evaluation of MRI protocols, specifically the standardization of quality index, designed to overcome the challenges encountered in multi-site clinical trials.

Keywords: Brain MRI; Grayscale feature image; Image moment; Image quality; Local contrast feature image; Magnetic resonance imaging (MRI).


Conflict of interest statement

Ethics approval and consent to participate

This study which focus on quality evaluation was based on the analysis of anonymized and retrospectively acquired data. Administrative permissions to access the anonymized data were separately granted by the three organizations that provided the data. ADNI gave permission to access data on April 8, 2017. NeuroRx Research Inc. gave permission to access data on January 7, 2015. BrainCare Oy. gave permission to access data on December 27, 2015. Ethics approval was deemed unnecessary according to the regulations of the Norwegian Regional Committees for Medical and Health Research Ethics (REK) published on 12 January 2012 and available at (https://helseforskning.etikkom.no/reglerogrutiner/soknadsplikt/sokerikkerek?p_dim=34999&_ikbLanguageCode=us).

Consent for publication

Not Applicable.

Competing interests

The authors declare that they have no competing interests.

Publisher’s Note

Springer Nature remains neutral with regard to jurisdictional claims in published maps and institutional affiliations.

Figures

Fig. 1
Fig. 1
The flow chart for post-acquisition quality evaluation of a brain MRI slice. Foreground FRG is extracted FRX from the test image TIM. The test image is rescaled REX so that its pixel intensity levels is between 0 and 1. Two feature images, local contrast feature image CIM and grayscale image GIM are extracted from the rescaled image RIM. Global thresholding transforms the feature images into four binary feature images (only two BCM and BGM of the four binary feature images are shown). Determination of quality attributes QAX gives luminance contrast, texture contrast, texture and lightness quality attributes (only two, FQA and SQA of the four quality attributes are shown). The quality attributes are determined by matching relevant combinations of the binary feature images. Computation of quality score QSX for each quality attribute gives luminance contrast, texture, texture contrast and lightness quality scores (only two, FQS and SQS, of the four quality scores are shown). The total quality score QA is the weighted sum of the scores assigned to each quality attribute
Fig. 2
Fig. 2
The different stages of the algorithm for post-acquisition quality evaluation of a brain MRI slice. a The test image has its (b) foreground extracted. c The test image in (a) has its pixel intensity levels rescaled to lie between 0 and 1. d Grayscale and contrast feature images are extracted from the test image. Duplicating the rescaled image in (c) extracts the grayscale image at no computational cost. e, f, g and h are the four binary feature images generated by using the first moments of the feature images in (c) and (d) as global thresholds. i Luminance contrast, texture, texture contrast, lightness and total quality scores are computed by matching relevant pairs of the feature images in (e), (f), (g) and (h)
Fig. 3
Fig. 3
Six slices with indices (a) 1, (b) 4, (c) 6, (d) 9, (e) 11 and (f) 14 in a T2 weighted MRI volume data from NeuroRx Research Inc, (g) luminance contrast, texture, texture contrast, lightness and total quality scores of 14 successive slices in the MRI volume data
Fig. 4
Fig. 4
Six slices with indices (a) 1, (b) 4, (c) 8, (d) 11, (e) 15 and (f) 18 in a T2 weighted MRI volume data from BrainCare Oy, (g) luminance contrast, texture, texture contrast, lightness and total quality scores of 18 successive slices in the MRI volume data
Fig. 5
Fig. 5
Six slices with indices (a) 1, (b) 4, (c) 6, (d) 9, (e) 11 and (f) 14 in a T1 weighted MRI volume data from NeuroRx Research Inc., (g) luminance contrast, texture, texture contrast, lightness and total quality scores of 14 successive slices in the MRI volume data
Fig. 6
Fig. 6
Six slices with indices (a) 1, (b) 4, (c) 8, (d) 11, (e) 13 and (f) 17 in a T1 MPRAGE pulse sequence MRI volume data from ADNI, (g) luminance contrast, texture, texture contrast, lightness and total quality scores of 17 successive slices in the MRI volume data
Fig. 7
Fig. 7
a A T2 weighted slice degraded by circular averaging filter of radius (b) 5, (c) 8, (d) 10, (e) 13 and (f) 15 pixels. g variation of the luminance contrast, texture, texture contrast, lightness and total quality scores with blur levels increasing from 1 to 15
Fig. 8
Fig. 8
a A T2 weighted slice and its degraded versions at motion blur levels (b) 5, (c) 8, (d) 10, (e) 13 and (f) 15 pixels, (g) variation of the luminance contrast, texture, texture contrast, lightness and total quality scores with blur levels increasing from 1 to 15
Fig. 9
Fig. 9
a A T2 weighted slice and its degraded versions at Rician noise levels (b) 5, (c) 8, (d) 10, (e) 13 and (f) 15 percent, (g) variation of the luminance contrast, texture, texture contrast, lightness and total quality scores with noise levels increasing from 1 to 15
Fig. 10
Fig. 10
Six slices with indices (a) 1, (b) 4, (c) 6, (d) 9, (e) 11, (f) 14 in a T1 weighted MRI volume data degraded by different configurations of bias fields, (g) luminance contrast, texture, texture contrast, lightness and total quality scores for each slice in the volume data

Similar articles

Cited by

References

    1. Arnold D, Stone L. The clinical usefulness of routine mri assessment. Int MS J. 2010;17(2):58–63. - PubMed
    1. Lillemark L, Sørensen L, Pai A, Dam EB, Nielsen M. Brain regions relative proximity as marker for alzheimers disease based on structural mri. BMC Med Imaging. 2014;14(1):21. doi: 10.1186/1471-2342-14-21. - DOI - PMC - PubMed
    1. Oreja-Guevara C. Overview of magnetic resonance imaging for management of relapsing- remitting multiple sclerosis in everyday practice. Eur J Neurol. 2015;22(S2):22–27. doi: 10.1111/ene.12800. - DOI - PubMed
    1. Zhang Y, Wang S, Phillips P, Dong Z, Ji G, Yang J. Detection of alzheimer’s disease and mild cognitive impairment based on structural volumetric mr images using 3d-dwt and wta-ksvm trained by psotvac. Biomed Signal Proc Control. 2015;21:58–73. doi: 10.1016/j.bspc.2015.05.014. - DOI
    1. Frisoni GB, Fox NC, Jack CR, Scheltens P, Thompson PM. The clinical use of structural mri in alzheimer disease. Nat Rev Neurol. 2010;6(2):67–77. doi: 10.1038/nrneurol.2009.215. - DOI - PMC - PubMed

Publication types