. 2019 Jan 1;25(1):312-324.
doi: 10.1158/1078-0432.CCR-18-0867. Epub 2018 Sep 17.

NOTCH1 Represses MCL-1 Levels in GSI-resistant T-ALL, Making them Susceptible to ABT-263

Affiliations

NOTCH1 Represses MCL-1 Levels in GSI-resistant T-ALL, Making them Susceptible to ABT-263

Anahita Dastur et al. Clin Cancer Res. .

Abstract

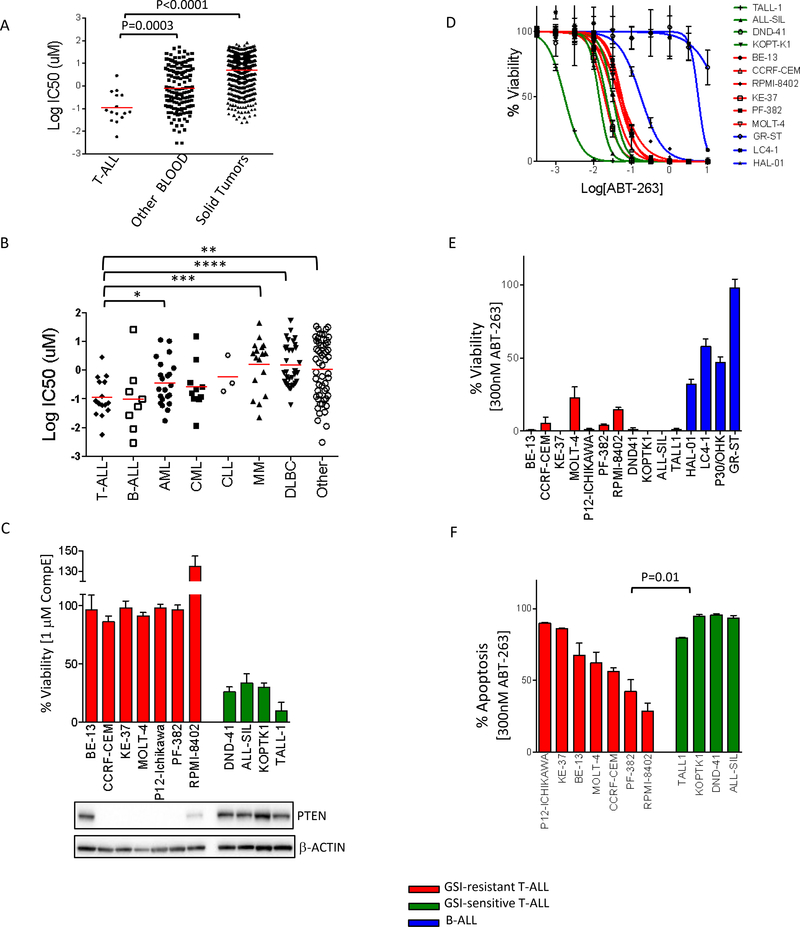
Purpose: Effective targeted therapies are lacking for refractory and relapsed T-cell acute lymphoblastic leukemia (T-ALL). Suppression of the NOTCH pathway using gamma-secretase inhibitors (GSI) is toxic and clinically not effective. The goal of this study was to identify alternative therapeutic strategies for T-ALL.

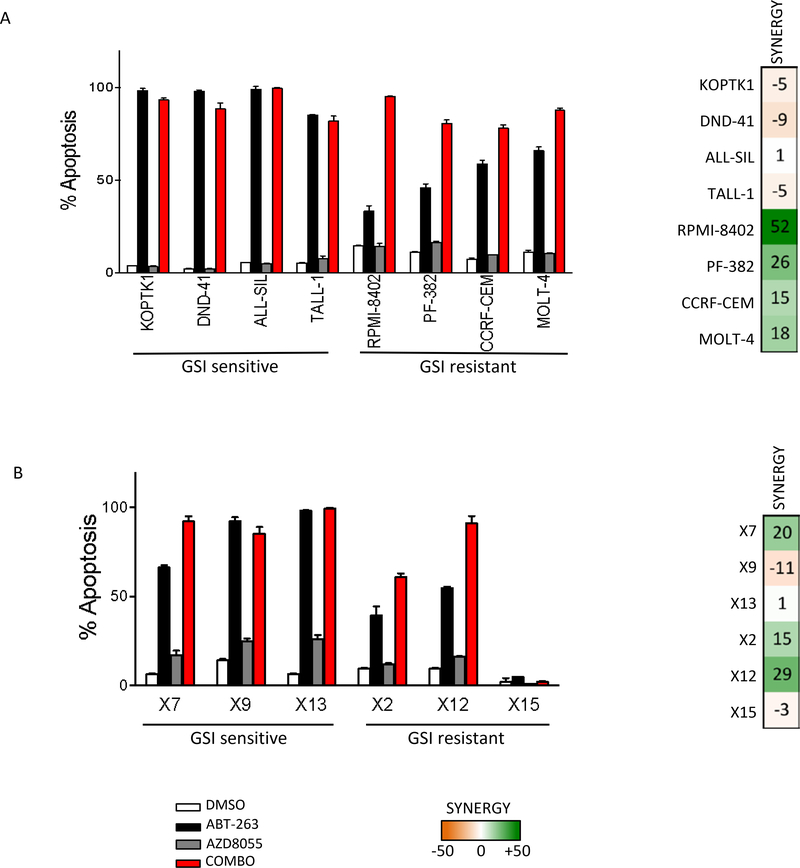
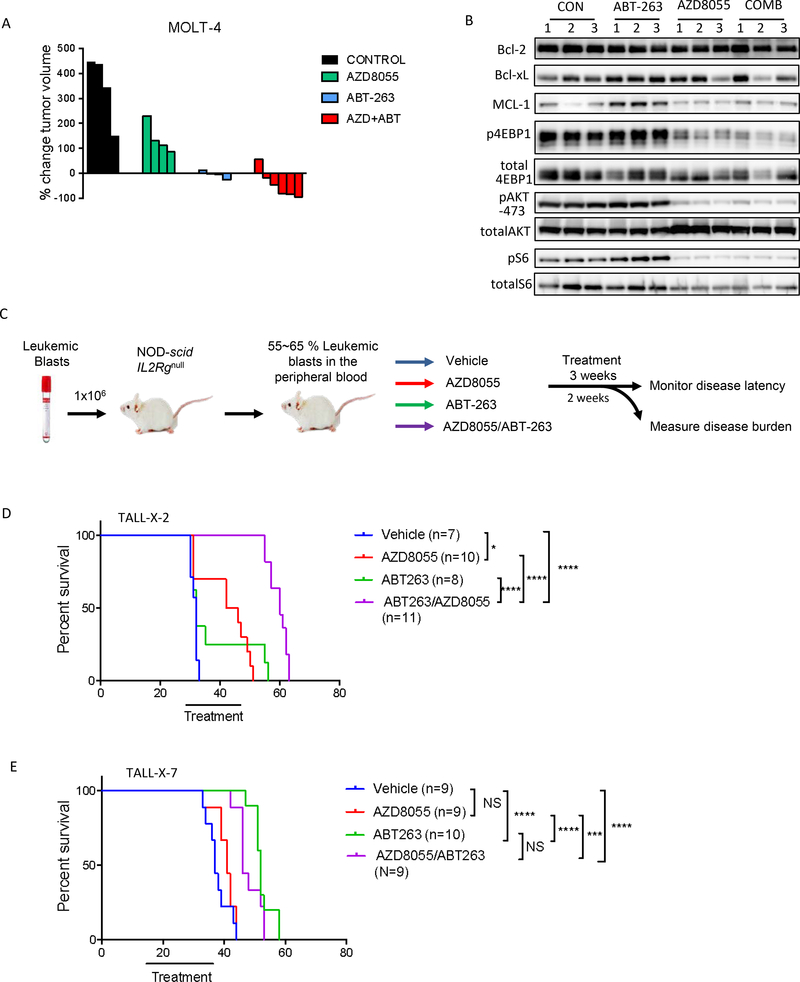
Experimental design: We performed a comprehensive analysis of our high-throughput drug screen across hundreds of human cell lines including 15 T-ALL models. We validated and further studied the top hit, navitoclax (ABT-263). We used multiple human T-ALL cell lines as well as primary patient samples, and performed both in vitro experiments and in vivo studies on patient-derived xenograft models.

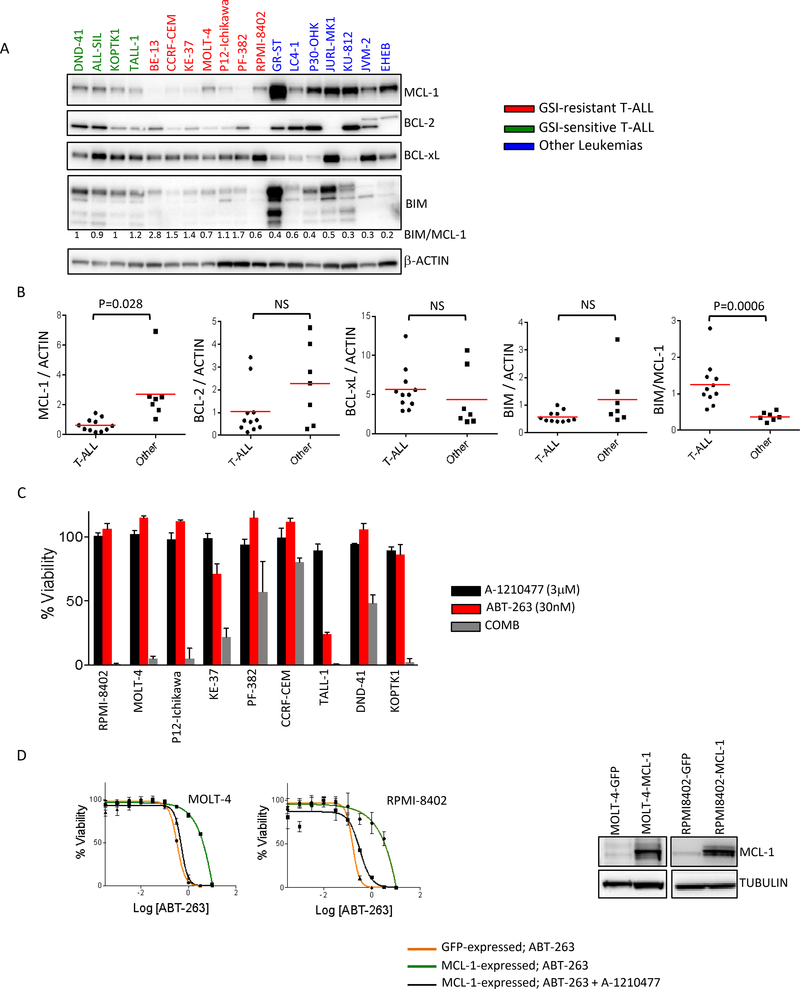
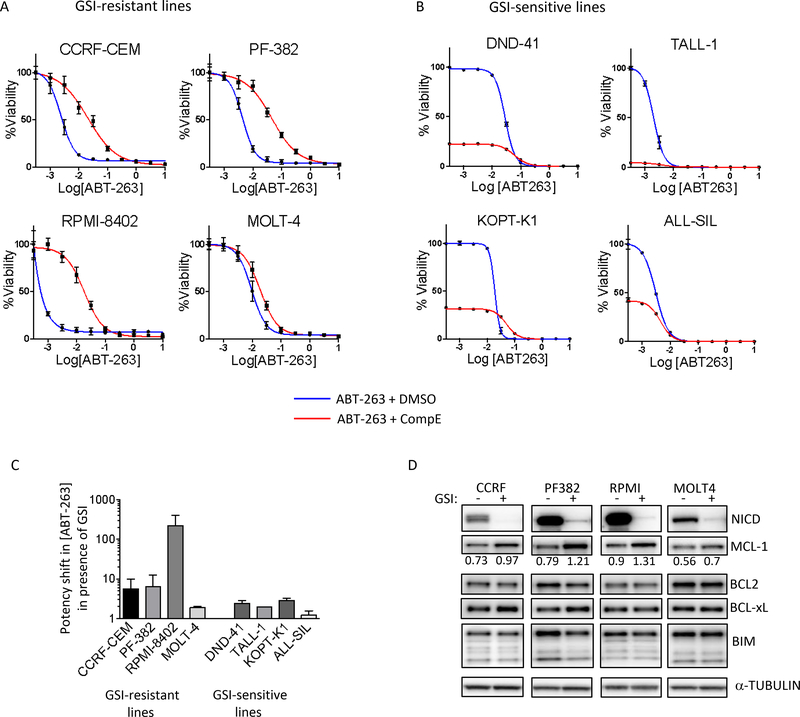
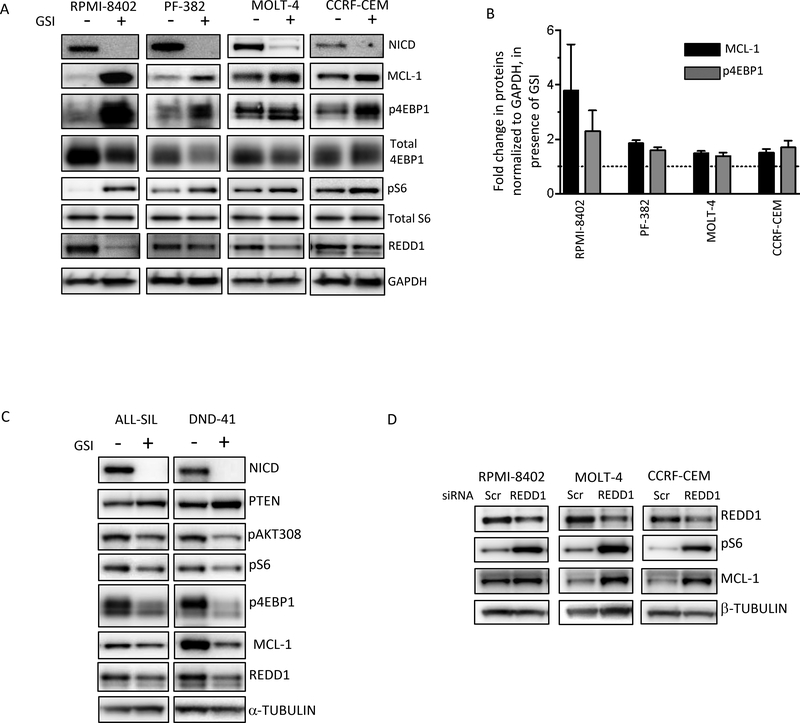
Results: We found that T-ALL are hypersensitive to navitoclax, an inhibitor of BCL2 family of antiapoptotic proteins. Importantly, GSI-resistant T-ALL are also susceptible to navitoclax. Sensitivity to navitoclax is due to low levels of MCL-1 in T-ALL. We identify an unsuspected regulation of mTORC1 by the NOTCH pathway, resulting in increased MCL-1 upon GSI treatment. Finally, we show that pharmacologic inhibition of mTORC1 lowers MCL-1 levels and further sensitizes cells to navitoclax in vitro and leads to tumor regressions in vivo.

Conclusions: Our results support the development of navitoclax, as single agent and in combination with mTOR inhibitors, as a new therapeutic strategy for T-ALL, including in the setting of GSI resistance.


Conflict of interest statement

Conflict-of-Interest Disclosure: C.H.B. receives sponsored research from Novartis and Amgen. J.A.E. and C.C are employees of Novartis. The other authors have nothing to disclose.

Figures

Figure 1.
Figure 1.. GSI-resistant cell lines are sensitive to ABT-263.
(A) Sensitivity values (log10 IC50 μM) of 888 human cell lines treated with ABT-263, comparing T-ALLs, other leukemic and lymphatic lines (blood) and solid tumors. Each dot represents one cell line and each red bar is the geometric mean for that group. An unpaired t-test was used to assess the differences in mean IC50 between the T-ALLs and the other two groups. Data obtained from our high throughput screen collaboration - Genomics of Drug Sensitivity in Cancer - http://www.cancerrxgene.org (B) Sensitivity values (log10 IC50 μM) of 163 hematopoietic and lymphoid cell lines treated with ABT-263. These cell lines, which in Fig (A) were clustered together under T-ALL and Other Blood groups, are further classified based on cancer type. Each dot represents one cell line and each red bar is the geometric mean for that group. Data was analyzed using student t test (*p<0.05, **p<0.01, ***p<0.001, ****p<0.0001). B-ALL, CML and CLL are not significantly different when compared to T-ALL (C) Top: A panel of GSI-resistant (red) and GSI-sensitive (green) T-ALL lines were treated either with DMSO or with 1 μM CompE for 7 days. Percentage viability compared to DMSO treatment was measured using CellTiter-Glo. The values shown are an average of two biological replicates, ± SD. Bottom: For each cell line, 15 μg of cell lysates were subjected to western blotting and probed with the indicated antibodies. (D) Dose response curves of GSI-resistant (red) and GSI-sensitive (green) T-ALL lines and B-ALL lines (blue) to ABT-263. Cell lines were treated with ABT-263 for 3 days, and viability was measured with CellTiter-Glo (E) 14 human ALL lines, including GSI-resistant T-ALLs (red), GSI-sensitive T-ALLs (green) or B-ALLs (blue), were treated with 300 nM ABT-263 for 3 days. Viability was measured using CellTiter-Glo and plotted as a percentage (drug treated samples / DMSO-treated controls). The values shown are an average of two biological replicates, each in triplicate ± SD. (F) GSI-resistant (red) and GSI-sensitive (green) T-ALL cell lines were treated with 300 nM ABT-263 for 48h, after which cells were stained with propidium iodide and Annexin-V. Apoptosis was measured by FACS analysis as percentage annexin-positive cells, and normalized against DMSO-treated controls. The experiment was done in triplicate and the values shown are mean ± SD.
Figure 2.
Figure 2.. Low MCL-1 levels are responsible for hypersensitivity to ABT-263.
(A) 15 μg of cell extract from each of the GSI-sensitive (green) and GSI-resistant (red) T-ALL lines and 7 other leukemic cell lines (blue) was separated by SDS-PAGE and probed with the indicated antibodies. The cell lines in blue represent B-ALL (GR-ST, LC4–1, P30-OHK), CML (JURL-MK1, KU-812) and CLL (JVM-2, EHEB). Independent experiments were performed at least three times and a representative result is shown. (B) Scatter plots representing quantitated amounts of MCL-1/BCL2/BCL-xL/BIM protein normalized to β-Actin, for the 18 cell lines in (A). The proteins were quantitated using GeneTools from SynGene. An unpaired t-test was used to assess the significance of differences in mean between the two groups (C) T-ALL cell lines were treated for 72h with 3μM of the MCL-1 inhibitor A-1210477 (black), 30nM ABT-263 (red) or a combination of 3μM of A-1210477 and 30nM ABT-263 (grey). Viability was measured using CellTiter-Glo and normalized to DMSO-treated samples. (D) Two human T-ALL cell lines, MOLT-4 and RPMI-8402, were infected with lentiviral particles expressing GFP alone (GFP) or GFP-IRES-MCL-1 (MCL-1). GFP expressing cells were sorted and tested for sensitivity to ABT-263 alone or in combination with A-1210477 (the MCL-1 inhibitor). Dose response curves of the MCL-1 overexpressing lines treated alone (green) or in combination (grey) and the controls (orange) are shown. The experiments were done two times and the values shown are mean ± SD. Equal amounts of lysates from these lines were separated by SDS-PAGE and probed with MCL-1 and α-tubulin antibodies.
Figure 3.
Figure 3.. NOTCH inhibition desensitizes human T-ALL cell lines to ABT-263.
GSI-resistant (A) and GSI-sensitive (B) human T-ALL cell lines were pre-treated with DMSO or 1 μM CompE for 72h, followed by treatment with varying concentrations of ABT-263, in the continued presence of DMSO or 1 μM CompE for another 72h. At the end of the six-day period, cell viability was measured with CellTiter-Glo and expressed as a percentage of drug-treated cells to DMSO-treated cells. The experiments were done twice, in triplicate each and the values shown are mean ± SD. (C) Bar graph shows the shift in the potency of ABT-263 upon GSI treatment. Values are calculated using 50% viability loss over DMSO and GSI alone, for single agent and GSI combination (GSI alone = 100%) respectively. (D) GSI-resistant T-ALL lines were treated with DMSO or 1 μM CompE for 5 days, harvested, lysed and subjected to western blot analysis using the indicated antibodies. Independent experiments were done three times and a representative result is shown. MCL-1 levels, quantitated using GeneTools from SynGene, normalized to α-tubulin, are shown under MCL-1 blot.
Figure 4.
Figure 4.. NOTCH1 represses mTORC1 activity and MCL-1 levels in GSI-resistant cell lines.
(A) GSI-resistant lines were treated with DMSO or 1 μM CompE for 5 days, harvested, lysed and subjected to western blot analysis using the indicated antibodies. Independent experiments were done three times and a representative result is shown. (B) Changes in levels of MCL-1 and p4EBP1 upon GSI treatment, normalized to GAPDH, were quantitated using GeneTools from SynGene, and presented on a graph. The experiments were done at least 3 times and values shown are mean ± SD (C) GSI-sensitive cell lines were mock-treated or treated with 1 μM CompE for 5 days, harvested, lysed and subjected to Western blot analysis using the indicated antibodies. (D) GSI-resistant lines were transfected with Scramble siRNAs or siRNAs against REDD1 (DDIT4). After 72 hrs cells were harvested, lysed and subjected to western blot analysis using the indicated antibodies.
Fig 5.
Fig 5.. Combination of AZD8055 and ABT-263 triggers high apoptosis in T-ALL cell lines and primary T-ALL models in vitro.
(A) Human T-ALL cell lines were treated with DMSO, 300 nM ABT-263, 500 nM AZD8055 or a combination of 300 nM ABT-263 and 500 nM AZD8055 for 48h, after which cells were stained with propidium iodide and Annexin-V. Apoptosis was measured by FACS analysis as percentage of cells that are Annexin-V positive. The experiment was done in triplicate and the percentage apoptosis values are shown for each treatment with mean ± SD. (B) Primary T-ALL cells from six patients were treated with DMSO, 1 μM ABT-263, 500 nM AZD8055 or a combination of 1 μM ABT-263 and 500 nM AZD8055 for 3days, after which cells were stained with propidium iodide and Annexin-V. Apoptosis was measured by FACS analysis as percentage of Annexin-V positive cells. The experiment was done in triplicate and the percentage apoptosis values are shown for each treatment with mean ± SD.
Fig 6.
Fig 6.. The combination of AZD8055 and ABT-263 causes tumor regression in vivo:
(A) GSI-resistant MOLT-4 cells were grown as xenograft tumors in Nu/Nu mice. Mice were randomized into 4 treatment cohorts: control (no drug), 16 mg/kg AZD8055, 80 mg/kg ABT-263, or their combination. Waterfall plot showing percentage change in tumor volume (relative to initial volume) for individual tumors in tumor-bearing mice, treated for 21 days. (B) For pharmaco-dynamic studies, tumor-bearing mice were treated as in (A), for 3 days. On the third day, tumors were harvested 2h after drug treatment and snap frozen. Proteins were extracted, 15 μg protein from each sample was run on an SDS-PAGE and subjected to western blotting with the indicated antibodies. (C) Schematic of the in vivo experiment with primary T-ALL cells. Briefly, NOD-scid IL2rg−/− (NSG) mice were intravenously injected with primary human T-ALL blasts. When human leukemic blasts reached 55–65% mouse peripheral blood, mice were randomized to one of four treatment groups indicated. 2–6 mice from each group were sacrificed after 2 weeks of treatment to assess leukemic burden (data shown in Fig S10, S11). The remaining mice were treated for a total of 3 weeks, after which survival was monitored. (D, E) Kaplan-Meier survival curves are shown for mice engrafted with TALL-X-2 (D) or TALL-X-7 (E) patient samples. The difference in overall survival between the treatment groups was assessed by log-rank test (*p<0.05, ***p<0.001, ****p<0.0001).

References

    1. Ferrando AA, Neuberg DS, Staunton J, et al. Gene expression signatures define novel oncogenic pathways in T cell acute lymphoblastic leukemia. Cancer Cell. 2002;1(1):75–87. - PubMed
    1. Pui CH, Robison LL, Look AT. Acute lymphoblastic leukaemia. Lancet. 2008;371(9617):1030–1043. - PubMed
    1. Weng AP, Ferrando AA, Lee W, et al. Activating mutations of NOTCH1 in human T cell acute lymphoblastic leukemia. Science. 2004;306(5694):269–271. - PubMed
    1. Grabher C, von Boehmer H, Look AT. Notch 1 activation in the molecular pathogenesis of T-cell acute lymphoblastic leukaemia. Nat Rev Cancer. 2006;6(5):347–359. - PubMed
    1. Bernasconi-Elias P, Hu T, Jenkins D, et al. Characterization of activating mutations of NOTCH3 in T-cell acute lymphoblastic leukemia and anti-leukemic activity of NOTCH3 inhibitory antibodies. Oncogene. 2016;35(47):6077–6086. - PMC - PubMed

Publication types

MeSH terms