

In vivo generation of human CD19-CAR T cells results in B-cell depletion and signs of cytokine release syndrome
- PMID: 30224381
- PMCID: PMC6220327
- DOI: 10.15252/emmm.201809158
In vivo generation of human CD19-CAR T cells results in B-cell depletion and signs of cytokine release syndrome
Abstract
Chimeric antigen receptor (CAR) T cells brought substantial benefit to patients with B-cell malignancies. Notwithstanding, CAR T-cell manufacturing requires complex procedures impeding the broad supply chain. Here, we provide evidence that human CD19-CAR T cells can be generated directly in vivo using the lentiviral vector CD8-LV specifically targeting human CD8+ cells. Administration into mice xenografted with Raji lymphoma cells and human peripheral blood mononuclear cells led to CAR expression solely in CD8+ T cells and efficacious elimination of CD19+ B cells. Further, upon injection of CD8-LV into mice transplanted with human CD34+ cells, induction of CAR T cells and CD19+ B-cell depletion was observed in 7 out of 10 treated animals. Notably, three mice showed elevated levels of human cytokines in plasma. Tissue-invading CAR T cells and complete elimination of the B-lymphocyte-rich zones in spleen were indicative of a cytokine release syndrome. Our data demonstrate the feasibility of in vivo reprogramming of human CD8+ CAR T cells active against CD19+ cells, yet with similar adverse effects currently notorious in the clinical practice.
Keywords: T‐cell targeting; cytokine release syndrome; gene delivery; humanized mouse.
© 2018 The Authors. Published under the terms of the CC BY 4.0 license.
Figures
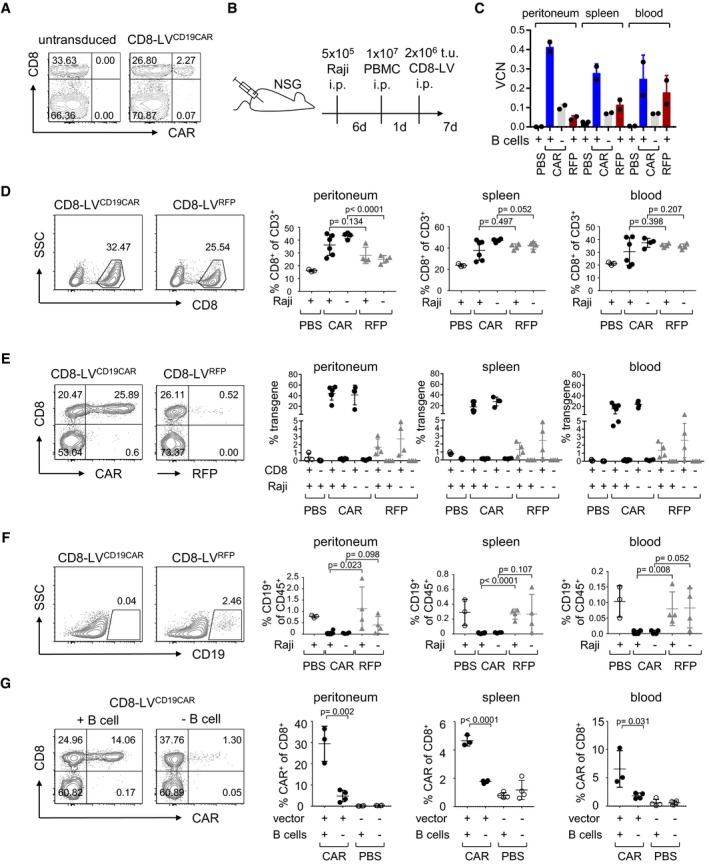
- A
Ex vivo generation of CAR T cells. Activated human PBMC were left untransduced or incubated with CD8‐LVCD19CAR at an MOI of 2. Five days later, expression of CD19‐CAR and CD8 was determined on CD3+ cells. Numbers indicate the percentage of cells in the respective gate.
- B
Experimental outline for in vivo CAR generation. 1 × 10⁷ human PBMC were engrafted into naïve NSG mice or NSG mice that had been intraperitoneally (i.p.) injected with 5 × 10⁵ Raji cells (Raji+) 6 days before. One day later, 2 × 10⁶ t.u. of CD8‐LVCD19CAR (filled circles) or CD8‐LVRFP (gray triangles) were i.p. injected, respectively. As further control, another group of mice received PBS (open circles). Seven days later, mice were sacrificed and organs and cells were removed for further analysis.
- C
Detection of CAR T cells by vector copy numbers (VCN). Genomic DNA was isolated from peritoneal cavity, spleen, and blood cells. VCN were determined in technical duplicates by qPCR for two individual mice of each group. The presence of B cells in the transplanted PBMC is indicated below.
- D–F
Cells isolated from the peritoneal cavity (peritoneum), spleen, or blood were evaluated by flow cytometry for the percentages of human CD8+ in CD3+ cells (D), of CAR+ or RFP+ cells in the CD8+ and CD8− fractions, respectively (E), and of human CD19+ cells (F) within the fraction of human CD45+ cells. Representative density plots are shown for the peritoneal cells. The gating strategy is represented in Appendix Fig S1A.
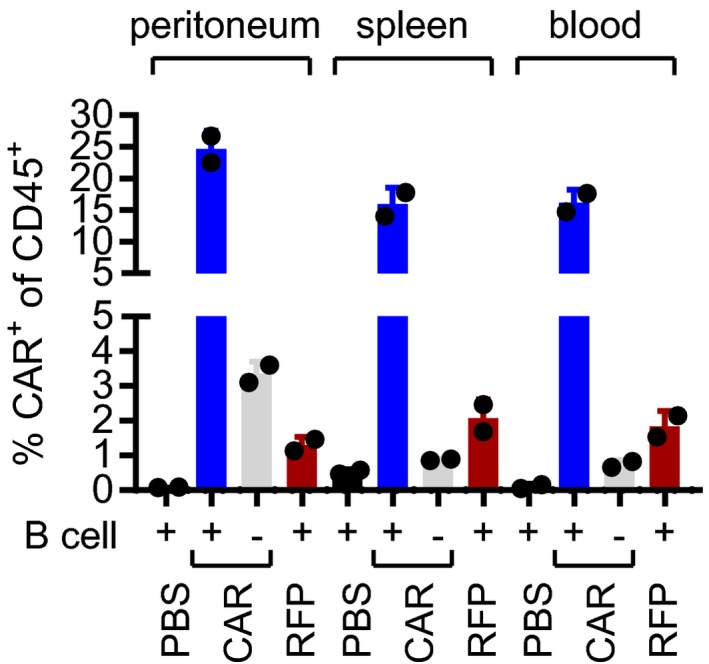
- G
Mice were transplanted with B‐cell‐depleted human PBMC and then received CD8‐LVCD19CAR (filled circle) or PBS (open circle). As control, CD8‐LVCD19CAR or PBS was injected into mice transplanted with non‐depleted PBMC.
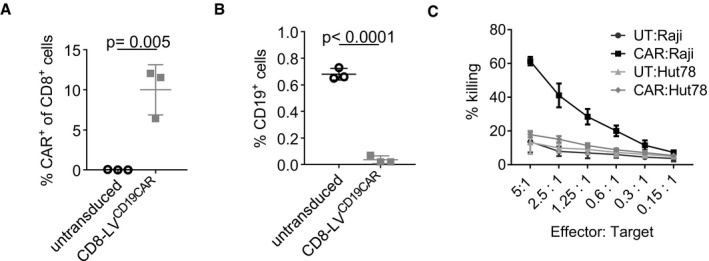
- A
Quantitative data of Fig 1A showing the percentages of CAR+ cells of three different donors. Mean values ± SD are shown with n = 3. Statistical evaluation of the data was performed using two‐tailed unpaired t‐test.
- B
CAR T cells eliminate CD19+ B cells. PBMC were activated for 3 days and incubated with CD8‐LVCD19CAR. Expression of CD3 and CD19 was then analyzed by flow cytometry. The percentage of CD19+ B cells for n = 3 with mean ± SD is shown. Statistical significance was determined by two‐tailed unpaired t‐test.
- C
Selective killing of CD19+ Raji tumor cells by ex vivo‐generated CAR T cells (CAR) or untransduced T cells (UT) with CD19+ Raji cells, or as control CD19− Hut78 cells. Mean values ± SD are shown with n = 3.
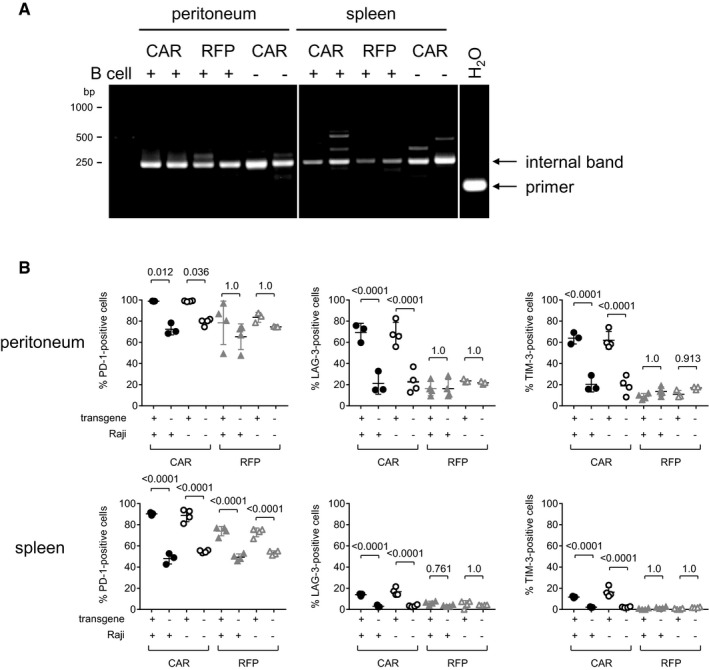
- A
Clonality analysis by amplifying vector sequences integrated in genomic DNA. LM‐PCR detecting the integrated vector in genomic DNA purified from peritoneal and spleen cells harvested from PBMC‐transplanted mice injected with CD8‐LVCD19CAR (CAR) in the presence or absence of B cells or CD8‐LVRFP (RFP). Two mice of each group were analyzed. The internal control band is indicated as well as primer dimers in the water control (H2O).
- B
Cells isolated from peritoneal cavity or spleen of human PBMC‐transplanted NSG mice (± i.p. transplanted Raji cells) treated with CD8‐LVCD19CAR (CAR) or CD8‐LVRFP (RFP) were analyzed for expression of exhaustion markers by flow cytometry. CD8+ cells from viable human CD3+ cells were gated for transgene‐positive (CAR+ or RFP+) and transgene‐negative (CAR− or RFP−) cells. These two cell populations were then separately gated for expression of PD‐1, LAG‐3, and TIM‐3. For the four experimental groups, percentages of positive cells for each exhaustion marker are shown for transgene‐positive and transgene‐negative CD8+ cells. Mean values ± SD are shown. N = 3 in samples with closed circles, n = 4 in samples with open circles or closed triangles, while for samples with open triangles, n = 3 for peritoneum and n = 4 for spleen. Statistical evaluation of the data was performed using one‐way ANOVA test with Bonferroni correction.
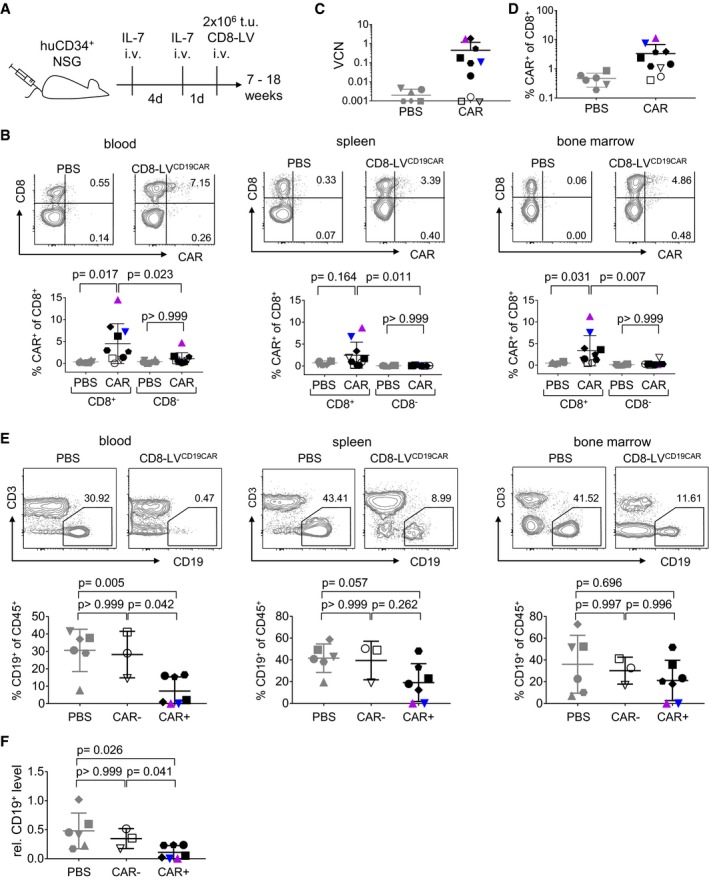
- A
Experimental outline. IL‐7 was injected intravenously into HSC‐humanized NSG mice before 2 × 10⁶ t.u. of CD8‐LVCD19CAR (CAR), or PBS as control (PBS), were administered.
- B
CAR T‐cell levels in the CD8+ and CD8− T cells harvested from blood, spleen, and bone marrow of PBS (PBS) or vector‐injected (CAR) mice determined by flow cytometry.
- C
Detection of CAR T cells by determining vector copy numbers (VCN) in genomic DNA isolated from CD8+‐enriched cells harvested from bone marrow.
- D
Detection of CAR T cells in bone marrow quantified by flow cytometry.
- E
CD19+ B‐cell levels in blood, spleen, and bone marrow determined by flow cytometry.
- F
Relative human CD19+ B‐cell level in blood calculated by normalizing the levels at the day the animals were sacrificed to those before vector administration.
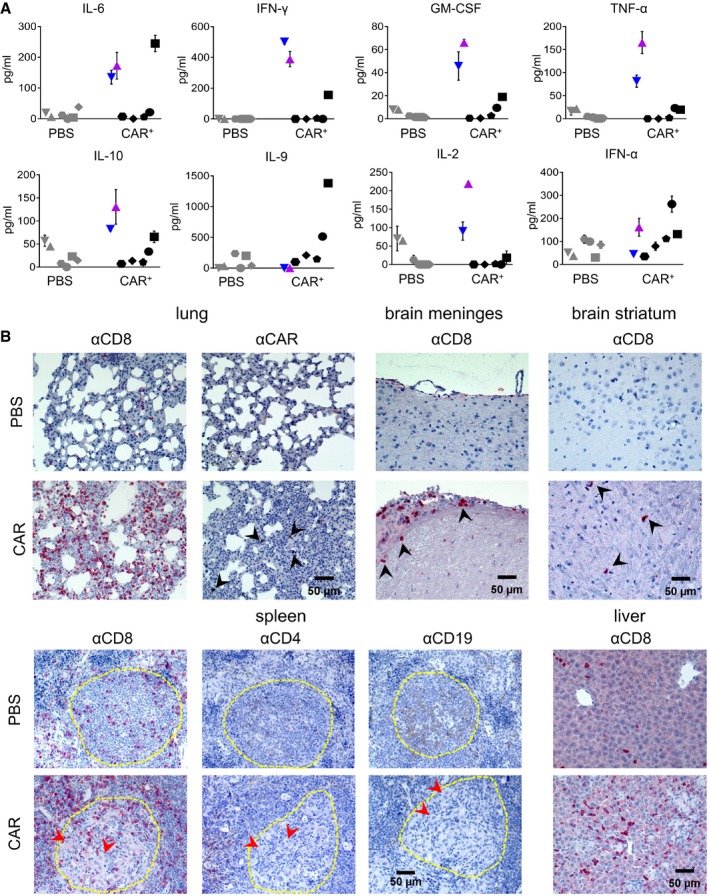
- A
Cytokine levels in plasma of individual mice obtained from blood at 7 weeks after vector injection. The distinct symbols used for each individual mouse are identical to the ones used in Fig 2. Mean values ± SD of n = 2 technical replicates.
- B
Immunohistochemistry of paraffin‐embedded sections from the lungs, brain meninges, brain striatum, spleen, and liver of the vector‐injected mouse M16 (CAR) and a control mouse injected with PBS (PBS) stained against CD8 (αCD8), the CAR (αCAR), CD4 (αCD4), or CD19 (αCD19). Black arrowheads point at infiltrated lymphocytes, red arrowheads point at histiocytes, and the yellow line indicates B‐lymphocyte‐rich zones.
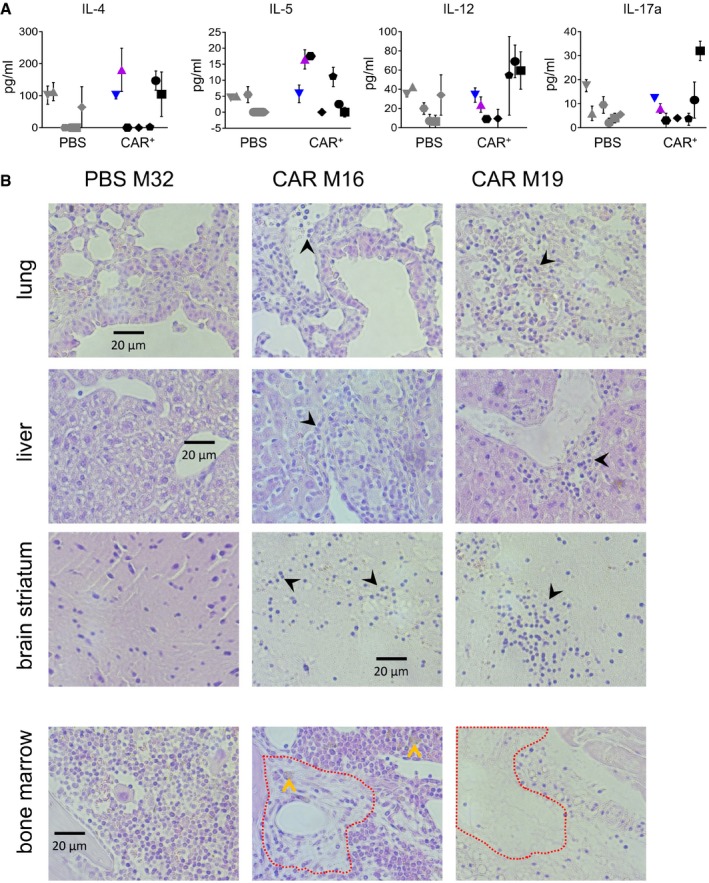
- A
Levels of further cytokines in plasma of individual mice obtained 7 weeks after vector injection. The distinct symbols used for each individual mouse are identical to the ones used in Fig 2. Mean values of n = 2 technical replicas.
- B
Hematoxylin/eosin staining of paraffin‐embedded sections from lung, liver, brain striatum, and bone marrow, of the PBS‐injected control mouse M32 or the CD8‐LVCD19‐CAR‐injected M16 and M19 animals. Areas of hematopoietic cell depletion in bone marrow are indicated by the red‐dashed line and acellular debris by the yellow arrows. Infiltrating lymphocytes in the other tissues are labeled by black arrows.
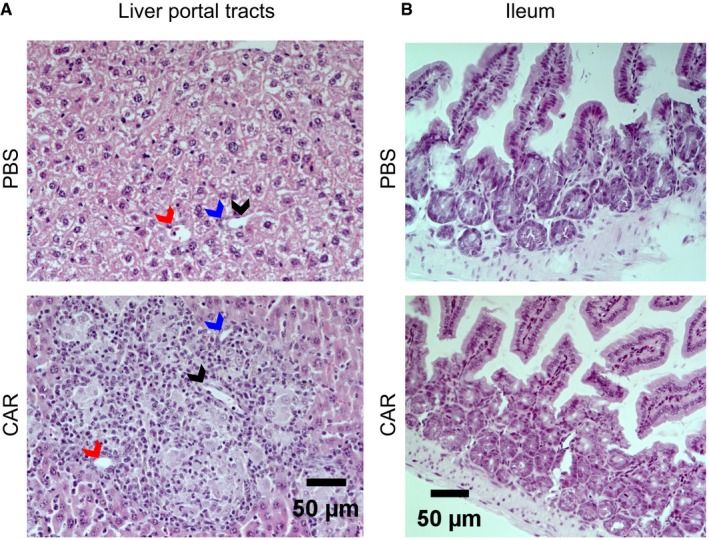
- A, B
Hematoxylin/eosin staining of paraffin‐embedded sections from liver portal tracts (A) and ileum (B) of the PBS control mouse M32 and the CAR+ mouse M16. Arrows point to bile ducts (blue), arterial sinus (red), and portal vein (black).
Comment in
-
Cancer immunotherapy in routine cost-effective cancer care?EMBO Mol Med. 2018 Nov;10(11):e9660. doi: 10.15252/emmm.201809660. EMBO Mol Med. 2018. PMID: 30322840 Free PMC article.
References
-
- Abel T, El Filali E, Waern J, Schneider IC, Yuan Q, Münch RC, Hick M, Warnecke G, Madrahimov N, Kontermann RE et al (2013) Specific gene delivery to liver sinusoidal and artery endothelial cells. Blood 122: 2030–2038 - PubMed
-
- Amirache F, Levy C, Costa C, Mangeot P‐E, Torbett BE, Wang CX, Negre D, Cosset F‐L, Verhoeyen E (2014) Mystery solved: VSV‐G‐LVs do not allow efficient gene transfer into unstimulated T cells, B cells, and HSCs because they lack the LDL receptor. Blood 123: 1422–1424 - PubMed
-
- Anliker B, Abel T, Kneissl S, Hlavaty J, Caputi A, Brynza J, Schneider IC, Münch RC, Petznek H, Kontermann RE et al (2010) Specific gene transfer to neurons, endothelial cells and hematopoietic progenitors with lentiviral vectors. Nat Methods 7: 929–935 - PubMed
-
- Buchholz CJ, Friedel T, Büning H (2015) Surface‐engineered viral vectors for selective and cell type‐specific gene delivery. Trends Biotechnol 33: 777–790 - PubMed
Publication types
MeSH terms
Substances
LinkOut - more resources
Full Text Sources
Other Literature Sources
Research Materials
