. 2018 Dec;17(12):2610-2621.
doi: 10.1158/1535-7163.MCT-17-0541. Epub 2018 Sep 17.

Sorafenib and Carfilzomib Synergistically Inhibit the Proliferation, Survival, and Metastasis of Hepatocellular Carcinoma

Affiliations

Sorafenib and Carfilzomib Synergistically Inhibit the Proliferation, Survival, and Metastasis of Hepatocellular Carcinoma

Chao Jiang et al. Mol Cancer Ther. 2018 Dec.

Abstract

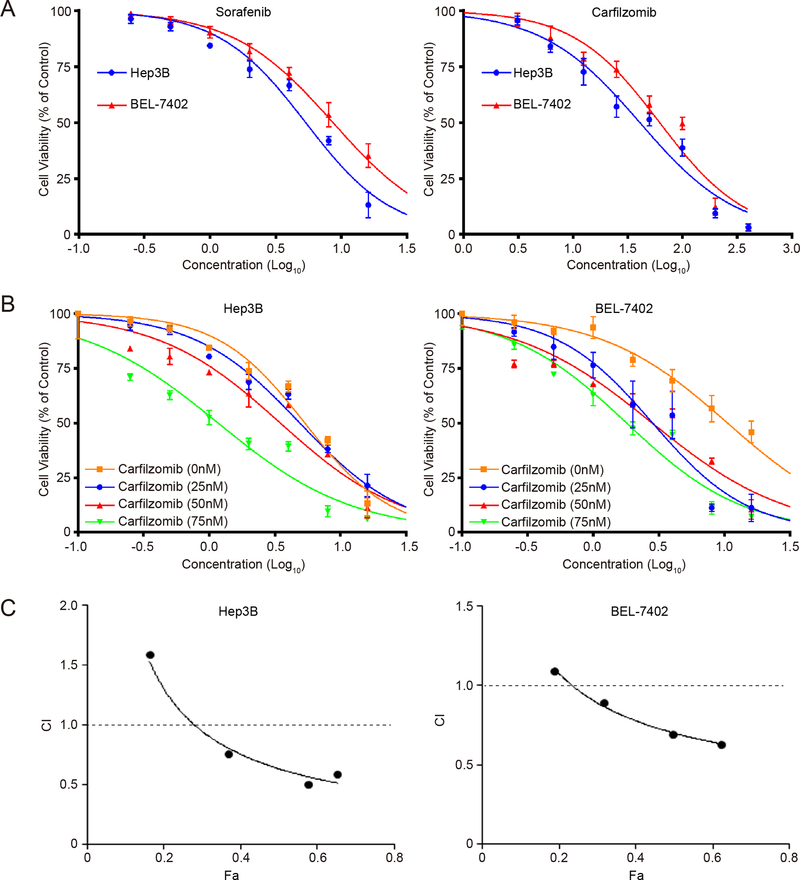
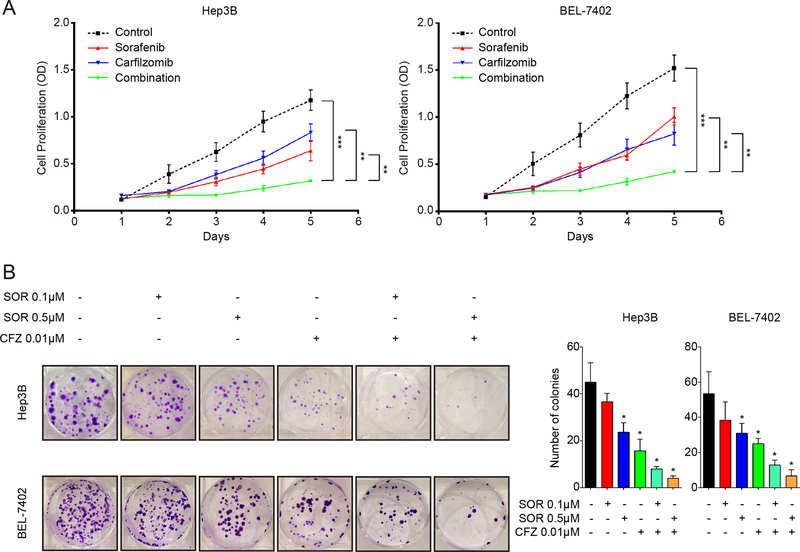
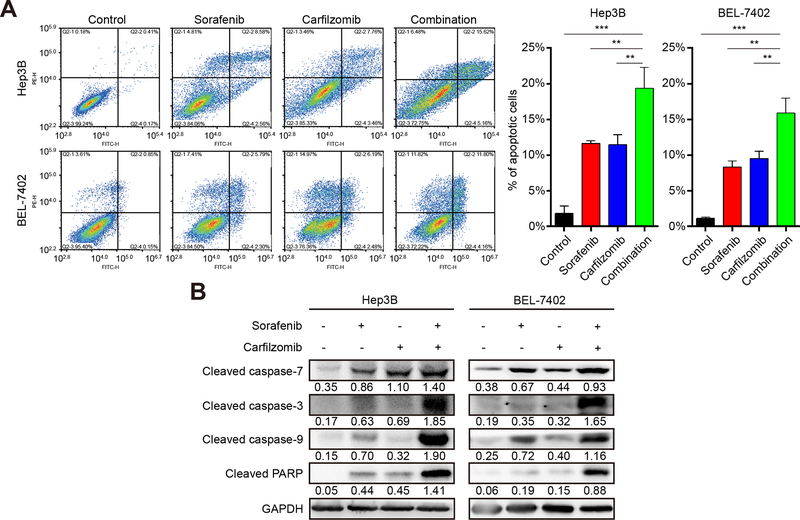
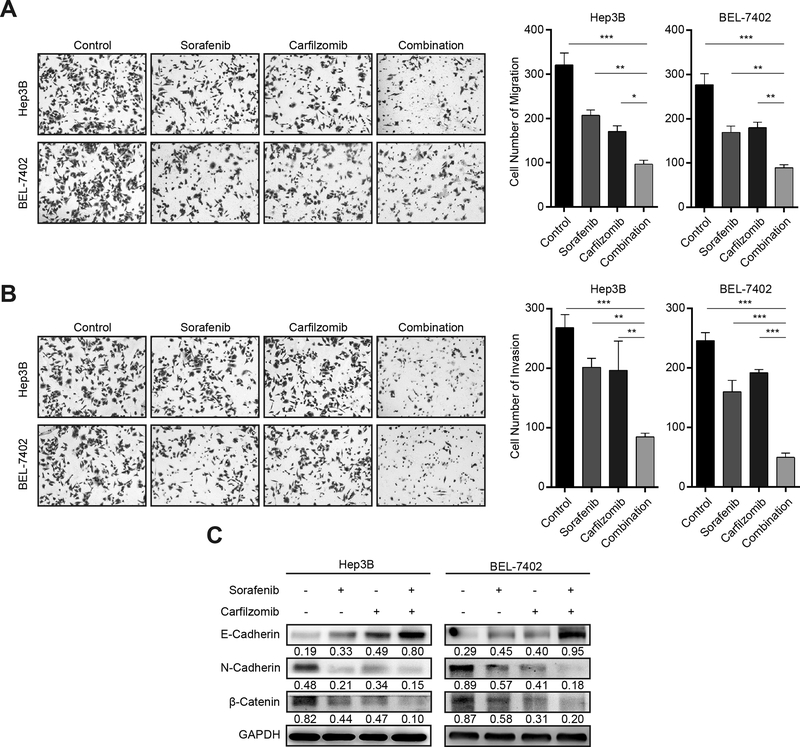
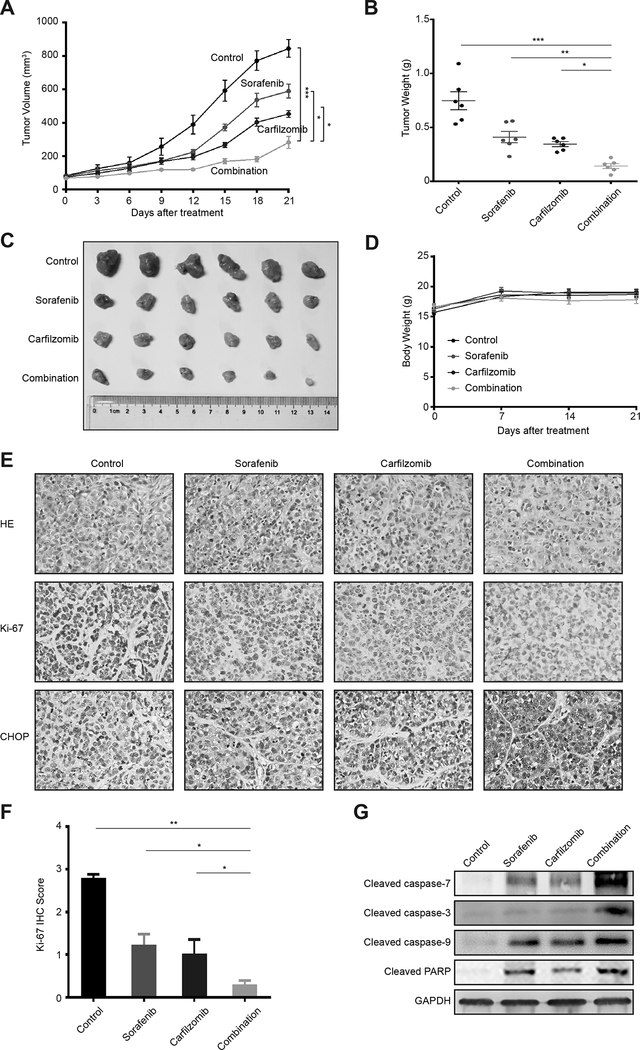
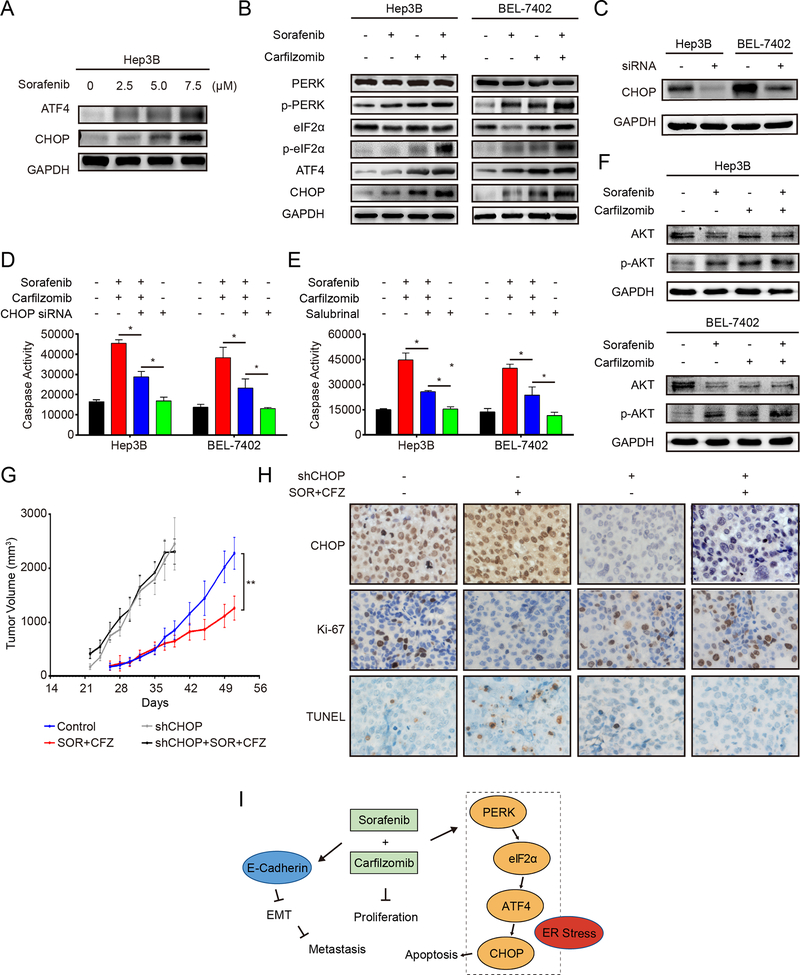
Hepatocellular carcinoma (HCC) is one of the most common and deadly human cancers. The 5-year survival rate is very low. Unfortunately, there are few efficacious therapeutic options. Until recently, Sorafenib has been the only available systemic drug for advanced HCC. However, it has very limited survival benefits, and new therapies are urgently needed. In this study, we investigated the anti-HCC activity of carfilzomib, a second-generation, irreversible proteasome inhibitor, as a single agent and in combination with sorafenib. In vitro, we found that carfilzomib has moderate anticancer activity toward liver cancer cells, but strongly enhances the ability of sorafenib to suppress HCC cell growth, proliferation, migration, invasion, and survival. Remarkably, the drug combination exhibits even more potent antitumor activity when tested in animal tumor models. Mechanistically, the combined treatment activates caspase-dependent and endoplasmic reticulum stress/CHOP-mediated apoptotic pathways, and suppresses epithelial-mesenchymal transition. In conclusion, our results demonstrate that the combination of carfilzomib and sorafenib has synergistic antitumor activities against HCC, providing a potential therapeutic strategy to improve the mortality and morbidity of HCC patients.


Conflict of interest statement

Conflicts of Interest

The authors declare no known conflicts of interest.

Figures

Figure 1.
Figure 1.. Sorafenib and carfilzomib synergistically inhibit the proliferation of HCC cells.
(A) Hep3B and Bel-7402 cells were treated with various concentrations of sorafenib or carfilzomib for 48h. Cell proliferation was determined by the MTS assay in triplicate. Data represent mean ± SD. IC50 value of sorafenib and carfilzomib in HCC cell lines was then determined. (B) Sorafenib inhibition of HCC cell proliferation is enhanced by carfilzomib. Hep3B and Bel-7402 cells were treated with sorafenib and various concentrations of carfilzomib for 48h. Cell proliferation was determined by the MTS assay. The assays were performed in triplicate. Data represent mean ± SD. (C) CalcuSyn software was used to determine whether there was synergism between sorafenib and carfilzomib. Combination index (CI) of the combination of sorafenib and carfilzomib is shown. The assays were repeated in triplicate.
Figure 2.
Figure 2.. Sorafenib and carfilzomib synergistically inhibit oncogenic growth of HCC cells.
(A) Hep3B and Bel-7402 cells were treated with sorafenib (2.5 μM) and carfilzomib (0.025 μM) individually or in combination for various times. HCC cell proliferation was determined by the MTS assay. (B) Carfilzomib enhances the ability of sorafenib to inhibit colony formation of HCC cells. Hep3B and Bel-7402 cells were treated with sorafenib (0.1 μM or 0.5 μM) and carfilzomib (0.01 μM) individually or in combination for about two weeks. The inhibition effects were observed based on the number of colonies formed. The results shown are representative of three independent experiments. All Data were shown as mean ± SD. * p < 0.05, ** p < 0.01, *** p < 0.001.
Figure 3.
Figure 3.. Carfilzomib and sorafenib induce apoptosis of HCC cells in a caspase-dependent manner.
(A) Hep3B and Bel-7402 cells were treated with carfilzomib (0.1 μM) and sorafenib (7.5 μM) individually or in combination for 24 h and analyzed for cell death by flow cytometry. The experiments were performed in triplicate and data represent mean ± SD. *p < 0.05, ** p < 0.01, ***p < 0.001. (B) Cleaved caspase-3, cleaved caspase-7, cleaved caspase-9 and cleaved PARP were used to analyze apoptotic cell death as detected by immunoblot. GAPDH was used as a loading control. Number indicates relative abundance (arbitrary unit).
Figure 4.
Figure 4.. Carfilzomib and sorafenib inhibit HCC cell migration, invasion and EMT.
(A) Hep3B and Bel-7402 cells were treated with carfilzomib (0.05 μM) and sorafenib (7.5 μM) individually or in combination for 24 h. Transwell migration assays were performed to determine the migratory ability of Hep3B and Bel-7402 cells. The experiments were performed in triplicate and data represent mean ± SD. *p < 0.05, ** p < 0.01, ***p < 0.001. (B) Hep3B and Bel-7402 cells were treated with carfilzomib (0.05 μM) and sorafenib (7.5 μM) individually or in combination for 24 h. Transwell invasion assays were performed in metrigel to determine the invasion ability of Hep3B and Bel-7402 cells. The experiments were performed in triplicate and data represent mean ± SD. *p < 0.05, ** p < 0.01, ***p < 0.001 (C) Hep3B and Bel-7402 cells were treated with carfilzomib (0.05 μM) and sorafenib (7.5 μM) individually or in combination for 24 h. The expression of the epithelial marker E-cadherin, and the mesenchymal markers N-Cadherin and β-Catenin was analyzed by immunoblot. GAPDH was used as a loading control. Number indicates relative abundance (arbitrary unit).
Figure 5.
Figure 5.. Carfilzomib and sorafenib strongly attenuate HCC tumor growth in vivo.
(A) Xenograft tumors generated from Hep3B cells were treated with carfilzomib and sorafenib individually or in combination, or with a drug vehicle control. Growth of xenograft tumors was measured by tumor volume. Data represent mean ± SD (n = 6). Statistical analyses were performed by two-way ANOVA and sample-paired t-test. *p < 0.05, ** p < 0.01, ***p < 0.001. (B, C) Shown are the weights and images of xenograt tumors at the end of the experiment. Data represent mean ± SD (n = 6). Statistical analyses were performed by one-way ANOVA and sample-paired t-test. *p < 0.05, ** p < 0.01, ***p < 0.001. (D) The body weight +/− SD of mice in different treatment groups. (E) Upper panel: Representative images of HE staining of HCC xenografted tumor sections in different treatment groups (200 × magnification); Lower panel: Representative images of Ki67 staining of HCC xenografted tumor sections in different treatment groups (200 × magnification). (F) Quantification of IHC scores for Ki-67 staining in Hep3B xenograft tumors. Data represent mean ± SD (n = 6). Statistical analysis was performed by sample-paired t-test. *p < 0.05, ** p < 0.01, ***p < 0.001. (G) Xenograft tumor tissues from different drug treatment groups were analyzed for cleaved caspase-3, cleaved caspase-7, cleaved caspase-9 and cleaved PARP by immunoblot. GAPDH was used as a loading control.
Figure 6.
Figure 6.. Carfilzomib and sorafenib treatments trigger ER stress-mediated apoptosis through the PERK/eIF2α/ATF4/CHOP pathway.
(A) Hep3B cells were treated with different concentrations of sorafenib (2.5, 5.0, 7.5 μM) for 24 h. The expression of ATF4 and CHOP was analyzed by immunoblot. GAPDH was used as a loading control. (B) Hep3B and Bel-7402 cells were treated with carfilzomib (0.1 μM) and sorafenib (7.5 μM) individually or in combination for 24 h. Activation of the PERK/eIF2α/ATF4/CHOP pathway was analyzed by the expression of various marker proteins of the pathway by immunoblot. (C) Shown is the knockdown efficiency of CHOP by siRNA as determined by immunoblot in Hep3B and Bel-7402 cells. (D) Knockdown of CHOP decreases the activity of caspase-3/7 induced by carfilzomib and sorafenib. Hep3B and Bel-7402 cells were transfected with CHOP siRNA for 48 h before treated with carfilzomib (0.1 μM) and sorafenib (7.5 μM) individually or in combination for another 24 h. The activity of caspase-3/7 was determined by the Caspase-Glo assay. The experiments were performed in triplicate and data represent mean ± SD. *p < 0.05. (E) Salubrinal suppressed caspase-3/7 activities induced by carfilzomib and sorafenib. Hep3B and Bel-7402 cells were pretreated with salubrinal (20 μM) for 12 h before treated with carfilzomib (0.1 μM) and sorafenib (7.5 μM) individually or in combination for another 24 h. The activity of caspase-3/7 was determined by the Caspase-Glo assay. The experiments were performed in triplicate and data represent mean ± SD. * p < 0.05. (F) Hep3B and Bel-7402 cells were treated with carfilzomib (0.1 μM) and sorafenib (7.5 μM) individually or in combination for 24 h. Protein levels of p-AKT and AKT were analyzed by immunoblot. (G) Xenograft tumors generated from Hep3B cells expressing shCHOP or control shRNA were treated with combined carfilzomib/ sorafenib or a drug vehicle. Growth of xenograft tumors was measured by tumor volume. Data represent mean ± SD (n = 8). Statistical analyses were performed by two-way ANOVA and sample-paired t-test. ** p < 0.01. (H) Representative images of IHC staining for CHOP (upper panels), Ki67 (middle panels) and TUNEL (lower panels) in HCC xenograft tumor sections in different treatment groups (400 × magnification). (I) A working model illustrating the inhibitory mechanism of carfilzomib and sorafenib against HCC.

References

    1. Torre LA, Bray F, Siegel RL, Ferlay J, Lortet-Tieulent J, Jemal A. Global cancer statistics, 2012. CA: A Cancer Journal for Clinicians 2015;65(2):87–108 doi 10.3322/caac.21262. - DOI - PubMed
    1. Chen W, Zheng R, Baade PD, Zhang S, Zeng H, Bray F, et al. Cancer statistics in China, 2015. CA: a cancer journal for clinicians 2016;66(2):115–32 doi 10.3322/caac.21338. - DOI - PubMed
    1. El-Serag HB. Hepatocellular Carcinoma. New England Journal of Medicine 2011;365(12):1118–27 doi 10.1056/NEJMra1001683. - DOI - PubMed
    1. Kudo M Immune Checkpoint Blockade in Hepatocellular Carcinoma: 2017 Update. Liver Cancer 2016;6(1):1–12 doi 10.1159/000449342. - PMC - PubMed
    1. Wilhelm SM, Carter C, Tang L, Wilkie D, McNabola A, Rong H, et al. BAY 43–9006 exhibits broad spectrum oral antitumor activity and targets the RAF/MEK/ERK pathway and receptor tyrosine kinases involved in tumor progression and angiogenesis. Cancer research 2004;64(19):7099–109 doi 10.1158/0008-5472.CAN-04-1443. - DOI - PubMed

Publication types

MeSH terms