

Converging evidence for functional and structural segregation within the left ventral occipitotemporal cortex in reading
- PMID: 30224475
- PMCID: PMC6196482
- DOI: 10.1073/pnas.1803003115
Converging evidence for functional and structural segregation within the left ventral occipitotemporal cortex in reading
Abstract
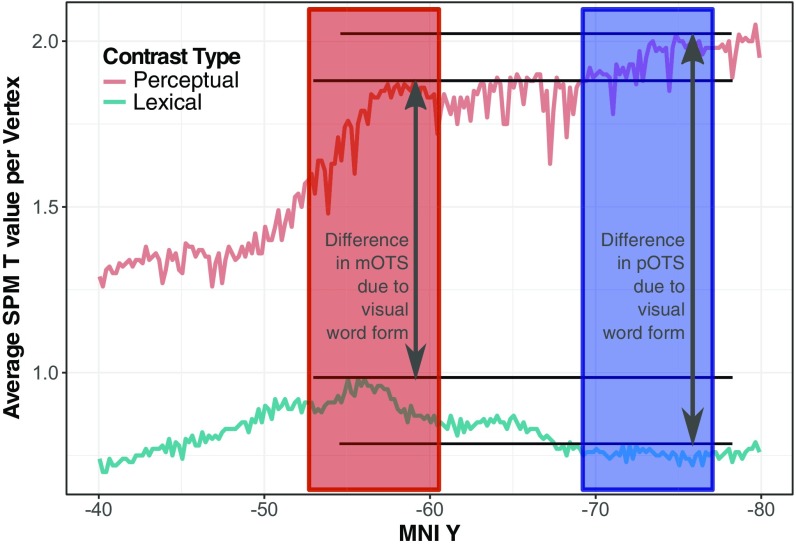
The ventral occipitotemporal cortex (vOTC) is crucial for recognizing visual patterns, and previous evidence suggests that there may be different subregions within the vOTC involved in the rapid identification of word forms. Here, we characterize vOTC reading circuitry using a multimodal approach combining functional, structural, and quantitative MRI and behavioral data. Two main word-responsive vOTC areas emerged: a posterior area involved in visual feature extraction, structurally connected to the intraparietal sulcus via the vertical occipital fasciculus; and an anterior area involved in integrating information with other regions of the language network, structurally connected to the angular gyrus via the posterior arcuate fasciculus. Furthermore, functional activation in these vOTC regions predicted reading behavior outside of the scanner. Differences in the microarchitectonic properties of gray-matter cells in these segregated areas were also observed, in line with earlier cytoarchitectonic evidence. These findings advance our understanding of the vOTC circuitry by linking functional responses to anatomical structure, revealing the pathways of distinct reading-related processes.
Keywords: functional and structural MRI; quantitative MRI; reading; visual word form area; visual word recognition.
Conflict of interest statement
The authors declare no conflict of interest.
Figures


Comment in
-
Parcellating the structure and function of the reading circuit.Proc Natl Acad Sci U S A. 2018 Oct 16;115(42):10542-10544. doi: 10.1073/pnas.1814648115. Epub 2018 Oct 1. Proc Natl Acad Sci U S A. 2018. PMID: 30275333 Free PMC article. No abstract available.
Similar articles
-
Anatomy and physiology of word-selective visual cortex: from visual features to lexical processing.Brain Struct Funct. 2021 Dec;226(9):3051-3065. doi: 10.1007/s00429-021-02384-8. Epub 2021 Oct 12. Brain Struct Funct. 2021. PMID: 34636985 Free PMC article. Review.
-
The left occipitotemporal system in reading: disruption of focal fMRI connectivity to left inferior frontal and inferior parietal language areas in children with dyslexia.Neuroimage. 2011 Feb 1;54(3):2426-36. doi: 10.1016/j.neuroimage.2010.10.002. Epub 2010 Oct 8. Neuroimage. 2011. PMID: 20934519
-
Neural Responses of the Anterior Ventral Occipitotemporal Cortex in Developmental Dyslexia: Beyond the Visual Word Form Area.Invest Ophthalmol Vis Sci. 2019 Mar 1;60(4):1063-1068. doi: 10.1167/iovs.18-26325. Invest Ophthalmol Vis Sci. 2019. PMID: 30897621
-
Connectivity between the visual word form area and the parietal lobe improves after the first year of reading instruction: a longitudinal MRI study in children.Brain Struct Funct. 2019 May;224(4):1519-1536. doi: 10.1007/s00429-019-01855-3. Epub 2019 Mar 6. Brain Struct Funct. 2019. PMID: 30840149
-
Beyond the Visual Word Form Area - a cognitive characterization of the left ventral occipitotemporal cortex.Front Hum Neurosci. 2023 Jul 28;17:1199366. doi: 10.3389/fnhum.2023.1199366. eCollection 2023. Front Hum Neurosci. 2023. PMID: 37576470 Free PMC article. Review.
Cited by
-
Lexical and sublexical cortical tuning for print revealed by Steady-State Visual Evoked Potentials (SSVEPs) in early readers.Dev Sci. 2023 Jul;26(4):e13352. doi: 10.1111/desc.13352. Epub 2022 Dec 8. Dev Sci. 2023. PMID: 36413170 Free PMC article.
-
Innate connectivity patterns drive the development of the visual word form area.Sci Rep. 2020 Oct 22;10(1):18039. doi: 10.1038/s41598-020-75015-7. Sci Rep. 2020. PMID: 33093478 Free PMC article.
-
Separate lanes for adding and reading in the white matter highways of the human brain.Nat Commun. 2019 Aug 15;10(1):3675. doi: 10.1038/s41467-019-11424-1. Nat Commun. 2019. PMID: 31417075 Free PMC article.
-
A mesial-to-lateral dissociation for orthographic processing in the visual cortex.Proc Natl Acad Sci U S A. 2019 Oct 22;116(43):21936-21946. doi: 10.1073/pnas.1904184116. Epub 2019 Oct 7. Proc Natl Acad Sci U S A. 2019. PMID: 31591198 Free PMC article.
-
Anatomy and physiology of word-selective visual cortex: from visual features to lexical processing.Brain Struct Funct. 2021 Dec;226(9):3051-3065. doi: 10.1007/s00429-021-02384-8. Epub 2021 Oct 12. Brain Struct Funct. 2021. PMID: 34636985 Free PMC article. Review.
References
-
- Dehaene S, Cohen L, Sigman M, Vinckier F. The neural code for written words: A proposal. Trends Cogn Sci. 2005;9:335–341. - PubMed
-
- Cohen L, et al. The visual word form area: Spatial and temporal characterization of an initial stage of reading in normal subjects and posterior split-brain patients. Brain. 2000;123:291–307. - PubMed
Publication types
MeSH terms
LinkOut - more resources
Full Text Sources
Other Literature Sources
