. 2018 Oct 2;115(40):10142-10147.
doi: 10.1073/pnas.1808066115. Epub 2018 Sep 17.

Metabolic regulation and glucose sensitivity of cortical radial glial cells

Affiliations

Metabolic regulation and glucose sensitivity of cortical radial glial cells

Brian G Rash et al. Proc Natl Acad Sci U S A. .

Abstract

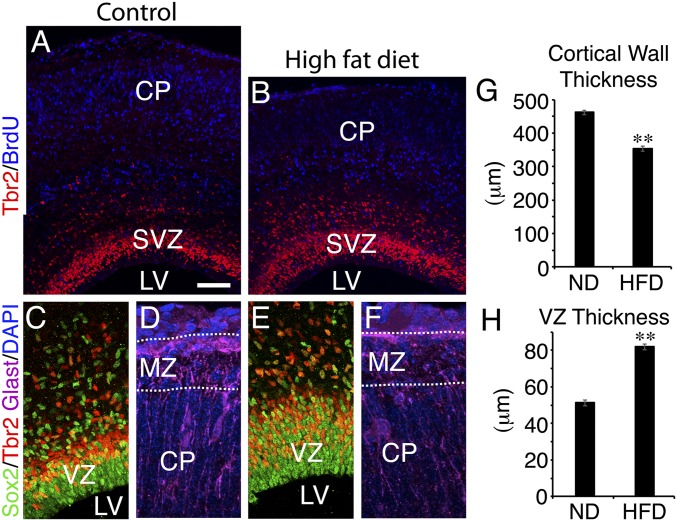
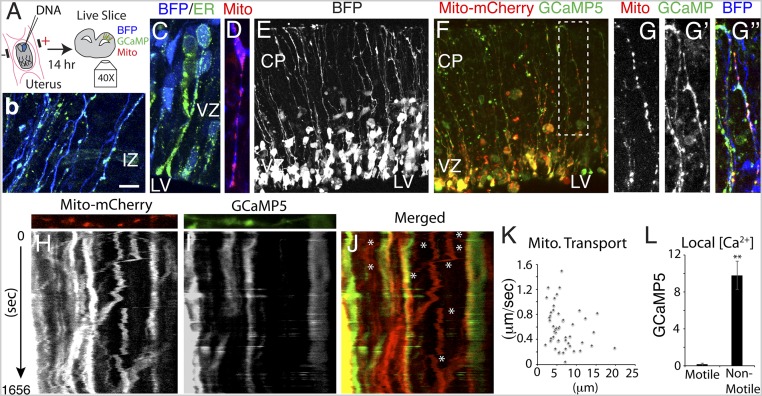
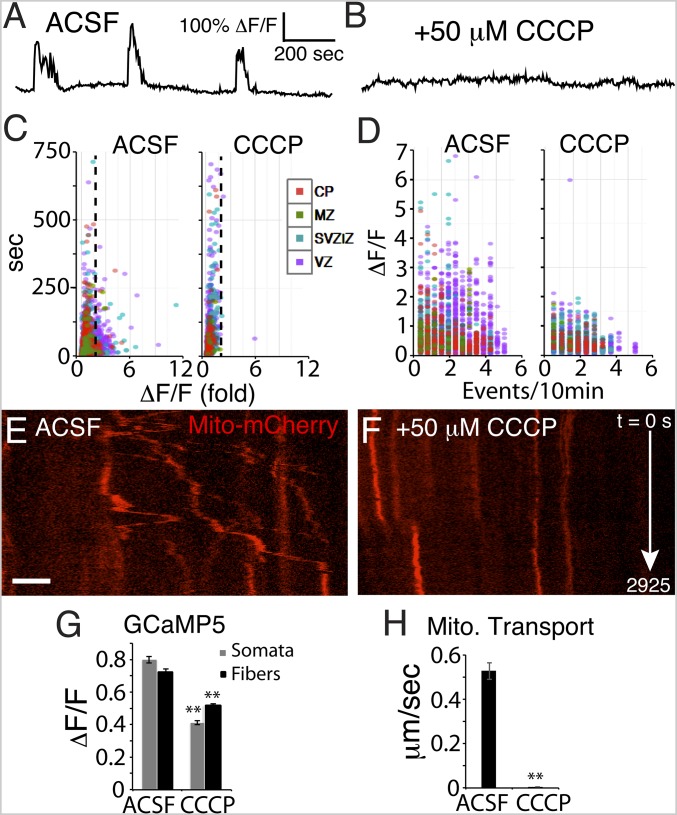
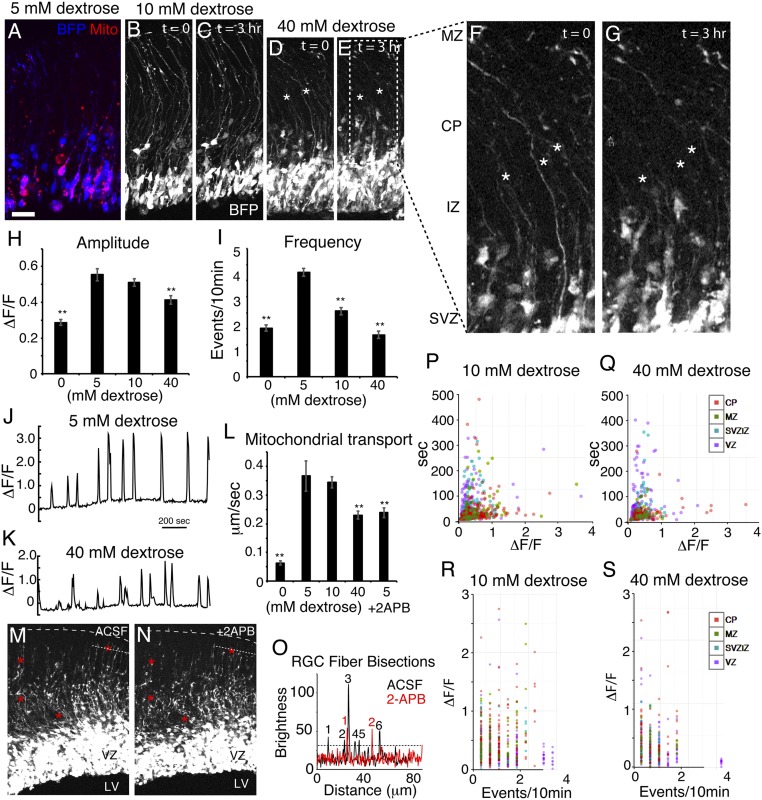
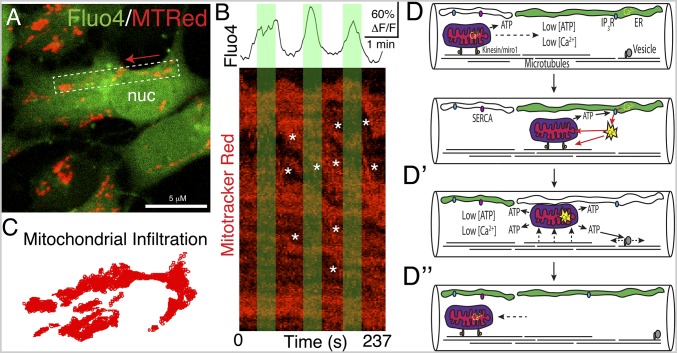
The primary stem cells of the cerebral cortex are the radial glial cells (RGCs), and disturbances in their operation lead to myriad brain disorders in all mammals from mice to humans. Here, we found in mice that maternal gestational obesity and hyperglycemia can impair the maturation of RGC fibers and delay cortical neurogenesis. To investigate potential mechanisms, we used optogenetic live-imaging approaches in embryonic cortical slices. We found that Ca2+ signaling regulates mitochondrial transport and is crucial for metabolic support in RGC fibers. Cyclic intracellular Ca2+ discharge from localized RGC fiber segments detains passing mitochondria and ensures their proper distribution and enrichment at specific sites such as endfeet. Impairment of mitochondrial function caused an acute loss of Ca2+ signaling, while hyperglycemia decreased Ca2+ activity and impaired mitochondrial transport, leading to degradation of the RGC scaffold. Our findings uncover a physiological mechanism indicating pathways by which gestational metabolic disturbances can interfere with brain development.

Keywords: calcium; metabolic disorders; mitochondria; radial glia; stem cell.


Conflict of interest statement

The authors declare no conflict of interest.

Figures

Fig. 1.
Fig. 1.
Gestational obesity delays cortical neurogenesis and impairs radial fiber maturation. Coronal sections of E17.5 CD1 cortex (n = 4) from normal-diet (ND) mothers (A, C, and D) compared with embryos (n = 4) from HFD obese, hyperglycemic mothers (B, E, and F) stained for the RGC marker Sox2, the SVZ marker Tbr2, BrdU (E12.5 injection), or GLAST, a marker of RGCs and presumptive astrocytes. Cortical wall thickness was reduced (G), while the progenitor layers were increased in thickness (H). The presence of BrdU+ presumptive neurons in the cortical plate (CP) of HFD embryos also appeared to be reduced (A and B), and RGC basal fibers showed disorganized and immature pial endfoot projections in the marginal zone (MZ). A is a composite of two images. (Scale bar: 100 μm in A and B; 50 μm in C and E; 20 μm in D and F.) Error bars represent SEM. **P < 0.0001. LV, lateral ventricle.
Fig. 2.
Fig. 2.
Inverse relationship between Ca2+ activity and mitochondrial transport. (A) Schematic of an in utero electroporation videomicroscopy experiment. (B and C) ER is present throughout RGC somata, fibers, and endfeet, as indicated by direct fluorescence of ER-targeted EGFP (n = 3 embryos). (DJ) Mitochondria were labeled with Mito-mCherry (D), along with cytoplasmic BFP and GCaMP5 (EG), and their transport was monitored by live imaging in relation to Ca2+ signaling and displayed as dual-color kymographs (n = 19 slices from 12 embryos) (HJ). G is a high magnification view of the boxed region in F. (K) Mitochondrial transport rates and distances are presented as a scatterplot (n = 47 mitochondria from n = 3 embryos). Mitochondrial transport was more rapid where [Ca2+] was lower (J, asterisks, and L, n = 39). (Scale bar: 10 μm in B–D and HJ; 50 μm in E and F.) **P < 0.0001.
Fig. 3.
Fig. 3.
Mitochondrial function is needed for Ca2+ dynamic activity and mitochondrial motility in RGCs. (AG) Optically recorded Ca2+ dynamic activity in RGCs was severely reduced by the protonophore CCCP. (A and B) Optogenetic GCaMP5 signal traces from a single RGC illustrate Ca2+ activity silencing by CCCP. The largest Ca2+ events, above twofold ΔF/F (dotted line), were abolished by CCCP exposure (C); many small-amplitude/long-duration “events” are detected by MATLAB due to movement artifacts in ROIs of the slice movie. High-frequency/high-amplitude events were reduced in number (D); n = 2,830 RGC control Ca2+ events and n = 1,971 CCCP Ca2+ events; n = 3 slices. Mitochondrial transport was also severely reduced (kymographs in E, F, and H); n = 64 control and n = 77 CCCP mitochondria analyzed; n = 3 slices. (Scale bar: 10 μm in E and F.). **P < 0.0001
Fig. 4.
Fig. 4.
Hyperglycemia degrades the RGC scaffold, Ca2+ signaling, and mitochondrial motility. (AG) BFP Z-stacks of labeled RGCs show retraction (asterisks) of RGC fibers after exposure to 5, 10, and 40 mM glucose (n = 4, 5, and 4 slices, respectively). (H and I) Ca2+ activity was severely reduced after a few minutes without glucose and reached a maximum in the euglycemic range (5 to 10 mM), but at 40 mM, it was reduced in amplitude and frequency. (J and K) Example optogenetic Ca2+ signal traces of the same RGC at 5 and 40 mM illustrate the reduced amplitude of signals during hyperglycemia. (L) Mitochondrial transport was nearly abolished in the absence of dextrose but showed a maximum at euglycemia and a decrease during hyperglycemia as well as in the presence of 100 μM 2-APB (n = 3 slices). RGC fibers showed retraction after exposure to 2-APB (M and N; red asterisks) and the number of fibers crossing the fine dotted line was reduced by 2-APB (O). Calcium event property distributions of RGC ROIs in euglycemia and hyperglycemia by region are plotted in PS. (Scale bar: 30 μm in A–E; 10 μm in F and G.) **P < 0.0001.
Fig. 5.
Fig. 5.
Mitochondrial motility regulated by cyclical charging/discharging of Ca2+ in cortical stem cells. (A) High-magnification view of a mouse cortical NSC derived from an E11.5 embryo and labeled with Fluo4 and Mitotracker Red. Mitochondrial movement direction is indicated by a red arrow; see also Movie S12. nuc, nucleus. (B) Boxed region in A extracted from the dual-channel movie file and converted to a kymograph and related to the Ca2+ signal intensity. Rapid mitochondrial movements (asterisks) are more common with lower Ca2+ than high Ca2+ (green regions) (n = 23 cells from n = 4 plates). Other mitochondria appear unaffected by Ca2+ fluctuations. (C) Total mitochondrial infiltration of the cell in A was captured in a movie and displayed as a scatterplot of the accumulated xy-coordinates of mitochondrial ROIs. (D) Model of Ca2+ regulation of mitochondrial motility. Low Ca2+ permits rapid mitochondrial transport along microtubules within RGC fibers. (D′) ER Ca2+ discharge inactivates mitochondrial transport machinery and promotes ATP production. (D″) Ca2+ reuptake by ER returns the cytosol to a low Ca2+ state, reactivating mitochondrial shuttling. IP3R, inositol trisphosphate receptor; SERCA, sarco/endoplasmic reticulum Ca2+-ATPase.

References

    1. Rakic P. Specification of cerebral cortical areas. Science. 1988;241:170–176. - PubMed
    1. Lui JH, Hansen DV, Kriegstein AR. Development and evolution of the human neocortex. Cell. 2011;146:18–36. - PMC - PubMed
    1. Dehay C, Kennedy H. Cell-cycle control and cortical development. Nat Rev Neurosci. 2007;8:438–450. - PubMed
    1. Geschwind DH, Rakic P. Cortical evolution: Judge the brain by its cover. Neuron. 2013;80:633–647. - PMC - PubMed
    1. Ackman JB, Burbridge TJ, Crair MC. Retinal waves coordinate patterned activity throughout the developing visual system. Nature. 2012;490:219–225. - PMC - PubMed

Publication types

MeSH terms

LinkOut - more resources