. 2018 Sep 17;9(10):934.
doi: 10.1038/s41419-018-0989-8.

Autophagy-independent induction of LC3B through oxidative stress reveals its non-canonical role in anoikis of ovarian cancer cells

Affiliations

Autophagy-independent induction of LC3B through oxidative stress reveals its non-canonical role in anoikis of ovarian cancer cells

Eswara Murali Satyavarapu et al. Cell Death Dis. .

Retraction in

Abstract

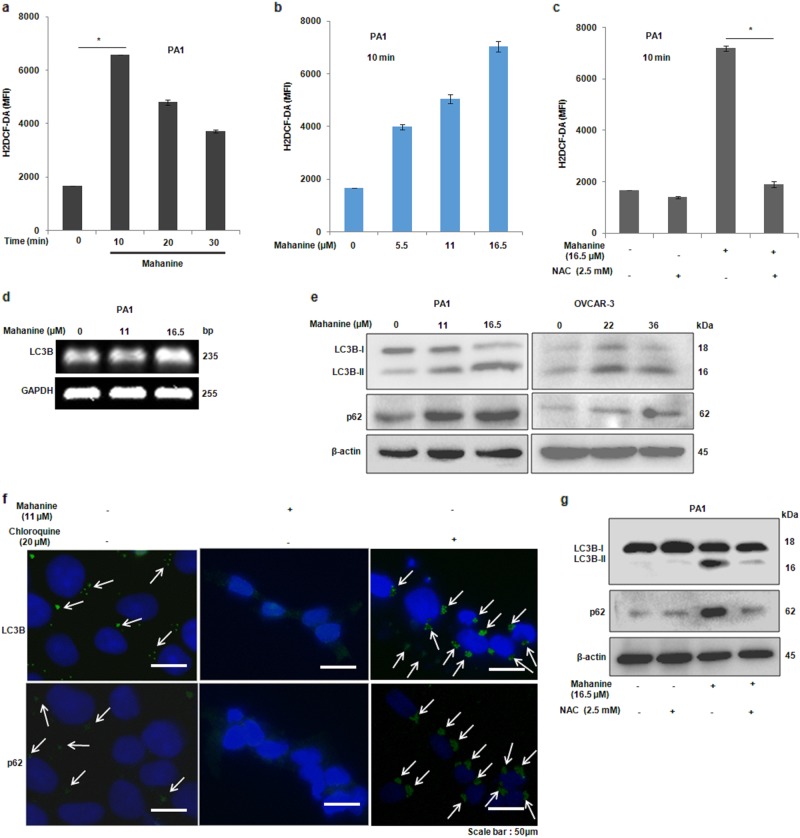
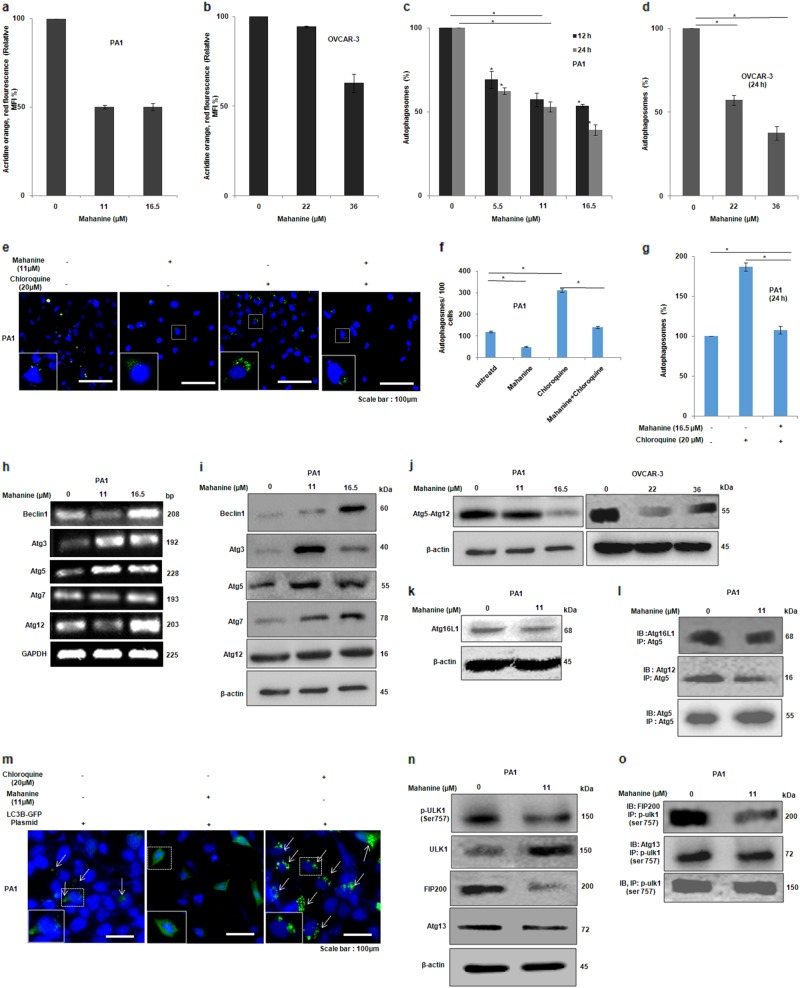
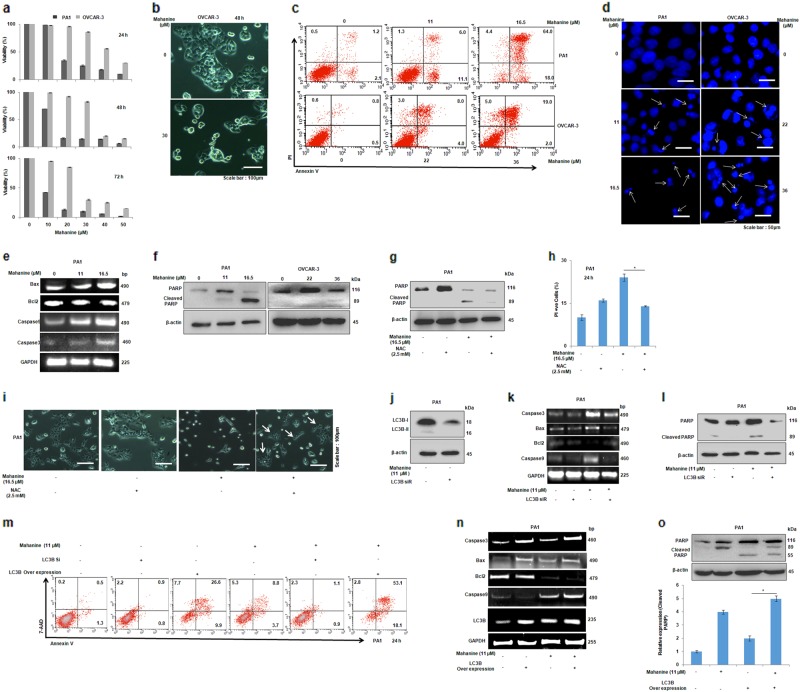
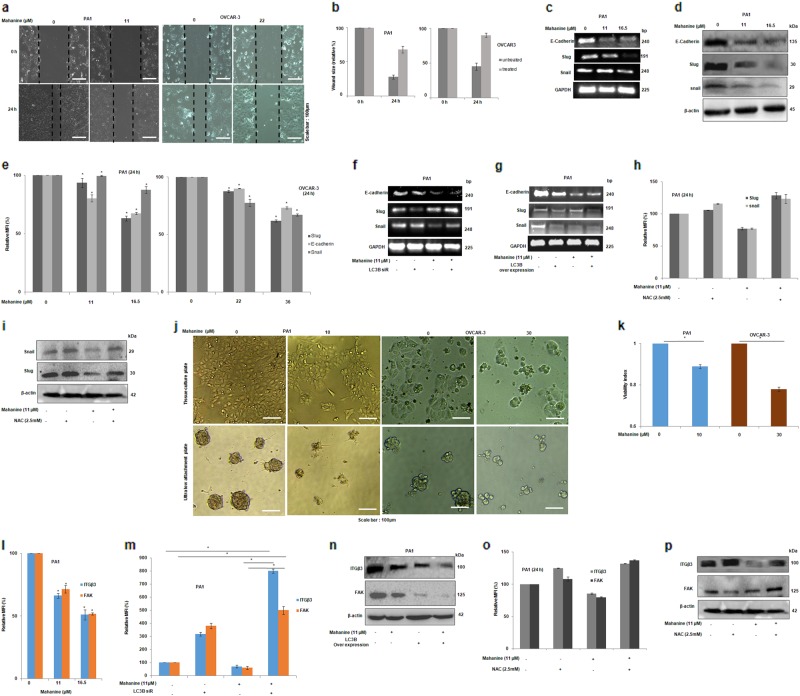
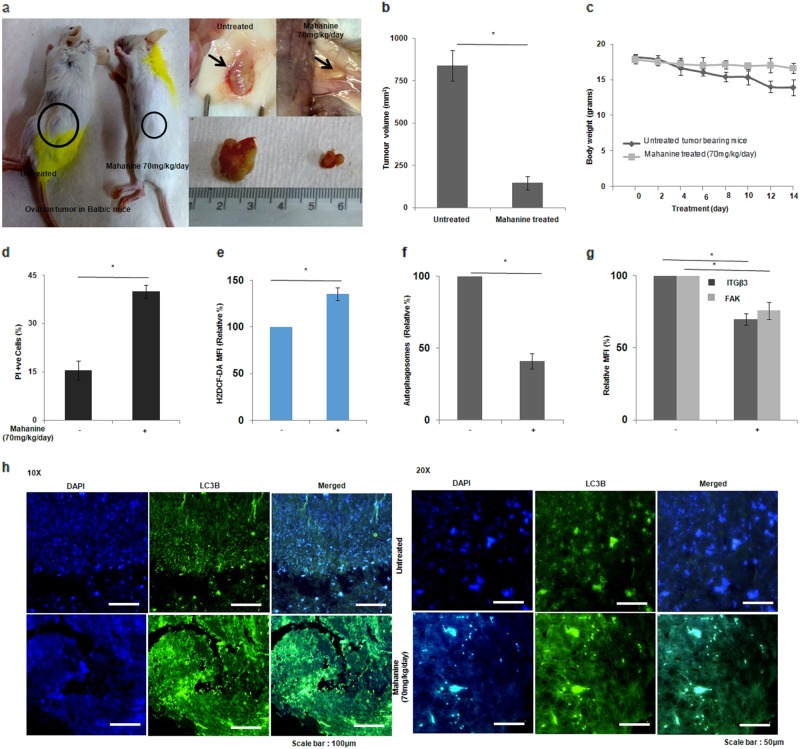
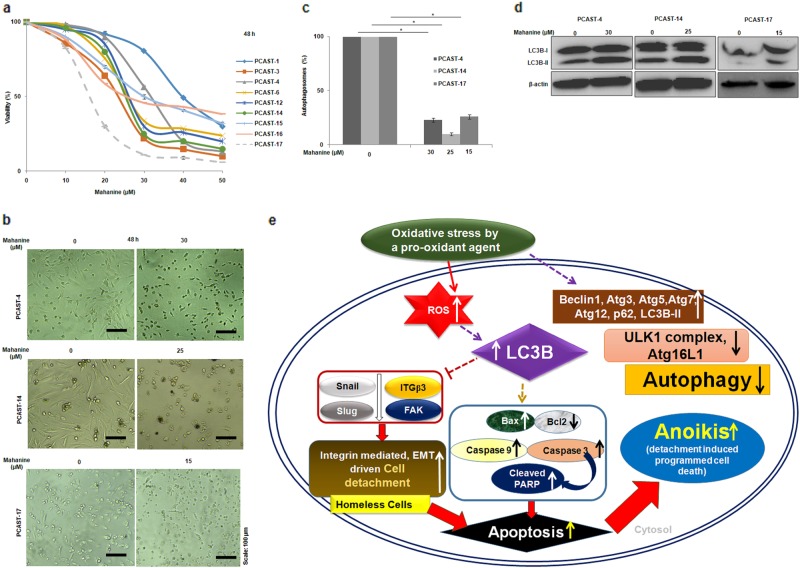
Cancer cells display abnormal redox metabolism. Autophagy, anoikis and reactive oxygen species (ROS) play a regulatory role during metastasis. LC3 is a well-known essential molecule for autophagy. Therefore, we wanted to explore the molecular interplay between autophagy, anoikis, and ROS in relation to LC3B. We observed enhanced LC3B level along with increased expression of p62 and modulation of other autophagy-related molecules (Atg 3, 5, 7, 12, 16L1 and Beclin1) by inducing oxidative-stress in ovarian cancer cells using a ROS-producing pro-oxidant molecule. Surprisingly, enhanced LC3B was unable to induce autophagosome formation rather promoted anoikis. ROS-induced inhibition of autophagosome-formation is possibly due to the instability of autophagy initiator, ULK1 complex. Moreover, such upregulation of LC3B via ROS enhanced several apoptotic molecules. Silencing LC3B reduced these apoptotic molecules and increased when overexpressed, suggesting its role in apoptosis. Furthermore, LC3B-dependent apoptosis was decreased by inhibiting ROS, indicating a possible link between ROS, LC3B, and apoptosis. Additionally, ROS-induced enhanced LC3B promoted detachment-induced cell death (anoikis). This was further reflected by reduced cell adhesion molecules (integrin-β3 and focal adhesion kinase) and mesenchymal markers (snail and slug). Our in vitro experimental data was further confirmed in primary tumors developed in syngeneic mice, which also showed ROS-mediated LC3B enhancement along with reduced autophagosomes, integrin-β3 and focal adhesion kinase ultimately leading to the decreased tumor mass. Additionally, primary cells from high-grade serous carcinoma patient's ascites exhibited LC3B enhancement and autophagy inhibition through ROS which provided a clinical relevance of our study. Taken together, this is the first evidence for a non-canonical role of LC3B in promoting anoikis in contrast to autophagy and may, therefore, consider as a potential therapeutic target molecule in ovarian cancer. Taken together, autophagy-inhibition may be an alternative approach to induce apoptosis/anoikis in cancer.


Conflict of interest statement

The authors declare that they have no conflict of interest.

Figures

Fig. 1
Fig. 1. Oxidative stress induces LC3B but unable to form autophagosomes.
a PA1 cells were exposed to a pro-oxidant molecule (mahanine, 16.5 µM) for 0–30 min and stained with H2DCF-DA. Mean fluorescence intensity (MFI) emitted by each cell/event was measured by FACS. Mahanine was purified from an Indian medicinal plant as described in Supplementary Fig. S1. b PA1 were exposed to different doses of mahanine for 10 min processed similarly. c Cells were pre-incubated with NAC (2.5 mM, 60 min) and washed. These cells were exposed to mahanine (16.5 µM) for 10 min and processed. d RNA was isolated from treated and untreated cells and RT-PCR was performed using LC3B-specific primers. e PA1 and OVCAR3 were treated with different doses of mahanine for 24 h and were analyzed by western blot using anti-LC3B and anti-p62 antibodies. f Treated and untreated PA1 cells were allowed to attach on the coverslip and immune-stained with anti-LC3B and anti-p62 antibodies and green color was seen using fluorescence-conjugated secondary antibody. g PA1 cells were pre-incubated with NAC for 1 h before treatment with mahanine (24 h). Proteins were isolated and analyzed by western blot using specific antibodies. The data represented as the mean ± SD of three independent experiments.‘*represented the significant difference of p < 0.05
Fig. 2
Fig. 2. ROS induces autophagy-related molecules but inhibits the autophagosome formation.
a, b PA1 and OVCAR-3 (5 × 105 cells/well) were treated with different doses of a pro-oxidant agent (mahanine, 24 h) to induce oxidative stress. They were stained with acridine orange as discussed in methods and analyzed by FACS. Acidic vacuoles were measured by decreased relative MFI of red fluorescence where MFI of untreated cells was considered as 100 and compared with treated cells. c PA1 cells (5 × 105 per well) were incubated with mahanine, stained with an autophagosome specific green reagent and analyzed by FACS. d Mahanine-treated (24 h) OVCAR-3 cells were stained with green reagent and processed similarly. e PA1 cells (1 × 104 per well) after attachment on the coated glass coverslip were treated either with mahanine or chloroquine alone or in combination for 24 h, stained similarly and visualized. Green dots representing autophagosomes were captured with fluorescence microscope; scale bar: 100 μm. f Number of autophagosomes (green dots) in the above experiment was counted per 100 cells in each case. g PA1 cells (5 × 105/well) were treated with either chloroquine alone or with both chloroquine and mahanine combination. These cells were stained with green reagent and analyzed by FACS. h Cells were exposed to increasing concentrations of mahanine for 24 h. Total RNA was isolated and RT-PCR was performed using specific primers. i Untreated and treated cells (24 h) were sonicated, cell lysates were electrophoresed and analyzed by western blot using specific antibodies. j Cell lysate as described above was analyzed by western blot using the anti-Atg12 antibody that can specifically detect Atg5–Atg12 conjugate. k Cell lysate as described above was analyzed by western blot using anti-Atg16L1 antibody. l Total protein from untreated and mahanine-treated (24 h) PA1 cells was co-immunoprecipitated with anti-Atg5 antibody and immunocomplex was analyzed with anti-Atg16L1and anti-Atg12 antibodies separately. m Cells were allowed to attach coverslip and transfected with EGFP-LC3B plasmid and then treated with mahanine and chloroquine separately for 24 h. Images were captured by fluorescence microscope; arrows representing the green punctuate (representing autophagosomes). Zoomed-in insets were provided for a representative cell. n Cell lysate as described above was analyzed by western blot using specific antibodies. o Total protein from untreated and mahanine-treated (24 h) PA1 cells was co-immunoprecipitated with anti-p-ULK1(ser 757) antibody and immunocomplex was analyzed with anti-Atg13 and anti-FIP200 antibodies. Initiation of autophagy is mediated by the unc-51–like autophagy-activating kinase 1/2 complex (ULK1/2–Atg13–FIP200–Atg101). These data were derived from three individual experiments and mean ± SD was indicated.‘*represented the significant difference of p < 0.05
Fig. 3
Fig. 3. LC3B mediates enhanced apoptosis through ROS in ovarian cancer cells.
a PA1 and OVCAR-3 cells were exposed to varying concentrations of a pro-oxidant agent (mahanine, 48 h) to induce oxidative stress. Growth-inhibitions were assessed by MTT assay. Cell viability was calculated as the percentage relative to untreated cells which were considered as 100%. b Floating cells in mahanine-treated wells were removed and then phase-contrast images were captured. It shows the collapse of morphology in mahanine-treated cells; scale bar: 100 μm. c PA1 and OVCAR-3 were exposed to mahanine and stained with FITC-Annexin-V and PI and analyzed by flow cytometry. d Mahanine-treated cells were stained with DAPI. Arrow indicates the condensed or fragmented nucleus (scale bar: 50μm). e RT-PCR was performed using specific primers (Caspase3, Capase9, Bax and Bcl2) with total RNA isolated from treated and untreated cells then electrophoresed. f Cell lysate as described above was analyzed by western blot using anti-PARP antibody. g NAC-pretreated PA1 cells were exposed to mahanine and analyzed by western blot with the anti-PARP antibody. h NAC-pretreated PA1 cells were incubated with mahanine and cell death was measured with PI and analyzed by FACS. i The reversal of cell death and regain of cell shape and density was also visualized by phase-contrast images after removing floating cells. Arrow represents the live cell colonies in a NAC-pretreated mahanine-treated cell. j Cells were transfected with LC3B-siRNA and knocked down of LC3B was confirmed by western blot. k LC3B-siRNA transfected and un-transfected cells were exposed to mahanine. RNA was isolated. mRNA levels of apoptotic/anti-apoptotic molecules were analyzed by RT-PCR using specific primers. l Proteins were isolated from LC3B-knocked down cells and analyzed by western blot using anti-PARP antibody. m PA1 was either transfected with LC3B-siRNA or with EGFP-LC3B and exposed mahanine and stained with Annexin-V-PE and 7-AAD. These were analyzed by flow cytometry. n RNA was isolated from mahanine-exposed EGFP-LC3B transfected and un-transfected cells and analyzed by RT-PCR using specific primers to check their gene expression changes. o Cell lysate from LC3B-overexpressed cells was analyzed by western blot using anti-PARP antibody. LC3B overexpressed cells showed different PARP cleavage pattern. Both cleaved bands (89 and 55 kDa) were quantified using ‘ImageJ’ software and represented in the bar graph. These data were derived from three individual experiments and mean ± SD was indicated. ‘*’represented the significant difference of p < 0.05
Fig. 4
Fig. 4. Mahanine reduced both epithelial and mesenchymal markers in LC3B-dependent manner and induces anoikis.
a PA1 and OVCR3 cells were seeded in 6-well plate and grown up to > 90% confluent. A confluent monolayer of both cells was scraped with the micropipette tip and exposed to the mahanine. Cells migrated to the wounded region were assessed by phase-contrast microscopy. b The inhibition of migration was expressed by calculating the area of a wound as the relative percentage in comparison to untreated cells. c Cells were treated with increasing doses of mahanine and RT-PCR (for genetic expression) was performed using specific primers. d Protein was isolated from mahanine-treated cells and analyzed by western blot using anti-E-cadherin, anti-slug and anti-snail antibodies separately. e PA1 and OVCAR3 cells were treated with mahanine and the expression levels were monitored using fluorescence-tagged antibodies against E-cadherin, snail, and slug by FACS analysis. f, g Genetic manipulation of LC3B is achieved by transfection of cells with LCB-siRNA or EGFP-LC3B plasmid. These transfected cells were incubated with mahanine for 24 h and RT-PCR was performed with specific primers. Expression levels were compared to un-transfected treated cells. h, i NAC pre-treated cells incubated with mahanine for 24 h and analyzed by FACS and western blot using specific antibodies. j Cells were seeded in TCP or ULA 96 well plate and exposed to mahanine for 48 h. Images were taken with a phase-contrast microscope and sphere formation (PA1) or multi-cellular aggregates (OVCAR-3) were observed. OD < 1.0 representing anoikis-sensitization by mahanine leads to detachment-induced cell death (anoikis). k Cell viability was checked by MTT assay. Viability Index (VI) was calculated by taking the ratio of OD in ULA to TCP plates. l Mahanine-treated PA1 cells (24 h) were stained with fluorescence-tagged antibodies against integrin-β3 and FAK separately and analyzed by FACS to check the protein levels. m LC3B-siRNA transfected cells were incubated with mahanine for 24 h. Integrin-β3 and FAK expression were similarly measured by FACS. n LC3 over-expressed cells were treated with mahanine and analyzed by western blot using specific antibodies. o, p. NAC pre-treated cells were exposed to mahanine (24 h) and the expression levels integrin-β3 and FAK were monitored both by FACS and western blot using specific antibodies. All Individual experiments were repeated for at least three times and mean ± SD was calculated. ‘*’ represented the significant difference of p < 0.05
Fig. 5
Fig. 5. Mahanine upregulated LC3B, inhibited autophagy and induced anoikis resulting in reduced tumor-growth in the syngenic mouse model.
a Representative images of mahanine (70 mg/kg/day, 14 days of consecutive treatment) or vehicle (10% ethanol, i.p.) treated tumors in BALB/c mice (n = 10) generated by injecting ID8 cells (s.c; 7 × 106; in 100 µL PBS, matrigel in 1:1) in the left flank; arrows showing tumors attached to the subcutaneous region of mice after dissection. b Mean of tumor volume in mm3 measured at the end of treatment period (14 days) and compared with untreated. c Body weights (grams) of both untreated and treated mice were measured on every alternate day during the treatment period plotted on the graph. d Primary cells were isolated from tumors and measured the apoptotic cells by PI staining. ~ 3-fold increase PI positivity found in treated tumor mass compared to untreated). e Primary cells stained with H2DCF-DA for the measurement of the ROS by FACS and found ~1.5 fold increased ROS. f. Primary cells were stained with a green reagent to measure autophagosomes by FACS which shows ~ 50% reduced autophagosomes. g Primary tumor cells were incubated with fluorescence-tagged anti-integrin-β3 and anti-FAK antibodies, analyzed by FACS and represented as relative MFI. h Tumors tissues from both treated and untreated animals were collected, fixed in 5% formalin solution and processed. Thin sections were incubated with anti-LC3B antibody and followed by Alexa Flour 488 conjugated secondary antibody. Slides were visualized using a fluorescence microscope. All Individual experiments were repeated for at least three times and mean ± SD was calculated. ‘*’ represented the significant difference of p < 0.05
Fig. 6
Fig. 6. Mahanine up-regulating LC3B through oxidative stress and inhibits cell growth and autophagy in primary cells isolated from patients with high-grade serous histology.
a Primary cancer cells were isolated from ascitic fluid of nine patients . Cells (1 × 104 /well) were plated, treated with mahanine and processed as described in Fig. 3a. b Primary cells from three representative patients (5 × 105 per well in 6-well plates) were treated with mahanine (near to IC50 dose). Phase-contrast images showing the collapse of morphology in treated cells (scale bar: 100 μm). c Primary cells from three representative patients (PCAST-4, PCAST-14, and PCAST-17) were treated similarly for 24 h and processed to determine the percent autophagosome by FACS, which exhibited reduced autophagosome-formation up to ~ 70%. d Primary cells (1 × 106/well) from these patients were treated with mahanine for 24 h. Cell lysates were electrophoresed and analyzed by western blot using anti-LC3B antibodies. e Model illustrating the possible mechanism of oxidative stress-induced enhanced LC3B leading to anoikis but inhibited autophagy. A pro-oxidant agent (mahanine) enhanced LC3B via oxidative stress, which induces cell detachment by modulating EMT markers and downregulating cell adhesion molecules like integrin-β3 and focal adhesion kinase (FAK), leading to form homeless cells. Enhance LC3B also induces the apoptotic molecules (caspase-3, caspase-9, Bax and PARP cleavage) and downregulate anti-apoptotic molecule (Bcl2), which induces detachment-induced cell death (Anoikis). Such oxidative stress induces autophagy-related molecules like Atg 3, 5, 7, 12, p62, Beclin1 and LC3B-II, and also inhibits the formation of ULK1 complex, which leads to inhibition of autophagy

Similar articles

Cited by

References

    1. Eisenberg-Lerner A, Bialik S, Simon HU, Kimchi A. Life and death partners: apoptosis, autophagy and the cross-talk between them. Cell Death Differ. 2009;16:966–975. doi: 10.1038/cdd.2009.33. - DOI - PubMed
    1. Gugnoni M, Sancisi V, Manzotti G, Gandolfi G, Ciarrocchi A. Autophagy and epithelial–mesenchymal transition: an intricate interplay in cancer. Cell Death Dis. 2016;7:e2520. doi: 10.1038/cddis.2016.415. - DOI - PMC - PubMed
    1. Huang RY, et al. An EMT spectrum defines an anoikis-resistant and spheroidogenic intermediate mesenchymal state that is sensitive to e-cadherin restoration by ansrc-kinase inhibitor, saracatinib (AZD0530) Cell Death Dis. 2013;4:e915. doi: 10.1038/cddis.2013.442. - DOI - PMC - PubMed
    1. Taddei M, Giannoni E, Fiaschi T, Chiarugi P. Anoikis: an emerging hallmark of health and diseases. J. Pathol. 2012;226:380–393. doi: 10.1002/path.3000. - DOI - PubMed
    1. Cai Q, Yan L, Xu Y. Anoikis resistance is a critical feature of highly aggressive ovarian cancer cells. Oncogene. 2015;34:3315–3324. doi: 10.1038/onc.2014.264. - DOI - PMC - PubMed

Publication types

Substances