. 2018 Oct;50(10):1381-1387.
doi: 10.1038/s41588-018-0204-y. Epub 2018 Sep 17.

Mutational processes shape the landscape of TP53 mutations in human cancer

Affiliations

Mutational processes shape the landscape of TP53 mutations in human cancer

Andrew O Giacomelli et al. Nat Genet. 2018 Oct.

Abstract

Unlike most tumor suppressor genes, the most common genetic alterations in tumor protein p53 (TP53) are missense mutations1,2. Mutant p53 protein is often abundantly expressed in cancers and specific allelic variants exhibit dominant-negative or gain-of-function activities in experimental models3-8. To gain a systematic view of p53 function, we interrogated loss-of-function screens conducted in hundreds of human cancer cell lines and performed TP53 saturation mutagenesis screens in an isogenic pair of TP53 wild-type and null cell lines. We found that loss or dominant-negative inhibition of wild-type p53 function reliably enhanced cellular fitness. By integrating these data with the Catalog of Somatic Mutations in Cancer (COSMIC) mutational signatures database9,10, we developed a statistical model that describes the TP53 mutational spectrum as a function of the baseline probability of acquiring each mutation and the fitness advantage conferred by attenuation of p53 activity. Collectively, these observations show that widely-acting and tissue-specific mutational processes combine with phenotypic selection to dictate the frequencies of recurrent TP53 mutations.


Conflict of interest statement

Competing Financial Interests

M.M. is a consultant for OrigiMed and receives research support from Bayer. W.C.H. is a consultant for KSQ Therapeutics.

Figures

Figure 1
Figure 1. Deletion of endogenous wild-type but not mutant TP53 impacts fitness in human cancer cells
Comparison of enrichment scores for CRISPR-Cas9 reagents targeting TP53 (a) or MDM2 (b) in cell lines whose TP53 statuses were defined using TP53 mutation, copy-number, target gene expression, and nutlin-3 sensitivity data (see Supplementary Table 1). Only cell lines with concordant functional and genetic classifications were included in these analyses. Each point represents the gene-level score for a given cell line, and error bars indicate the mean and standard deviation of each group. Cell lines in the loss-of-function (LOF) category harbor homozygous deletion, frameshift, or nonsense mutation of TP53 and express low levels of p53 protein (see Supplementary Fig. 1c). (****, P < 0.0001, Two-tailed Welch’s t-test) (c) PARIS, a rescaled normalized mutual information (RNMI)-based statistical analysis was used to nominate genes whose enrichment scores were significantly different between the p53 non-functional mutant (LOF, missense, splice-site, and indel, with functional score < 0) and p53 functional wild-type (functional score > 0) cell line classes in genome-scale CRISPR-Cas9 and RNAi screens. Reported p53 pathway components that scored as significant (FDR < 0.05) in both analyses are highlighted in red. (d) Infographic depicting differential enrichment scores of reported p53 pathway members and target genes in genome-scale CRISPR-Cas9 (lower left triangle) and RNAi (upper right triangle) screens. Dashed lines indicate transcriptional regulation. Genes scoring as significant in both analyses are outlined in yellow.
Figure 2
Figure 2. Comprehensive mutational scanning of TP53
(a) A library comprising 8258 mutant TP53 alleles was introduced into A549 p53WT and p53NULL cells in a pooled format under conditions that favor the integration of a single vector in each cell. Library-infected p53WT cells were treated with nutlin-3, and library-infected p53NULL cells were treated with either nutlin-3 or etoposide. After 12 days, genomic DNA was harvested, PCR-amplified and subjected to next generation sequencing. (b–d) Heat maps of normalized allele enrichment scores (Z-scores) with codon-level average Z-scores plotted at right. (e) Left, The reported domain structure of p53 with residues 175, 248, and 273 highlighted: TAD = transactivation domain, PRD = Proline-rich domain, DBD = DNA-binding domain, ZN = Zinc-binding domain, 4D = tetramerization domain, CTD = C-terminal domain. Right, Total number of missense and nonsense mutations found at each codon in the IARC database,. (fh) Density plot of alleles with silent mutations (wild-type alleles), nonsense mutations at codons 44–289 (loss-of-function alleles), missense mutations that are common in cancer, and SNV-generated missense mutations that have never been observed in cancer. Differences among all groups of alleles were significant in each condition (P < 0.0001, Wilcoxon rank sum test).
Figure 3
Figure 3. Tissue-of-origin-selective TP53 mutations are linked to specific mutational processes
(a) Each signature in the COSMIC Mutational Signatures database contains 96 mutation probabilities, one for each trinucleotide mutation type,. To assign a baseline mutation probability to each TP53 allele for each signature, we first determined its trinucleotide mutation type, and then assigned the corresponding value from the database. Depicted here is the assignment of a mutation probability for Arg248Gln under the influence of Signature 1. (b) Fisher’s exact tests were performed to identify TP53 mutations that occur significantly more frequently in specific tumor types in the IARC, and GENIE databases. The heatmap shows the relative mutation probabilities for each of the indicated TP53 mutations under the influence of each signature, depicted graphically on a white-to-red scale as the signature-specific percentile of all SNV-derived TP53 mutations (n = 2810). The percent of tumors of each tissue-of-origin in which a given signature was found by Alexandrov et al. is depicted graphically on a white-to-black scale.
Figure 4
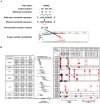
Figure 4. The TP53 mutational spectrum modeled as a function of mutational signatures and phenotypic selection
(a) Generalized linear models were trained to predict the mutation frequency of each TP53 allele in the IARC database, using mutational signatures from the COSMIC database,, phenotypic selection data from the TP53 MITE library screens, or both. (b) Position-level mutation rates predicted by the combined model are plotted downwards and observed mutation rates in the GENIE validation database are plotted upwards.

References

    1. Hainaut P, Pfeifer GP. Somatic TP53 Mutations in the Era of Genome Sequencing. Cold Spring Harb Perspect Med. 2016;6 - PMC - PubMed
    1. Petitjean A, et al. Impact of mutant p53 functional properties on TP53 mutation patterns and tumor phenotype: lessons from recent developments in the IARC TP53 database. Hum Mutat. 2007;28:622–9. - PubMed
    1. Milner J, Medcalf EA. Cotranslation of activated mutant p53 with wild type drives the wild-type p53 protein into the mutant conformation. Cell. 1991;65:765–74. - PubMed
    1. Harvey M, et al. A mutant p53 transgene accelerates tumour development in heterozygous but not nullizygous p53-deficient mice. Nat Genet. 1995;9:305–11. - PubMed
    1. de Vries A, et al. Targeted point mutations of p53 lead to dominant-negative inhibition of wild-type p53 function. Proc Natl Acad Sci U S A. 2002;99:2948–53. - PMC - PubMed

Methods-Only References

    1. Barretina J, et al. The Cancer Cell Line Encyclopedia enables predictive modelling of anticancer drug sensitivity. Nature. 2012;483:603–7. - PMC - PubMed
    1. Garnett MJ, et al. Systematic identification of genomic markers of drug sensitivity in cancer cells. Nature. 2012;483:570–5. - PMC - PubMed
    1. Seashore-Ludlow B, et al. Harnessing Connectivity in a Large-Scale Small-Molecule Sensitivity Dataset. Cancer Discov. 2015;5:1210–23. - PMC - PubMed
    1. Gao J, et al. Integrative analysis of complex cancer genomics and clinical profiles using the cBioPortal. Sci Signal. 2013;6:pl1. - PMC - PubMed
    1. Jeay S, et al. A distinct p53 target gene set predicts for response to the selective p53-HDM2 inhibitor NVP-CGM097. Elife. 2015;4 - PMC - PubMed

Publication types

Substances