. 2018 Sep 17;8(1):13900.
doi: 10.1038/s41598-018-31776-w.

Hotspots of soil organic carbon storage revealed by laboratory hyperspectral imaging

Affiliations

Hotspots of soil organic carbon storage revealed by laboratory hyperspectral imaging

Eleanor Hobley et al. Sci Rep. .

Abstract

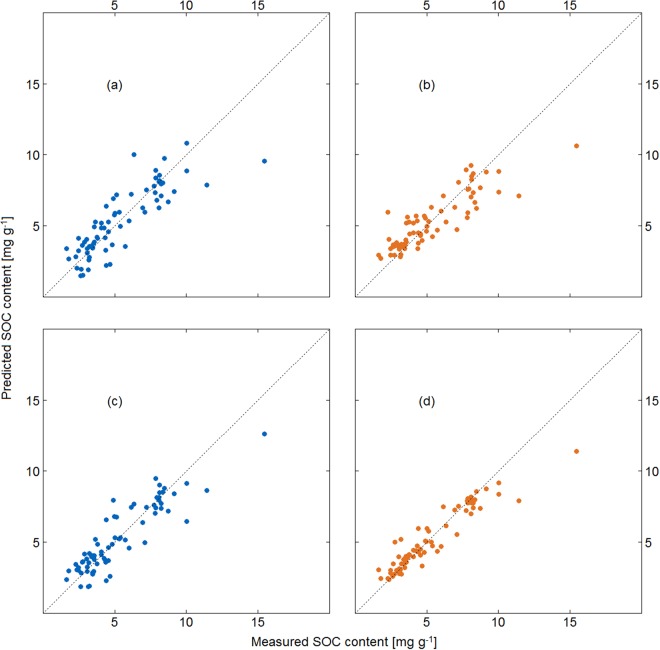
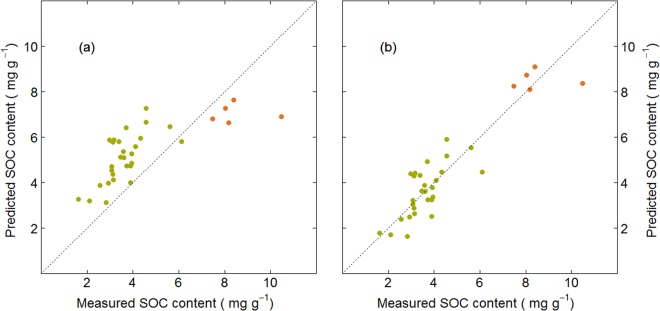
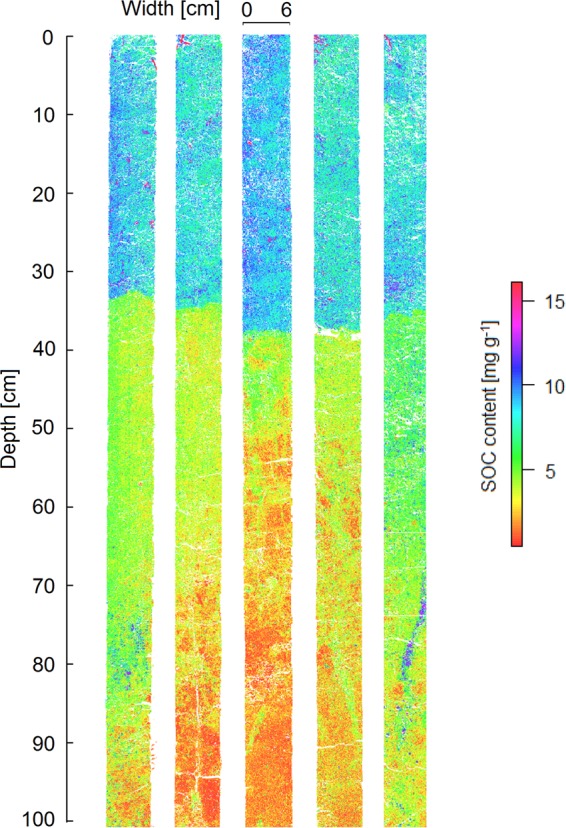
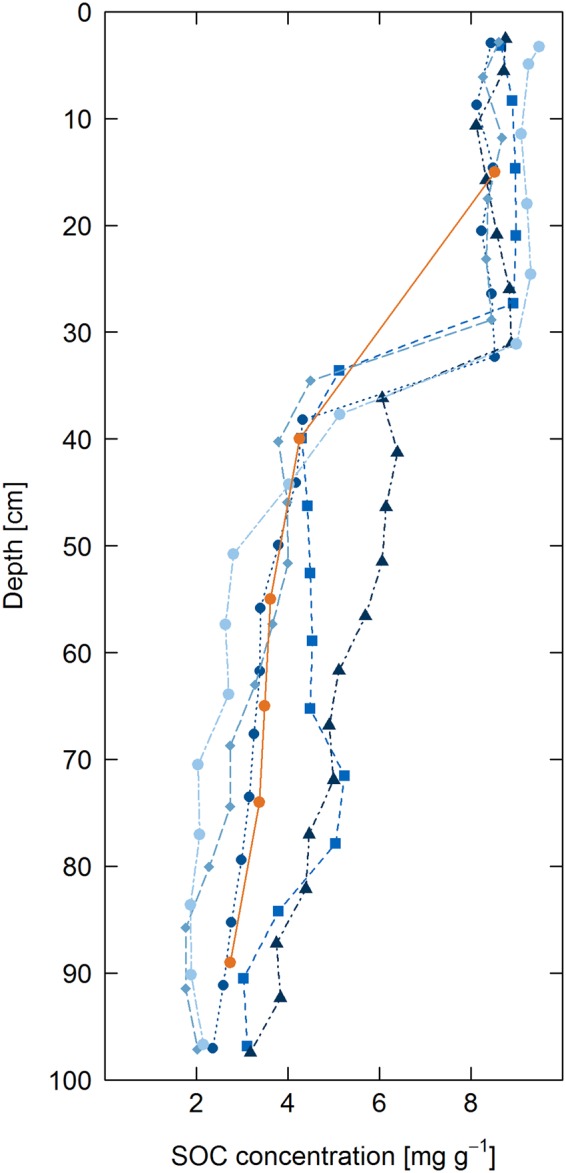
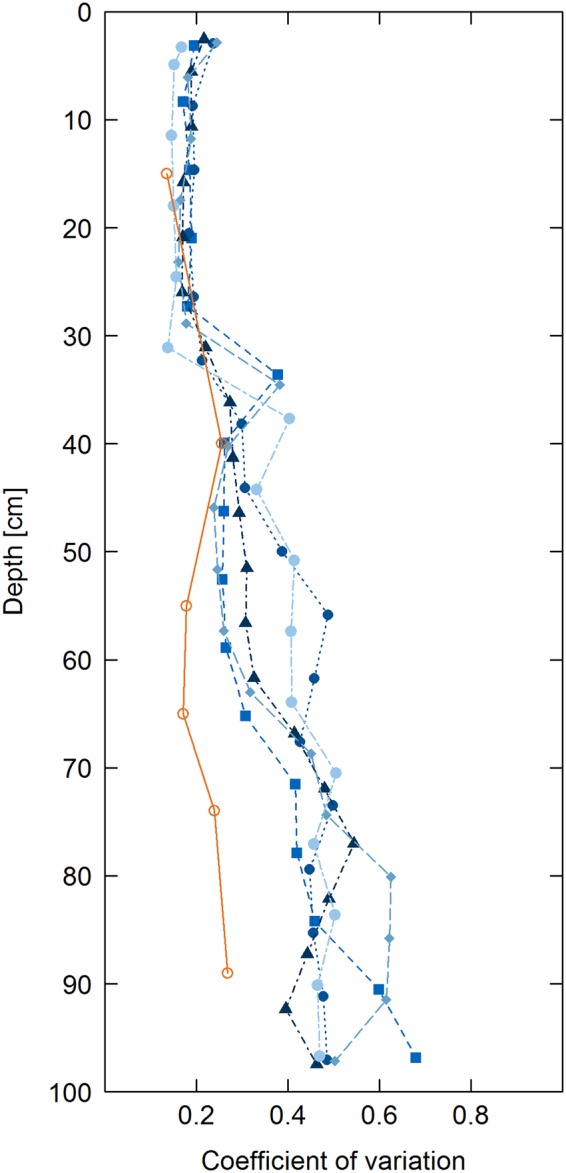
Subsoil organic carbon (OC) is generally lower in content and more heterogeneous than topsoil OC, rendering it difficult to detect significant differences in subsoil OC storage. We tested the application of laboratory hyperspectral imaging with a variety of machine learning approaches to predict OC distribution in undisturbed soil cores. Using a bias-corrected random forest we were able to reproduce the OC distribution in the soil cores with very good to excellent model goodness-of-fit, enabling us to map the spatial distribution of OC in the soil cores at very high resolution (~53 × 53 µm). Despite a large increase in variance and reduction in OC content with increasing depth, the high resolution of the images enabled statistically powerful analysis in spatial distribution of OC in the soil cores. In contrast to the relatively homogeneous distribution of OC in the plough horizon, the subsoil was characterized by distinct regions of OC enrichment and depletion, including biopores which contained ~2-10 times higher SOC contents than the soil matrix in close proximity. Laboratory hyperspectral imaging enables powerful, fine-scale investigations of the vertical distribution of soil OC as well as hotspots of OC storage in undisturbed samples, overcoming limitations of traditional soil sampling campaigns.


Conflict of interest statement

The authors declare no competing interests.

Figures

Figure 1
Figure 1
Hyperspectral images of the soil cores. Left: images normalized to reflectance target with RGB bands rendered using three bands in the visual range of the spectrum (red: 580 nm, green: 550 nm, blue 450 nm). Right: first three principal components calculated on individual cores displayed as RGB bands (red: principal component 1, green: principal component 2, blue: principal component 3).
Figure 2
Figure 2
Predicted vs. measured SOC content of the calibration (ROI) dataset for (a) partial least squares predictions using the normalized reflectance spectra, (b) random forest predictions using the normalized reflectance spectra, (c) partial least squares predictions using the standard normal variate spectra, (d) random forest predictions using the standard normal variate spectra.
Figure 3
Figure 3
Predicted vs. measured SOC contents of the evaluation data set, i.e. based on SOC contents in the whole core, modelled via random forest (a) before and (b) after bias correction. Topsoil samples are indicated by orange dots, subsoil samples by green dots.
Figure 4
Figure 4
SOC distribution predicted using bias corrected random forests from hyperspectral images of five soil cores.
Figure 5
Figure 5
Vertical distribution of mean SOC contents measured in bulk core samples (orange) and SOC predicted using bias corrected random forests from hyperspectral images of individual soil cores (blue and black).
Figure 6
Figure 6
Vertical distribution of coefficient of variation of SOC across bulk cores (orange) and within cores calculated from SOC predicted using bias corrected random forests from hyperspectral images.
Figure 7
Figure 7
Subsoil biopores in different cores at a depth of ca. 69–83 cm (top) and 53–64 cm (bottom). Left: hyperspectral image with RGB bands in red, green and blue regions of visual spectrum. (red: 580 nm, green: 550 nm, blue 450 nm). Middle: first three principal components of hyperspectral image (red: principal component 1, green: principal component 2, blue: principal component 3). Right: predicted SOC content using a bias corrected random forest algorithm.

References

    1. Batjes NH. Total carbon and nitrogen in the soils of the world. European Journal of Soil Science. 1996;47:151–163. doi: 10.1111/j.1365-2389.1996.tb01386.x. - DOI
    1. Hobley E, Wilson B, Wilkie A, Gray J, Koen T. Drivers of soil organic carbon storage and vertical distribution in Eastern Australia. Plant Soil. 2015;390:111–127. doi: 10.1007/s11104-015-2380-1. - DOI
    1. Schweizer SA, Hoeschen C, Schlüter S, Kögel-Knabner I, Mueller CW. Rapid soil formation after glacial retreat shaped by spatial patterns of organic matter accrual in microaggregates. Global Change Biol. 2018;24:1637–1650. doi: 10.1111/gcb.14014. - DOI - PubMed
    1. Steffens M, et al. Identification of Distinct Functional Microstructural Domains Controlling C Storage in Soil. Environ. Sci. Technol. 2017;51:12182–12189. doi: 10.1021/acs.est.7b03715. - DOI - PubMed
    1. Jobbagy EG, Jackson RB. The vertical distribution of soil organic carbon and its relation to climate and vegetation. Ecol. Appl. 2000;10:423–436. doi: 10.1890/1051-0761(2000)010[0423:TVDOSO]2.0.CO;2. - DOI

Publication types

LinkOut - more resources