. 2018 Sep 17;9(1):3548.
doi: 10.1038/s41467-018-06023-5.

The complex underpinnings of genetic background effects

Affiliations

The complex underpinnings of genetic background effects

Martin N Mullis et al. Nat Commun. .

Abstract

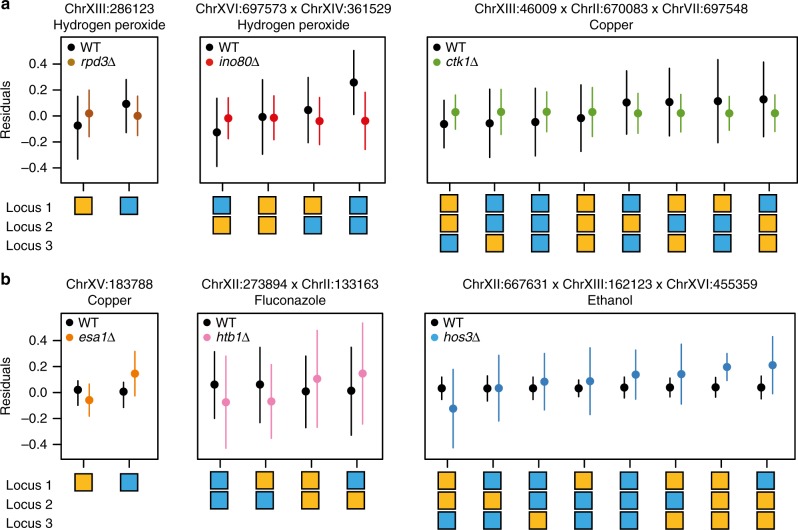
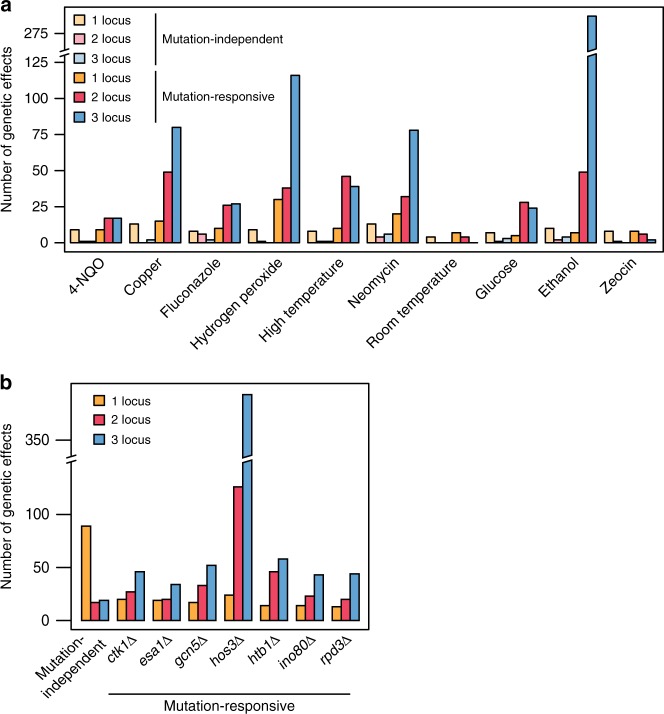
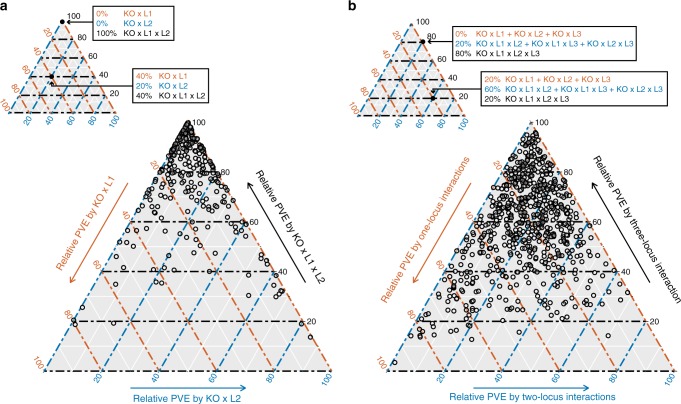
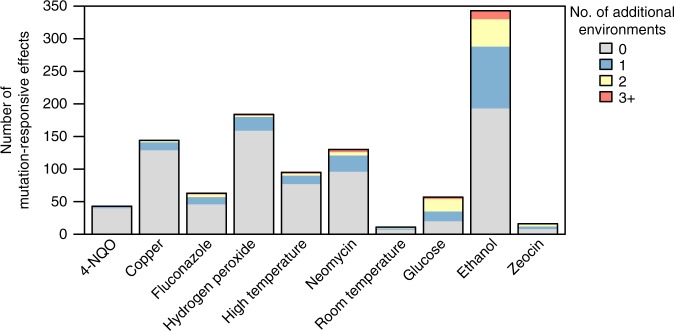
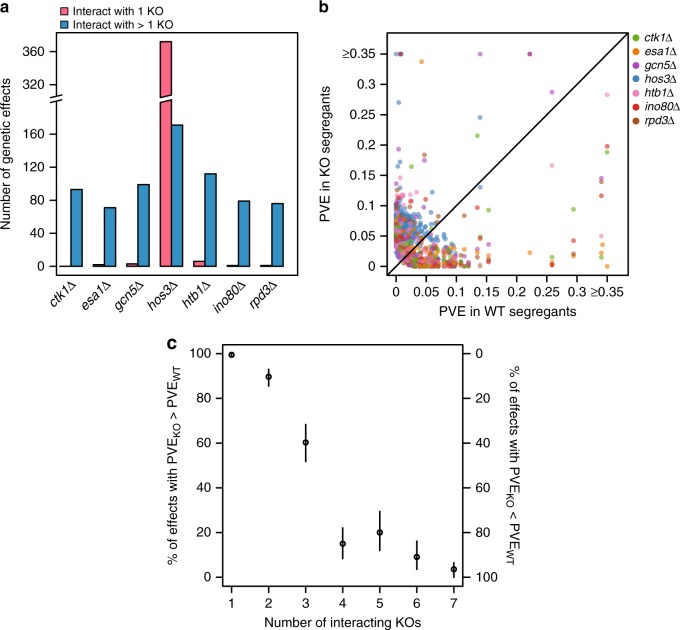
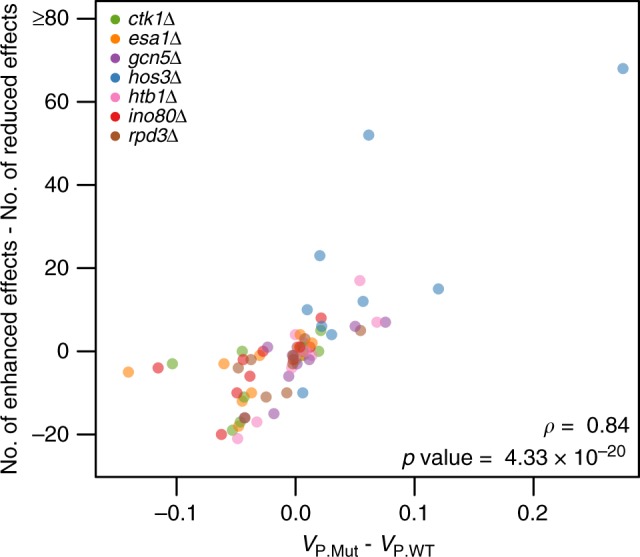
Genetic interactions between mutations and standing polymorphisms can cause mutations to show distinct phenotypic effects in different individuals. To characterize the genetic architecture of these so-called background effects, we genotype 1411 wild-type and mutant yeast cross progeny and measure their growth in 10 environments. Using these data, we map 1086 interactions between segregating loci and 7 different gene knockouts. Each knockout exhibits between 73 and 543 interactions, with 89% of all interactions involving higher-order epistasis between a knockout and multiple loci. Identified loci interact with as few as one knockout and as many as all seven knockouts. In mutants, loci interacting with fewer and more knockouts tend to show enhanced and reduced phenotypic effects, respectively. Cross-environment analysis reveals that most interactions between the knockouts and segregating loci also involve the environment. These results illustrate the complicated interactions between mutations, standing polymorphisms, and the environment that cause background effects.


Conflict of interest statement

The authors declare no competing interests.

Figures

Fig. 1
Fig. 1
Examples of mutation-responsive genetic effects. a shows representative examples of one-, two-, and three-locus mutation-responsive effects with larger phenotypic effects in wild-type segregants than mutants. In contrast, b shows representative examples of one-, two-, and three-locus mutation-responsive effects with larger phenotypic effects in mutants than wild-type segregants. Means depicted along the y axis show residuals from a fixed-effects linear model that includes the mutation-independent effect of each involved locus, as well as any possible lower-order mutation-independent and mutation-responsive effects. The different genotype classes are plotted below the x axis. Blue and orange boxes correspond to the BY and 3S alleles of a locus, respectively. Error bars represent one standard deviation from the mean
Fig. 2
Fig. 2
Most mutation-responsive genetic effects involve multiple loci. In a, the number of mutation-independent and mutation-responsive genetic effects detected in each environment are shown. In b, the aggregate numbers of mutation-responsive effects found for each knockout across the 10 environments are provided
Fig. 3
Fig. 3
Higher-order epistasis among knockouts and multiple loci is an important contributor to background effects. In a, for each mutation-responsive two-locus effect, we partitioned the individual and joint contributions of the two loci. L1 and L2 refer to the involved loci, while KO denotes the relevant knockout. We determined the relative phenotypic variance explained (PVE) by interactions between a knockout and each individual locus (i.e., KO × L1 and KO × L2) and higher-order epistasis involving a knockout and the two loci (i.e., KO × L1 × L2). Similarly, in b, for each mutation-responsive three-locus effect, we determined the relative PVE for all possible mutation-responsive one-, two-, and three-locus effects involving the participating loci. In both a and b, relative PVE values were calculated using sum of squares obtained from ANOVA tables, as described in Methods. Mutation-responsive effects that interact with multiple knockouts are shown multiple times, once for each relevant knockout
Fig. 4
Fig. 4
Analysis of mutation-responsive effects across environments. The height of each stacked bar indicates the number of mutation-responsive effects that were detected in a given environment. The bars are color-coded according to the number of additional environments in which these mutation-responsive effects could be detected when liberal statistical thresholds were employed (Methods)
Fig. 5
Fig. 5
Analysis of mutation-responsive effects across knockout backgrounds. In a, the number of mutation-responsive effects that interacted with only one knockout (pink) or interacted with multiple knockouts (blue) are shown for each knockout. In b, the phenotypic variance explained (PVE) for each mutation-responsive effect is shown in the relevant knockout (KO) segregants, as well as in the wild-type (WT) segregants. The PVE for each mutation-responsive effect was determined using fixed-effects linear models fit within each individual background (Methods). Mutation-responsive effects are color-coded by the knockout population in which they were identified. In c, the percentage of mutation-responsive effects that showed larger phenotypic effects in mutants than in wild-type segregants (y axis, left side) and mutation-responsive effects that showed larger phenotypic effects in wild-type segregants than in mutants (y axis, right side) is depicted. These values are plotted as a function of the number of knockouts that interact with a given mutation-responsive effect. Error bars represent 95% bootstrap confidence intervals (Methods)
Fig. 6
Fig. 6
Mutation-responsive effects underlie differences in phenotypic variance between knockout and wild-type backgrounds across environments. Each point’s position on the x axis represents the difference in phenotypic variance between a knockout background of the cross (VP.Mut) and the wild-type background of the cross (VP.WT) in a single environment. The y axis shows the difference in the number of mutation-responsive effects with enhanced and reduced phenotypic effects. In this paper, we classified mutation-responsive effects as enhanced or reduced based on whether they explained more or less phenotypic variance in mutants relative to wild-type segregants, respectively. Spearman’s ρ and its associated p value are provided on the plot. Colors denote different knockout backgrounds

References

    1. Chandler CH, Chari S, Dworkin I. Does your gene need a background check? How genetic background impacts the analysis of mutations, genes, and evolution. Trends Genet. 2013;29:358–366. doi: 10.1016/j.tig.2013.01.009. - DOI - PMC - PubMed
    1. Nadeau JH. Modifier genes in mice and humans. Nat. Rev. Genet. 2001;2:165–174. doi: 10.1038/35056009. - DOI - PubMed
    1. Chow CY. Bringing genetic background into focus. Nat. Rev. Genet. 2016;17:63–64. doi: 10.1038/nrg.2015.9. - DOI - PubMed
    1. Dowell RD, et al. Genotype to phenotype: a complex problem. Science. 2010;328:469. doi: 10.1126/science.1189015. - DOI - PMC - PubMed
    1. Taylor MB, Ehrenreich IM. Transcriptional derepression uncovers cryptic higher-order genetic interactions. PLoS Genet. 2015;11:e1005606. doi: 10.1371/journal.pgen.1005606. - DOI - PMC - PubMed

Publication types

LinkOut - more resources