. 2018 Sep 17;9(10):935.
doi: 10.1038/s41419-018-0960-8.

Idelalisib promotes Bim-dependent apoptosis through AKT/FoxO3a in hepatocellular carcinoma

Affiliations

Idelalisib promotes Bim-dependent apoptosis through AKT/FoxO3a in hepatocellular carcinoma

Dan Yue et al. Cell Death Dis. .

Retraction in

Abstract

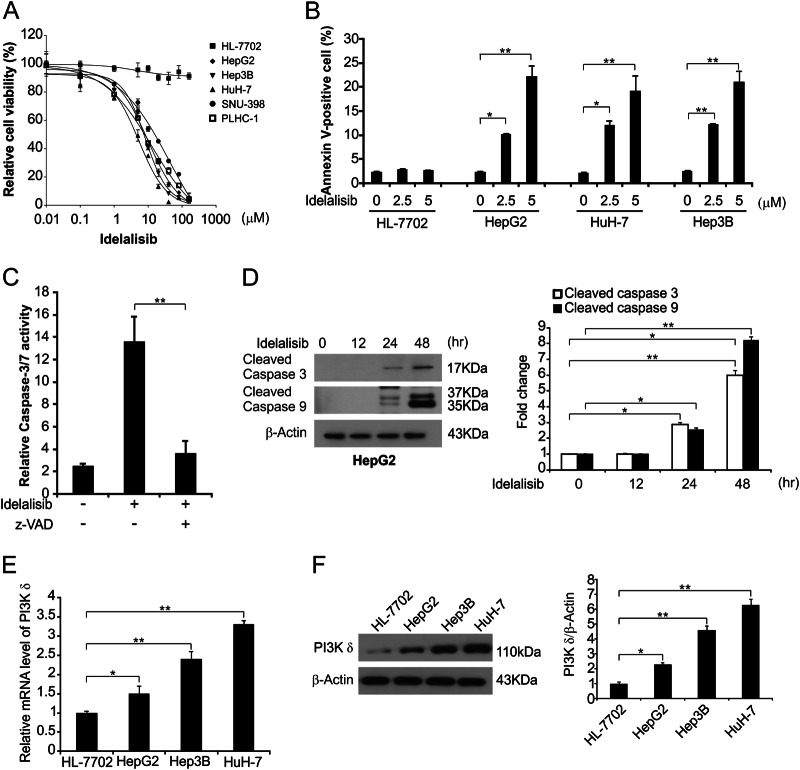
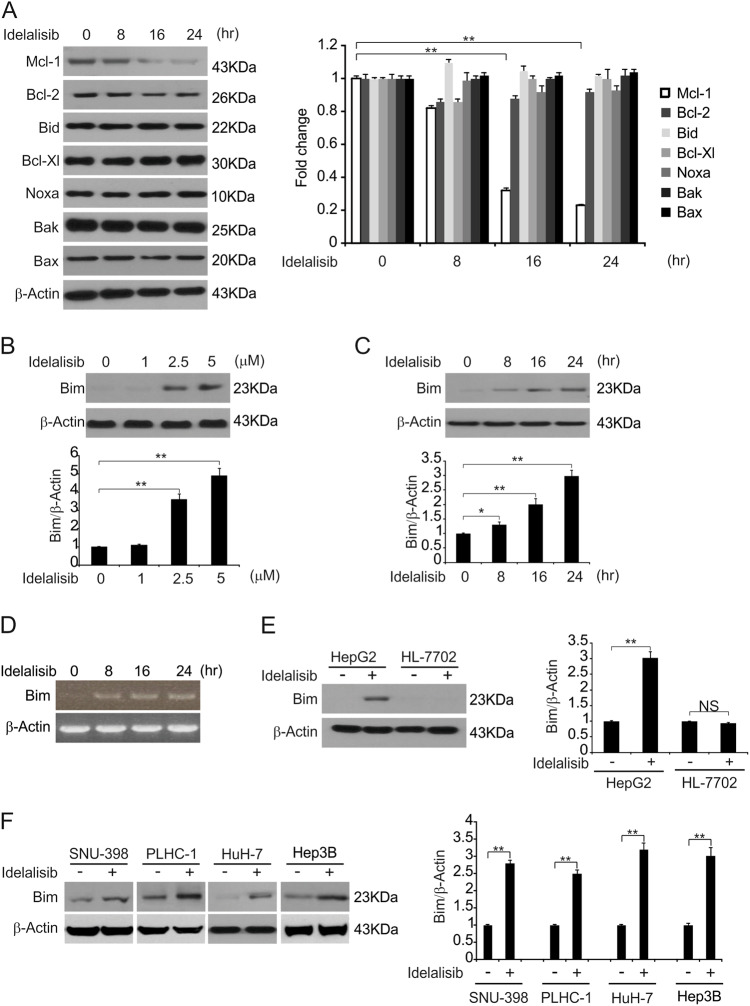
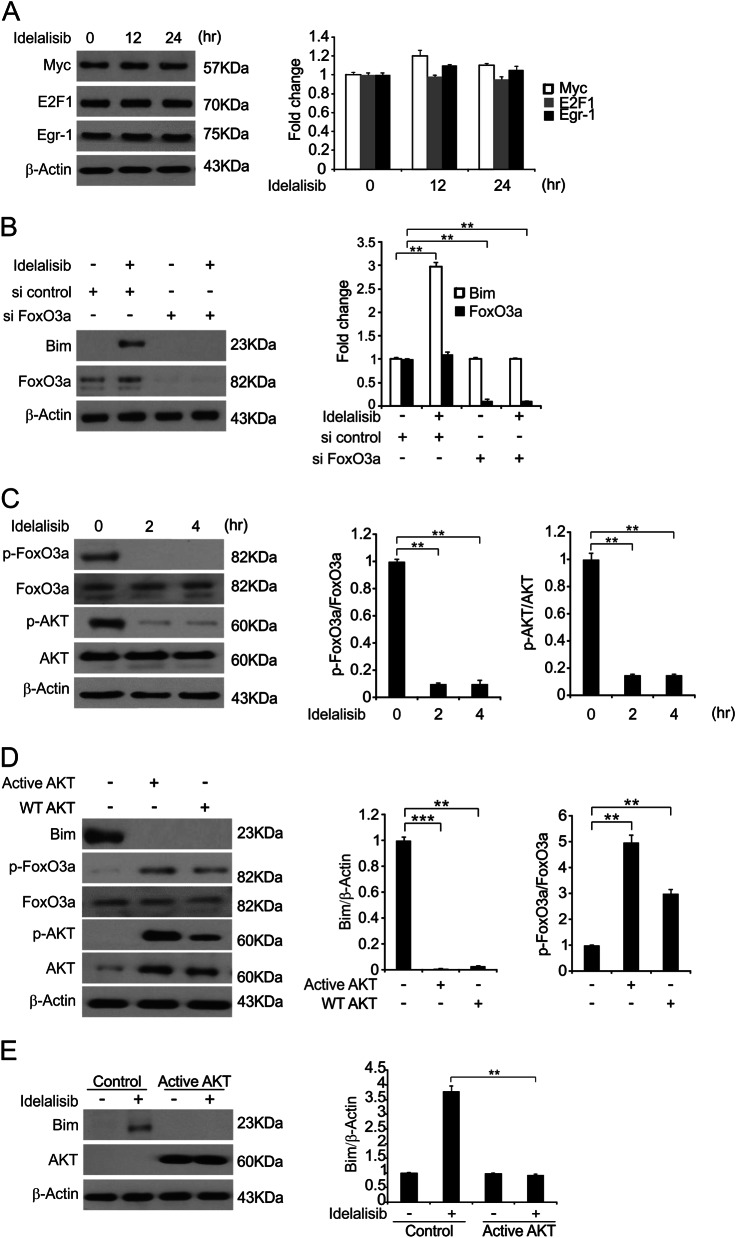
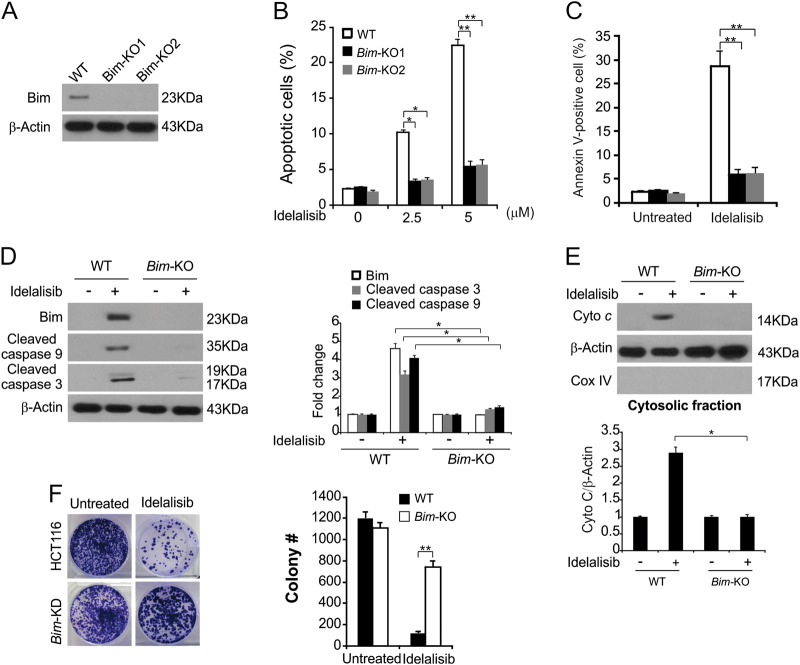
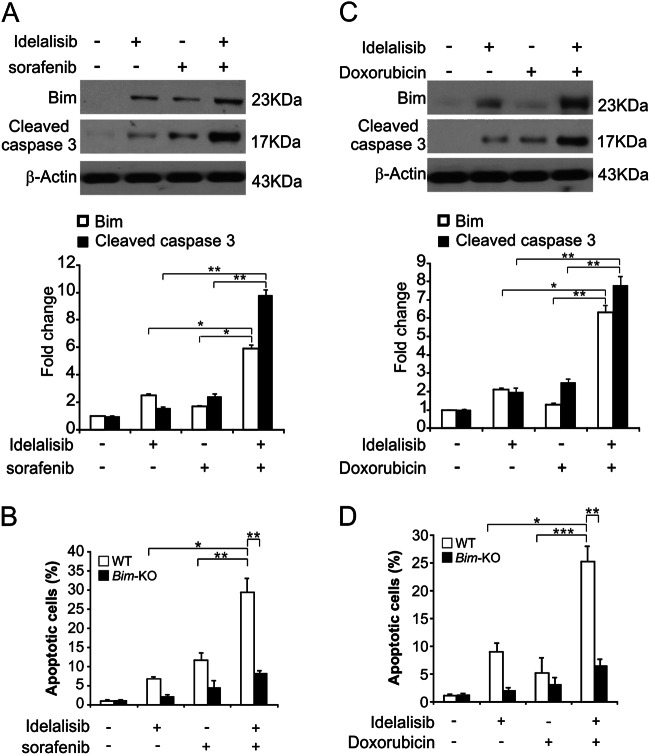
Idelalisib, a selective PI3Kδ inhibitor, has been approved by the FDA for chronic lymphocytic leukemia/small lymphocytic lymphoma treatment and for follicular lymphoma treatment when combined with rituximab. However, the mechanisms of effective action of idelalisib in hepatocellular carcinoma (HCC) remain unclear. In the current study, we aimed to investigate how idelalisib inhibits the growth of HCC cells and enhances the effects of other chemotherapeutic drugs. Our results show that idelalisib treatment promotes Bim induction in HCC via the FoxO3a pathway following PI3K/AKT inactivation. Moreover, our results show that Bim is required for idelalisib-mediated apoptosis in HCC. Idelalisib also synergizes with sorafenib or doxorubicin to induce significant apoptosis in HCC, and Bim is also necessary for the induction of apoptosis by cotreatment. Furthermore, a xenograft experiment reveals that the Bim deficiency abolishes apoptosis and antitumor effects of idelalisib in vivo. In summary, our results indicate a key role of Bim in mediating the antitumor effects of idelalisib in HCC. Our results also support the clinical significance of the drug.


Conflict of interest statement

The authors declare that they have no conflict of interest.

Figures

Fig. 1
Fig. 1. Idelalisib induces apoptosis in HCC.
a The indicated cell lines were treated with increasing concentrations of idelalisib for 72 h. Cell viability was determined by MTS assay. b The indicated cell lines were treated with idelalisib for 24 h at indicated concentrations. Apoptosis was analyzed by Annexin V/PI staining followed by flow cytometry. The results were expressed as the means ± SD of three independent experiments. **P < 0.01; *P < 0.05 (one-way ANOVA with Tukey’s post hoc test). c HepG2 cells were treated with 5 μmol/L idelalisib with or without z-VAD-fmk, and caspase 3/7 activity was determined by fluorogenic analysis. The results were expressed as the means ± SD of three independent experiments. **P < 0.01 (Student’s t test). d HepG2 cells were treated with 5μmol/L idelalisib at indicated time point. Cleaved-caspase 3 and 9 were analyzed by western blotting and normalized to β-actin. Data represent the mean ± SD of three independent experiments. **P < 0.01; *P < 0.05 (one-way ANOVA with Tukey’s post hoc test). e The expression of PI3Kδ was analyzed by real-time PCR in indicated cell lines. The results were expressed as the means ± SD of three independent experiments. **P < 0.01; *P < 0.05 (one-way ANOVA with Tukey’s post hoc test). f The expression of PI3Kδ was analyzed by Western blotting in indicated cell lines and normalized to β-actin. Data represent the mean ± SD of three independent experiments. **P < 0.01; *P < 0.05 (one-way ANOVA with Tukey’s post hoc test)
Fig. 2
Fig. 2. Idelalisib enhances Bim induction in HCC.
a HepG2 cells were treated with 5 μmol/L idelalisib at indicated time points. The expression of indicated Bcl-2 family members was analyzed by western blotting and normalized to β-actin. The data represent the mean ± SD of three independent experiments. **P < 0.01 (one-way ANOVA with Tukey’s post hoc test). b HepG2 cells were treated with idelalisib at indicated concentrations for 24 h. Bim expression was analyzed by western blotting and normalized to β-actin. Data represent the mean ± SD of three independent experiments. **P < 0.01 (one-way ANOVA with Tukey’s post hoc test). c HepG2 cells were treated with 5 μmol/L idelalisib at indicated time points. Bim expression was analyzed by western blotting and normalized to β-actin. The data represent the mean ± SD of three independent experiments. **P < 0.01; *P < 0.05 (one-way ANOVA with Tukey’s post hoc test). d HepG2 cells were treated with 5 μmol/L idelalisib at indicated time points. Total RNA was extracted, and Bim mRNA expression was analyzed by semiquantitative reverse transcription PCR (RT-PCR). β-actin was used as a control. (e) HepG2 and HL-7702 cells were treated with 5 μmol/L idelalisib for 24 h. Bim expression was analyzed by western blotting and normalized to β-actin. Data represent the mean ± SD of three independent experiments. **P < 0.01 (Student’s t-test). f Indicated HCC cell lines were treated with 5 μmol/L idelalisib for 24 h. Bim expression was analyzed by western blotting and normalized to β-actin. Data represent the mean ± SD of three independent experiments. **P < 0.01 (Student’s t-test)
Fig. 3
Fig. 3. FoxO3a mediates idelalisib induced Bim induction.
a HepG2 cells were treated with 5 μmol/L idelalisib at indicated time point. E2F1, Egr-1 and myc expression was analyzed by western blotting and normalized to β-actin. The data represent the mean ± SD of three independent experiments. b HepG2 cells were transfected with either a control scrambled siRNA or a FoxO3a siRNA for 24 h, and then treated with 5 μmol/L idelalisib for 24 h. FoxO3a and Bim expression was analyzed by western blotting and normalized to β-actin. Data represent the mean ± SD of three independent experiments. **P < 0.01 (one-way ANOVA with Tukey’s post hoc test). c HepG2 cells were treated with 5 μmol/L idelalisib for 24 h. Indicated protein expression was analyzed by western blotting and p-FoxO3a normalized to FoxO3a, p-AKT normalized to AKT. The data represent the mean ± SD of three independent experiments. **P < 0.01 (one-way ANOVA with Tukey’s post hoc test). d HepG2 cells were transfected with WT or Active AKT plasmid for 8 h. Indicated protein expression was analyzed by western blotting and Bim was normalized to β-actin, p-FoxO3a was normalized to FoxO3a. The data represent the mean ± SD of three independent experiments. ***P < 0.001; **P < 0.01 (one-way ANOVA with Tukey’s post hoc test). e HepG2 cells were transfected with Active AKT plasmid for 8 h, and then treated with 5 μmol/L idelalisib for 24 h. Indicated protein expression was analyzed by western blotting and Bim was normalized to β-actin. The data represent the mean ± SD of three independent experiments. **P < 0.01 (Student’s t-test)
Fig. 4
Fig. 4. Bim mediates the antitumor effects of idelalisib through the mitochondrial pathway.
a The Bim expression in Bim-KO cells were analyzed by western blotting. b WT and Bim-KO HepG2 cells were treated with idelalisib at indicated concentration for 24 h. Apoptosis was analyzed by a nuclear fragmentation assay. The results were expressed as the means ± SD of three independent experiments. **P < 0.01; *P < 0.05 (one-way ANOVA with Tukey’s post hoc test). c WT and Bim-KO HepG2 cells were treated with 5 μmol/L idelalisib for 24 h. Apoptosis was analyzed by annexin V/PI staining followed by flow cytometry. The results were expressed as the means ± SD of three independent experiments. **P < 0.01 (one-way ANOVA with Tukey’s post hoc test). d WT and Bim-KO HepG2 cells were treated with 5 μmol/L idelalisib for 24 h. Cleaved caspase 3 and 9 expression was analyzed by western blotting and normalized to β-actin. Data represent the mean ± SD of three independent experiments. *P < 0.05 (Student’s t-test). (e) The cytoplasm and mitochondria were fractionated from WT and Bim-KO HepG2 treated with 5 μmol/L idelalisib for 24 h. The distribution of cytochrome c was analyzed by western blotting and normalized to β-actin. Data represent the mean ± SD of three independent experiments. *P < 0.05 (Student’s t test). β-actin and cytochrome oxidase subunit IV (Cox IV) were analyzed as the control for loading and fractionation. f WT and Bim-KO HepG2 cells were treated with 5 μmol/L idelalisib for 24 h. Colony formation assay was done by seeding an equal number of treated cells in 12-well plates, and then staining attached cells with crystal violet 14 days later. Left, representative pictures of colonies; Right, quantification of colony numbers. The results were expressed as the means ± SD of three independent experiments. **P < 0.01 (Student’s t-test)
Fig. 5
Fig. 5. Idelalisib synergizes with sorafenib or doxorubicin to induce apoptosis via Bim in HCC.
a HepG2 cells were treated with 2.5 μmol/L idelalisib, 5 μmol/L sorafenib, or their combination for 24 h. Bim and Cleaved-caspase 3 expression were analyzed by western blotting and normalized to β-actin. The data represent the mean ± SD of three independent experiments. **P < 0.01; *P < 0.05 (one-way ANOVA with Tukey’s post hoc test). b WT and Bim-KO HepG2 cells were treated 2.5 μmol/L idelalisib, 10 μmol/L sorafenib, or their combination for 24 h. Apoptosis was analyzed by a nuclear fragmentation assay. The results were expressed as the means ± SD of three independent experiments. **P < 0.01; *P < 0.05 (Two-way ANOVA with Tukey’s post hoc test). c HepG2 cells were treated with 2.5 μmol/L idelalisib, 5 μmol/L doxorubicin, or their combination for 24 h. Bim and Cleaved-caspase 3 expression were analyzed by western blotting and normalized to β-actin. The data represent the mean ± SD of three independent experiments. **P < 0.01; *P < 0.05 (one-way ANOVA with Tukey’s post hoc test). d WT and Bim-KO HepG2 cells were treated 2.5 μmol/L idelalisib, 5 μmol/L doxorubicin, or their combination for 24 h. Apoptosis was analyzed by a nuclear fragmentation assay. The results were expressed as the means ± SD of three independent experiments. ***P < 0.001**P < 0.01; *P < 0.05 (Two-way ANOVA with Tukey’s post hoc test)
Fig. 6
Fig. 6. Bim mediates the antitumor effects of idelalisib in vivo.
a Nude mice were injected s.c. with 5 × 106 WT and Bim-KO HepG2 cells. After 1 week, mice were treated with 30 mg/kg idelalisib or buffer for 10 consecutive days. Tumor volume at indicated time points after treatment was calculated and plotted (n = 6 in each group), **P < 0.01; *P < 0.05 (Student’s t-test). Arrows indicate idelalisib injection. b Representative tumors at the end of the experiment in (a). c WT HepG2 xenograft tumors were treated with 30 mg/kg idelalisib or the control buffer as in (a) for 4 consecutive days. Phosphor-FoxO3a and Bim in representative tumors were analyzed by western blotting and normalized to β-actin. The data represent the mean ± SD of three independent experiments. **P < 0.01; *P < 0.05 (Student’s t-test). d Paraffin-embedded sections of tumor tissues from mice treated as in (a) were analyzed by TUNEL staining. Left, representative TUNEL staining pictures; Right, TUNEL-positive cells were counted and plotted. e Tissue sections from (D) were analyzed by active caspase 3 staining. Left, representative staining pictures; Right, active caspase 3-positive cells were counted and plotted. The results of (d) and (e) were expressed as the means ± SD of 3 independent experiments. **P < 0.01 (Student’s t-test). Scale bars: 25 μm

References

    1. Waller, L. P., Deshpande, V. & Pyrsopoulos, N. Hepatocellular carcinoma: a comprehensive review. World J. Hepatol.7, 2648–2663 (2015). - DOI - PMC - PubMed
    1. Ghouri, Y. A., Mian, I. & Rowe, J. H. Review of hepatocellular carcinoma: epidemiology, etiology, and carcinogenesis. J. Carcinog.16, 1 (2017). - DOI - PMC - PubMed
    1. Llovet, J. M. et al. Hepatocellular carcinoma. Nat. Rev. Dis. Prim.2, 16018 (2016). - DOI - PubMed
    1. Raza, A. & Sood, G. K. Hepatocellular carcinoma review: current treatment, and evidence-based medicine. World J. Gastroenterol.20, 4115–4127 (2014). - DOI - PMC - PubMed
    1. Tsoulfas, G., Agorastou, P., Tooulias, A. & Marakis, G. N. Current and future challenges in the surgical treatment of hepatocellular carcinoma: a review. Int. Surg.99, 779–786 (2014). - DOI - PMC - PubMed

Publication types

MeSH terms