

Classification and mutation prediction from non-small cell lung cancer histopathology images using deep learning
- PMID: 30224757
- PMCID: PMC9847512
- DOI: 10.1038/s41591-018-0177-5
Classification and mutation prediction from non-small cell lung cancer histopathology images using deep learning
Abstract
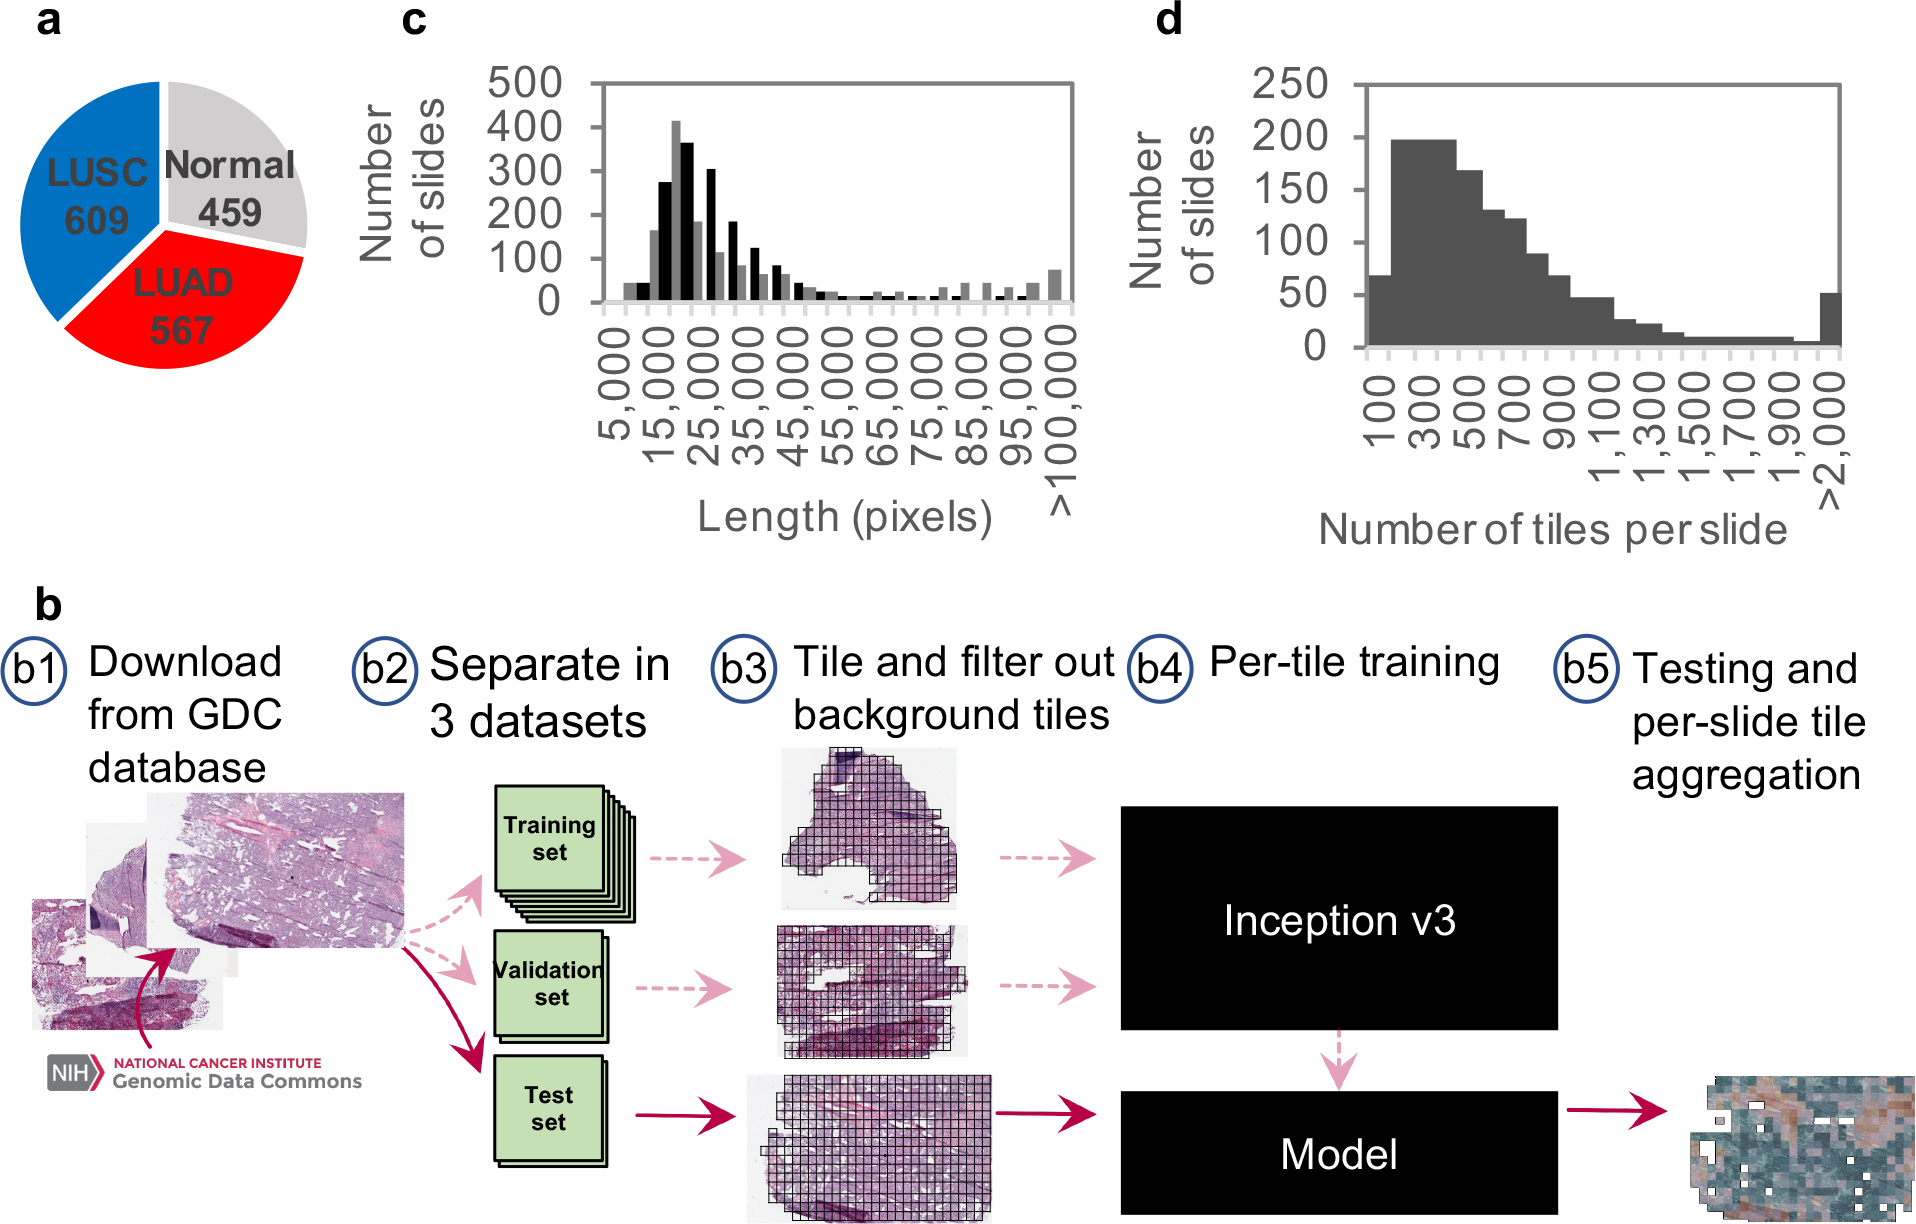
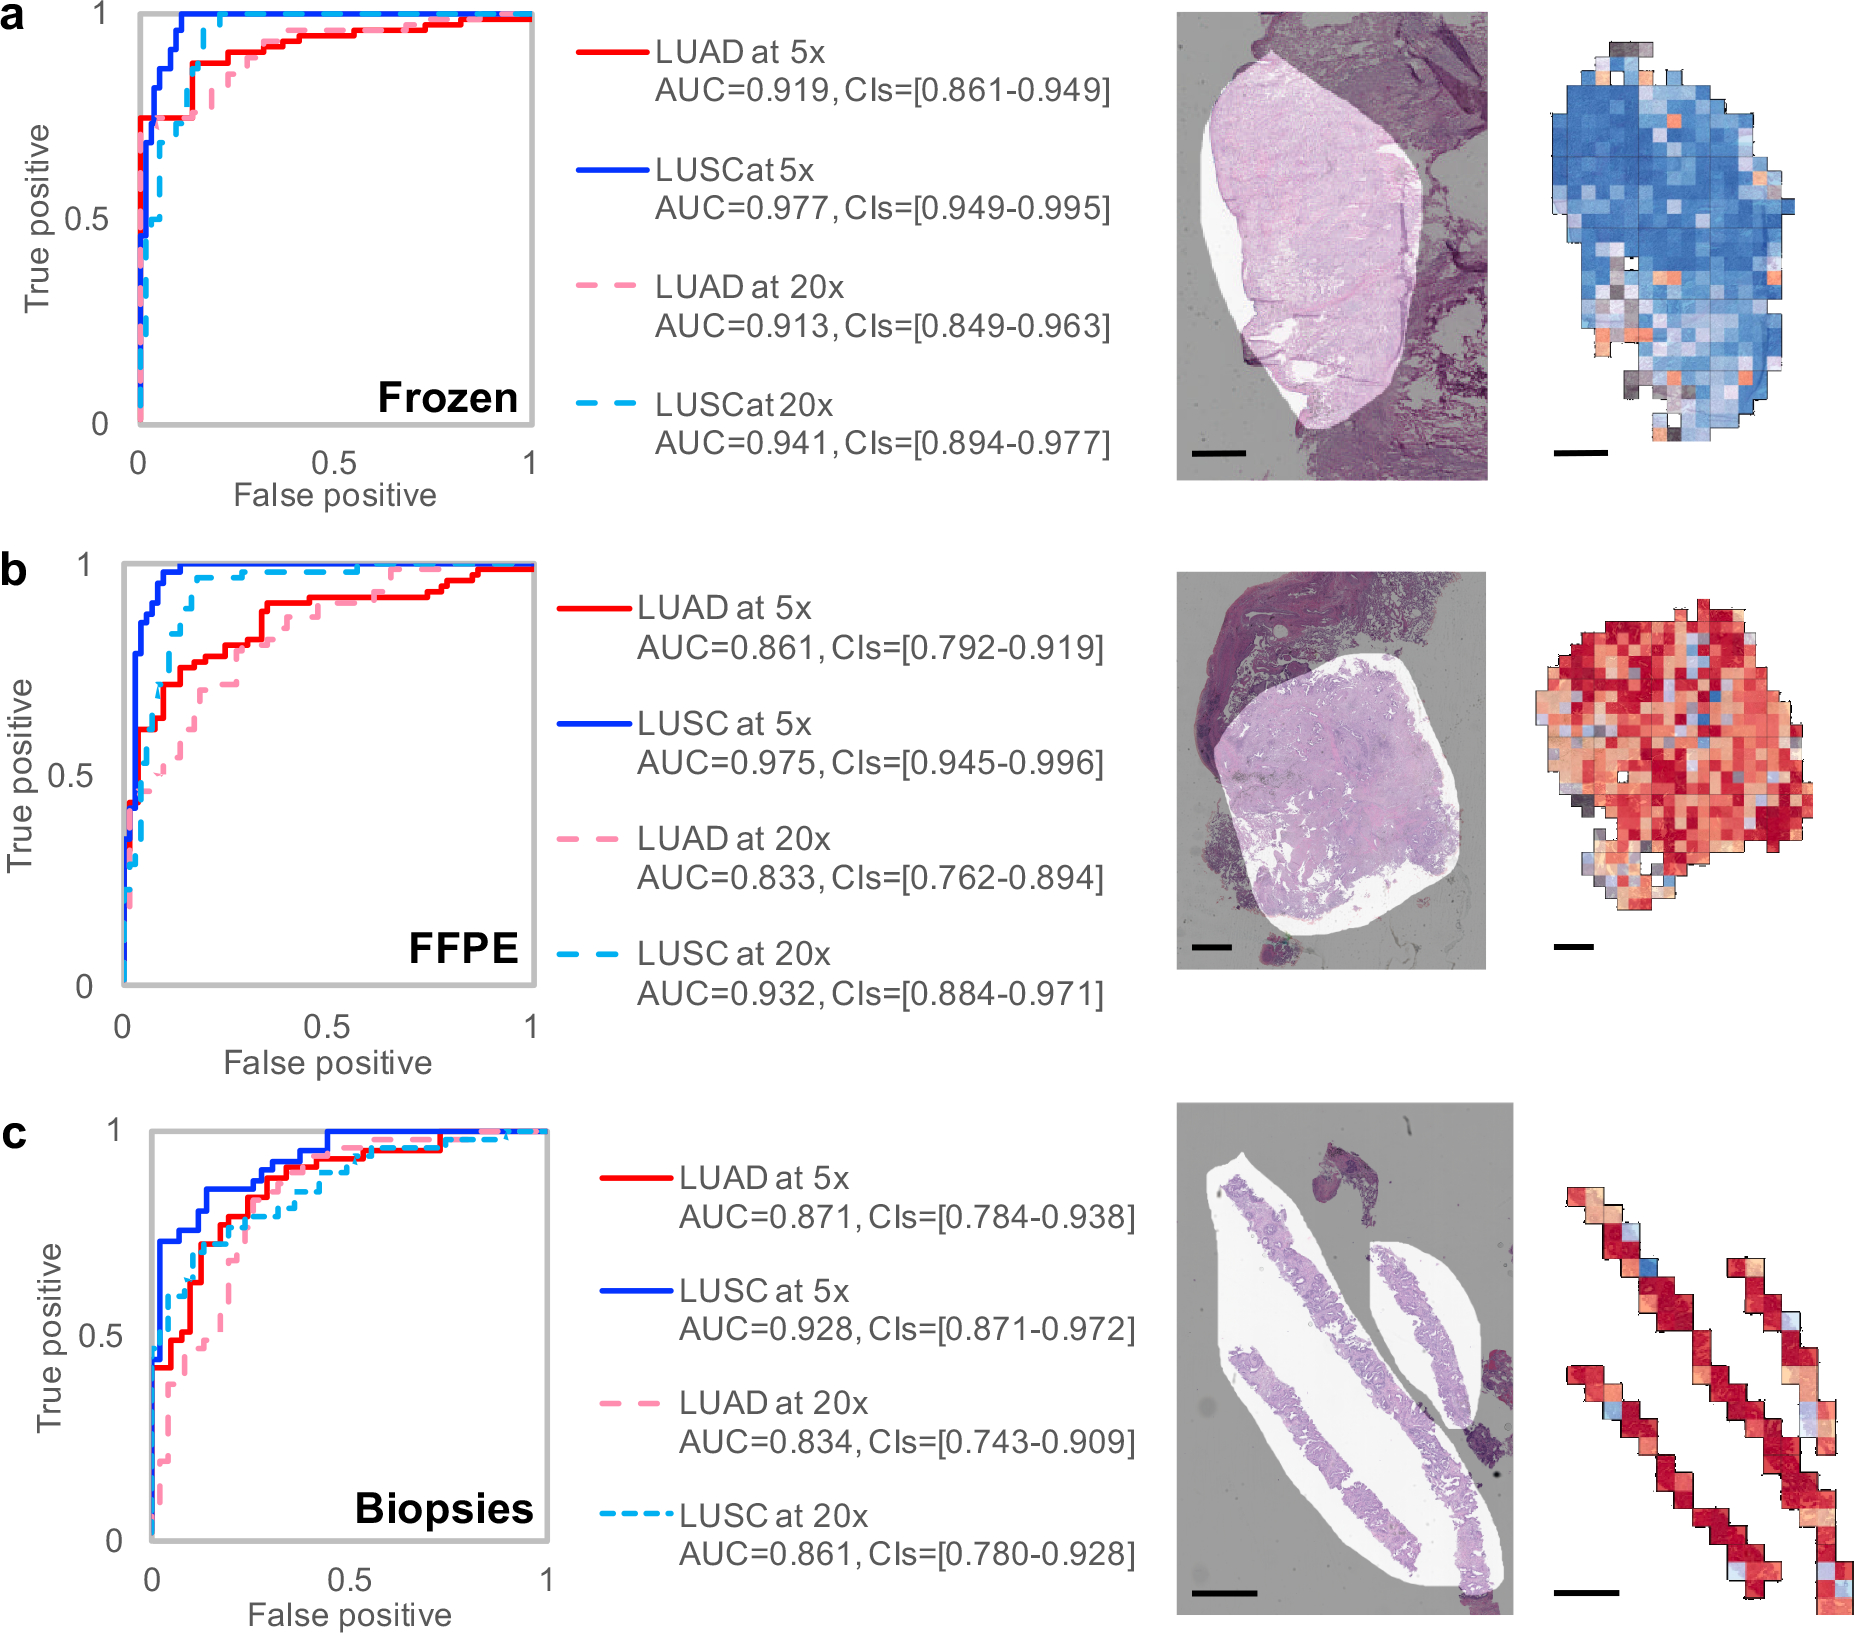
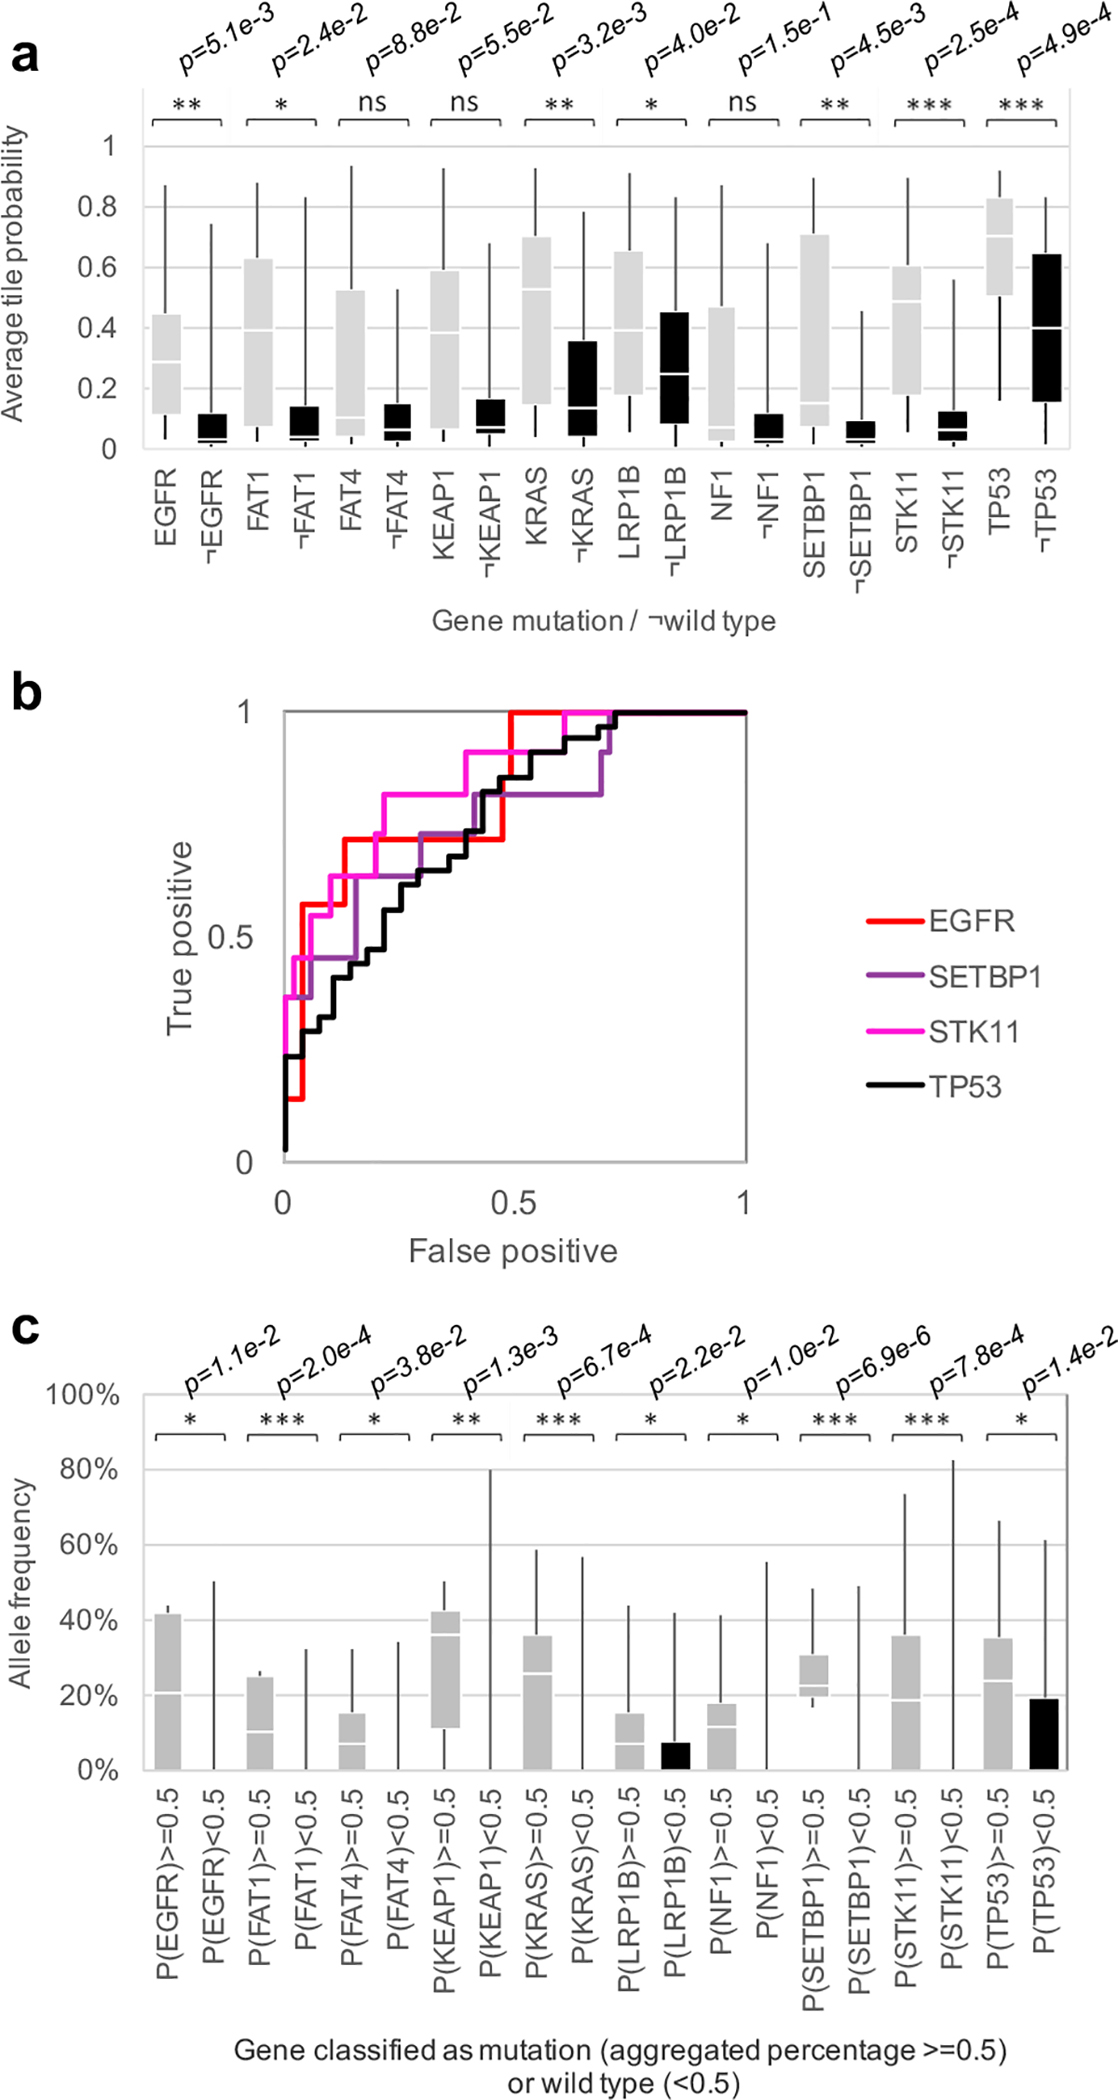
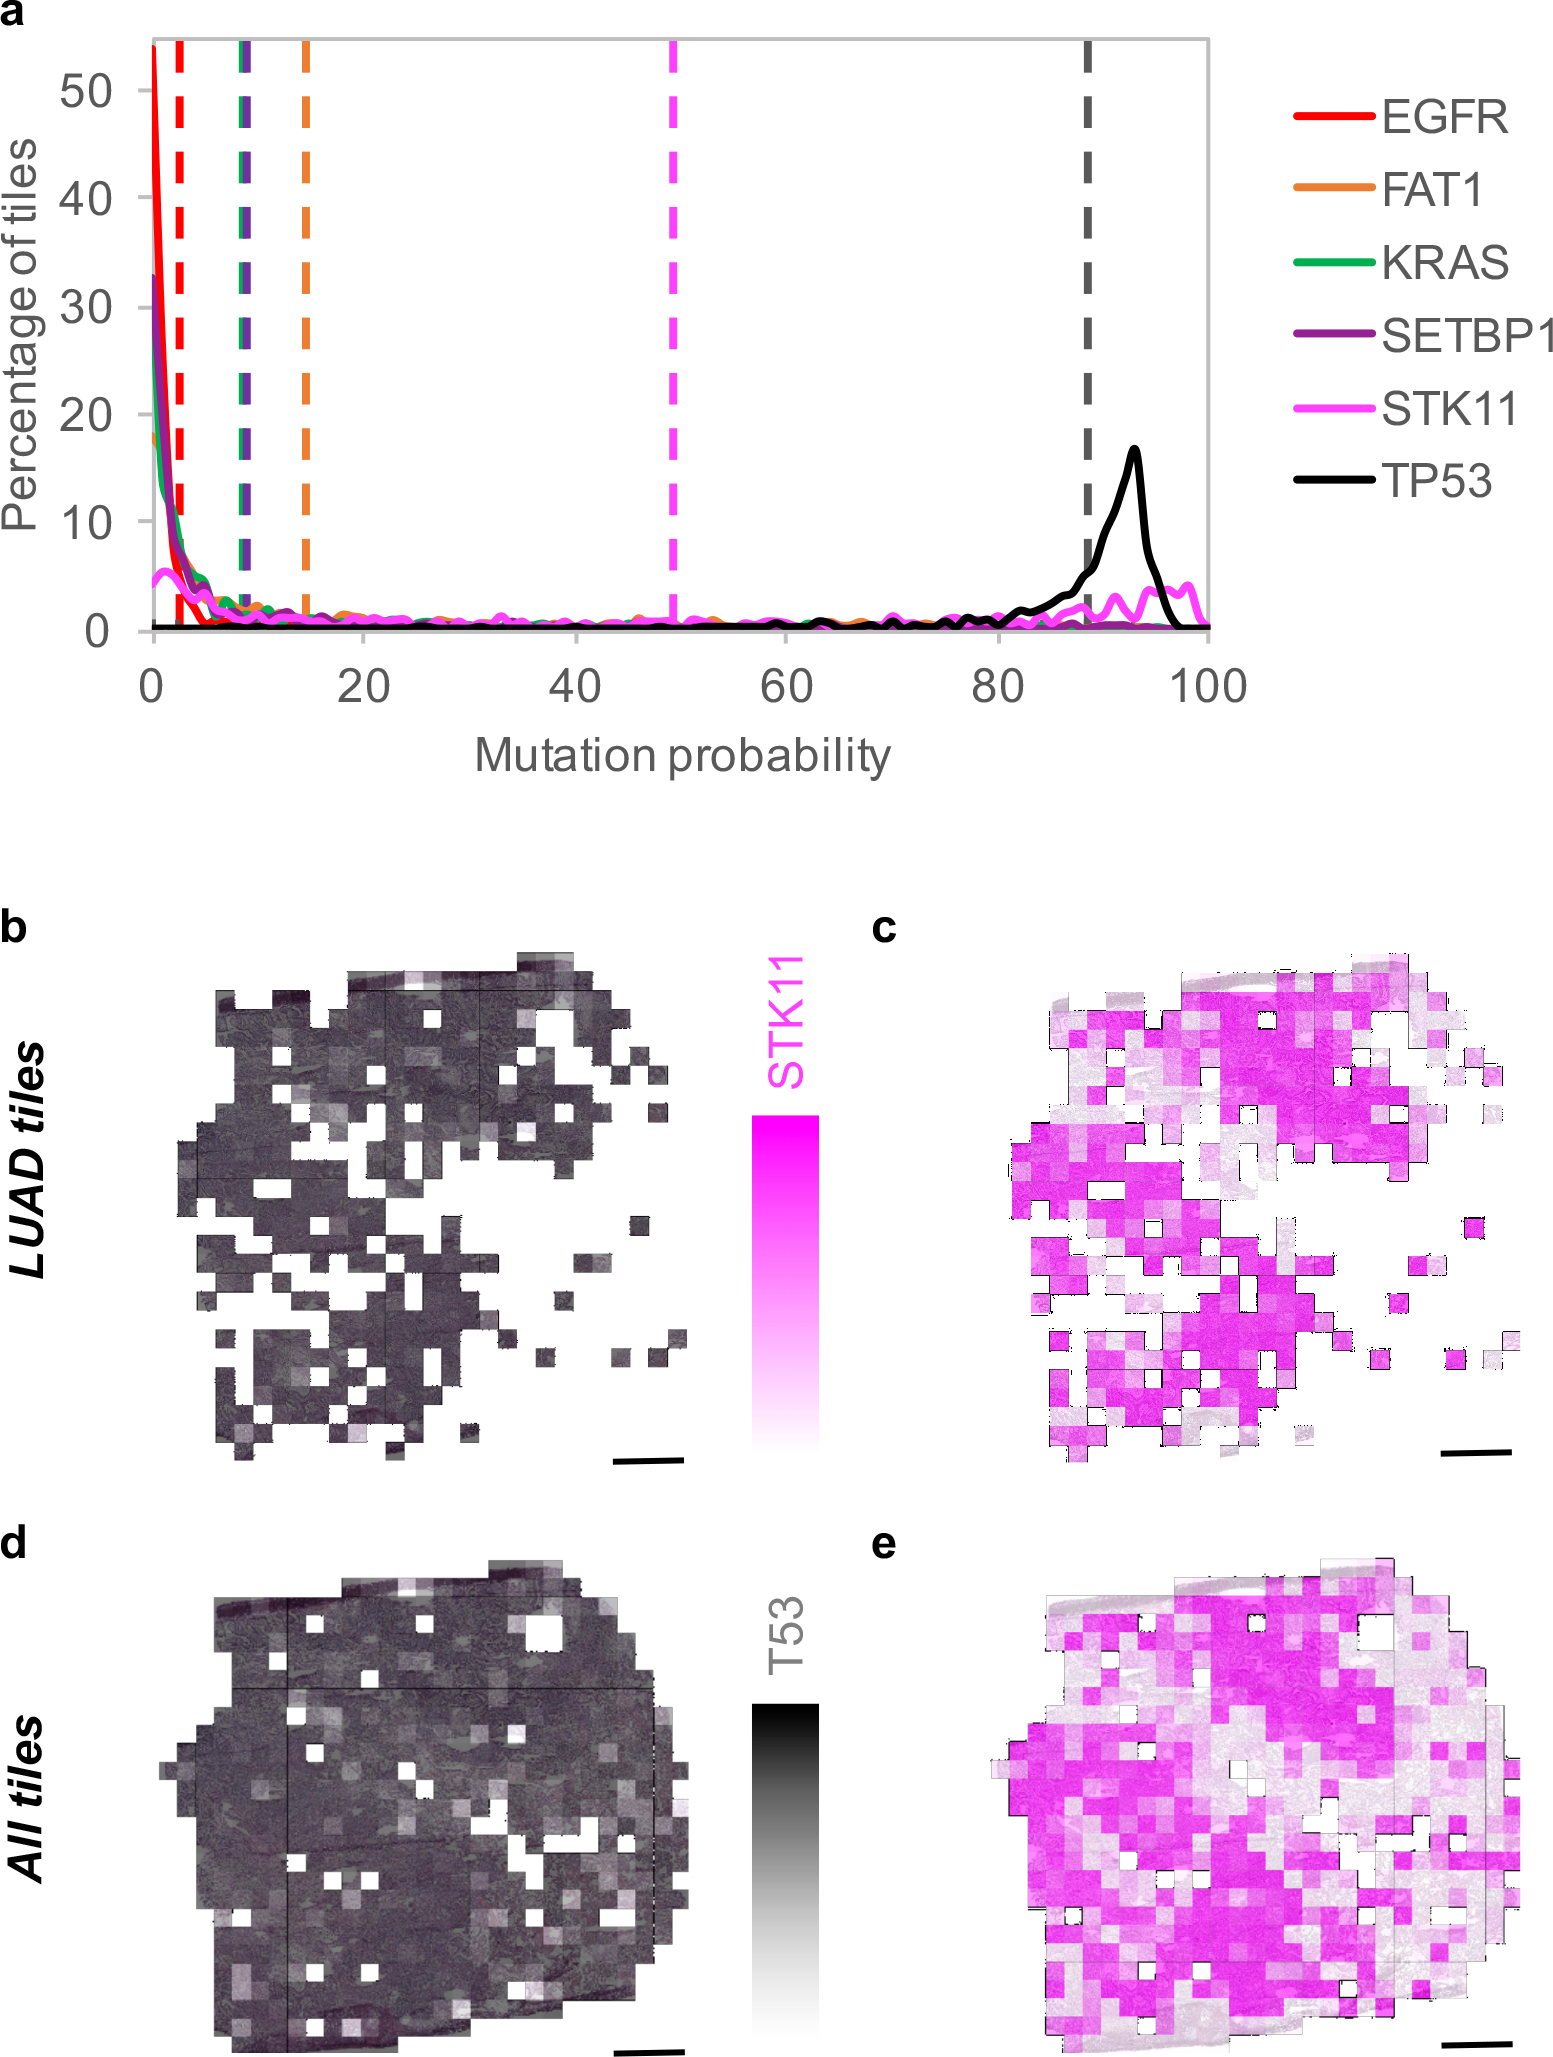
Visual inspection of histopathology slides is one of the main methods used by pathologists to assess the stage, type and subtype of lung tumors. Adenocarcinoma (LUAD) and squamous cell carcinoma (LUSC) are the most prevalent subtypes of lung cancer, and their distinction requires visual inspection by an experienced pathologist. In this study, we trained a deep convolutional neural network (inception v3) on whole-slide images obtained from The Cancer Genome Atlas to accurately and automatically classify them into LUAD, LUSC or normal lung tissue. The performance of our method is comparable to that of pathologists, with an average area under the curve (AUC) of 0.97. Our model was validated on independent datasets of frozen tissues, formalin-fixed paraffin-embedded tissues and biopsies. Furthermore, we trained the network to predict the ten most commonly mutated genes in LUAD. We found that six of them-STK11, EGFR, FAT1, SETBP1, KRAS and TP53-can be predicted from pathology images, with AUCs from 0.733 to 0.856 as measured on a held-out population. These findings suggest that deep-learning models can assist pathologists in the detection of cancer subtype or gene mutations. Our approach can be applied to any cancer type, and the code is available at https://github.com/ncoudray/DeepPATH .
Conflict of interest statement
Competing Financial Interests Statement
The authors declare no competing interests.
Figures
Comment in
-
AI to assess images.Nat Rev Clin Oncol. 2018 Dec;15(12):724. doi: 10.1038/s41571-018-0107-y. Nat Rev Clin Oncol. 2018. PMID: 30266916 No abstract available.
-
The promise and challenges of deep learning models for automated histopathologic classification and mutation prediction in lung cancer.J Thorac Dis. 2019 Feb;11(2):369-372. doi: 10.21037/jtd.2018.12.55. J Thorac Dis. 2019. PMID: 30962976 Free PMC article. No abstract available.
References
-
- Hanna N et al. Systemic therapy for stage IV non–small-cell lung cancer: American Society of Clinical Oncology clinical practice guideline update. Journal of Clinical Oncology 35, 3484–3515 (2017). - PubMed
-
- Parums DV Current status of targeted therapy in non-small cell lung cancer. Drugs Today (Barc). 50, 503–525 (2014). - PubMed
-
- Terra SB et al. Molecular characterization of pulmonary sarcomatoid carcinoma: analysis of 33 cases. Modern Pathology 29, 824–831 (2016). - PubMed
Methods-Only References
-
- Hanley JA & McNeil BJ The meaning and use of the area under a receiver operating characteristic (ROC) curve. Radiology 143, 29–36 (1982). - PubMed
-
- Pedregosa F et al. Scikit-learn: Machine Learning in Python. Journal of Machine Learning Research 12, 2825–2830 (2011).
-
- Efron B & Tibshirani RJ An introduction to the bootstrap. Vol. 56 (1994).
Publication types
MeSH terms
Substances
Grants and funding
LinkOut - more resources
Full Text Sources
Other Literature Sources
Medical
Research Materials
Miscellaneous
