. 2018 Oct;24(10):1599-1610.
doi: 10.1038/s41591-018-0158-8. Epub 2018 Sep 17.

Transcriptional addiction in cancer cells is mediated by YAP/TAZ through BRD4

Affiliations

Transcriptional addiction in cancer cells is mediated by YAP/TAZ through BRD4

Francesca Zanconato et al. Nat Med. 2018 Oct.

Abstract

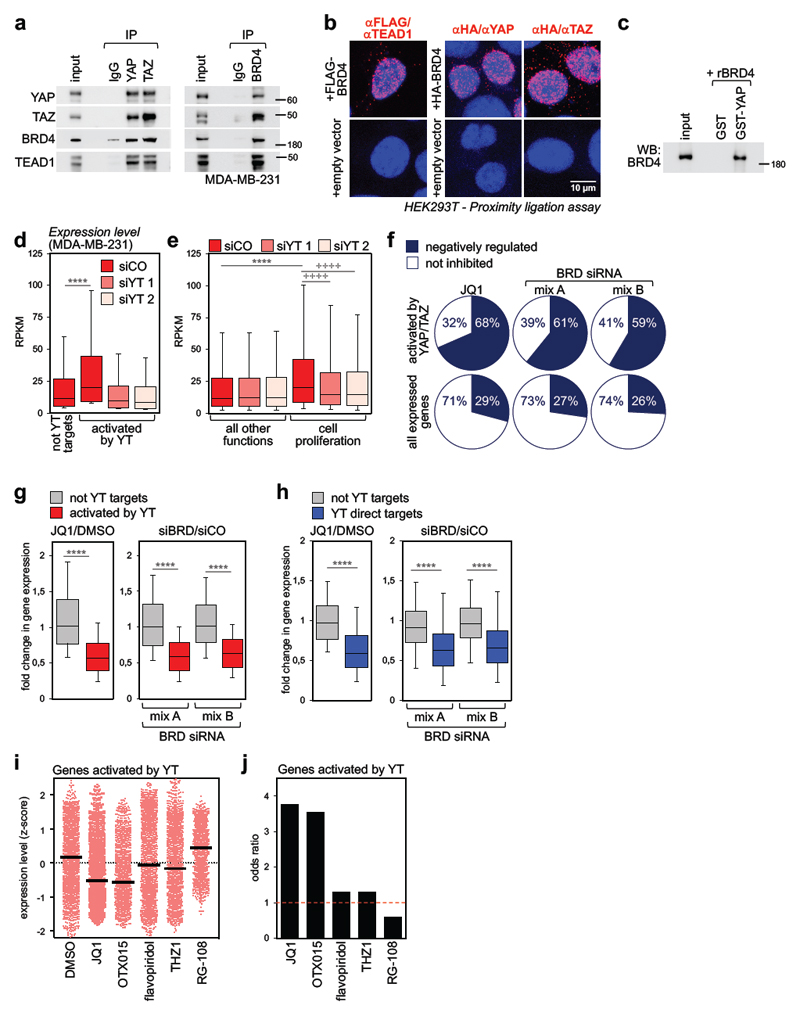
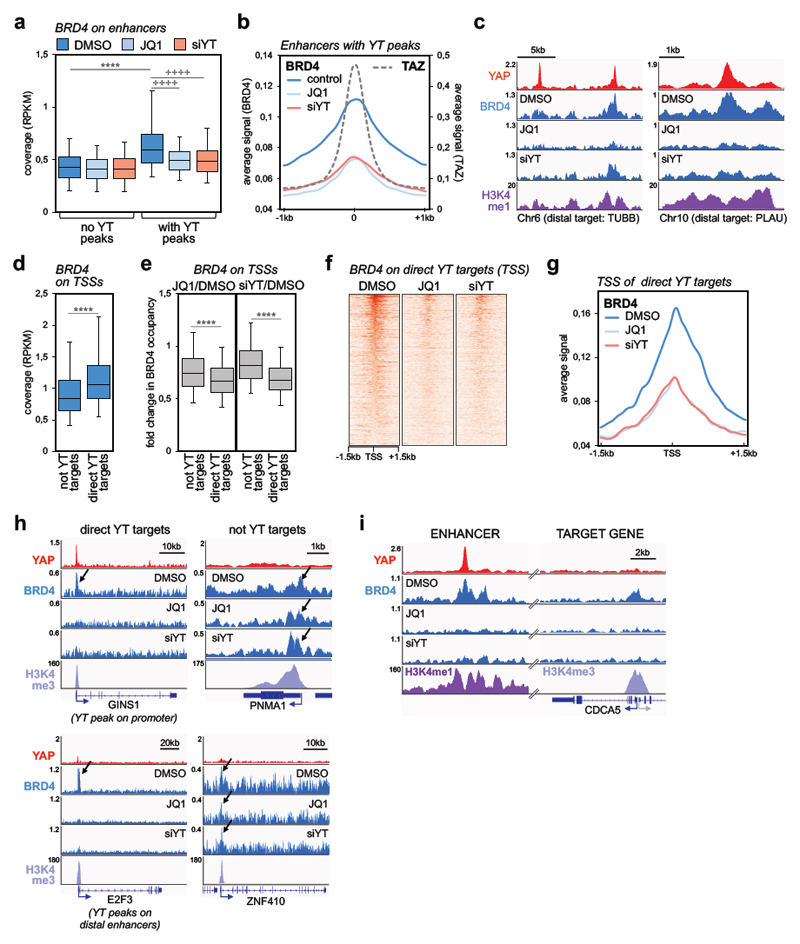
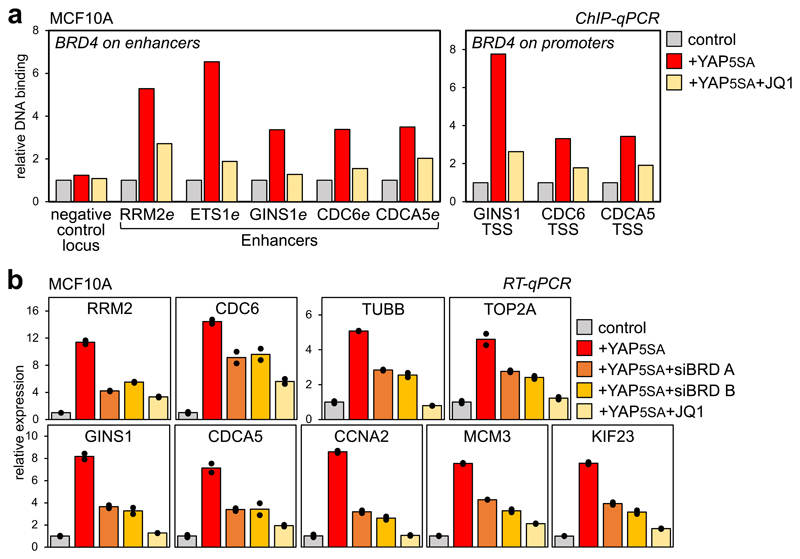
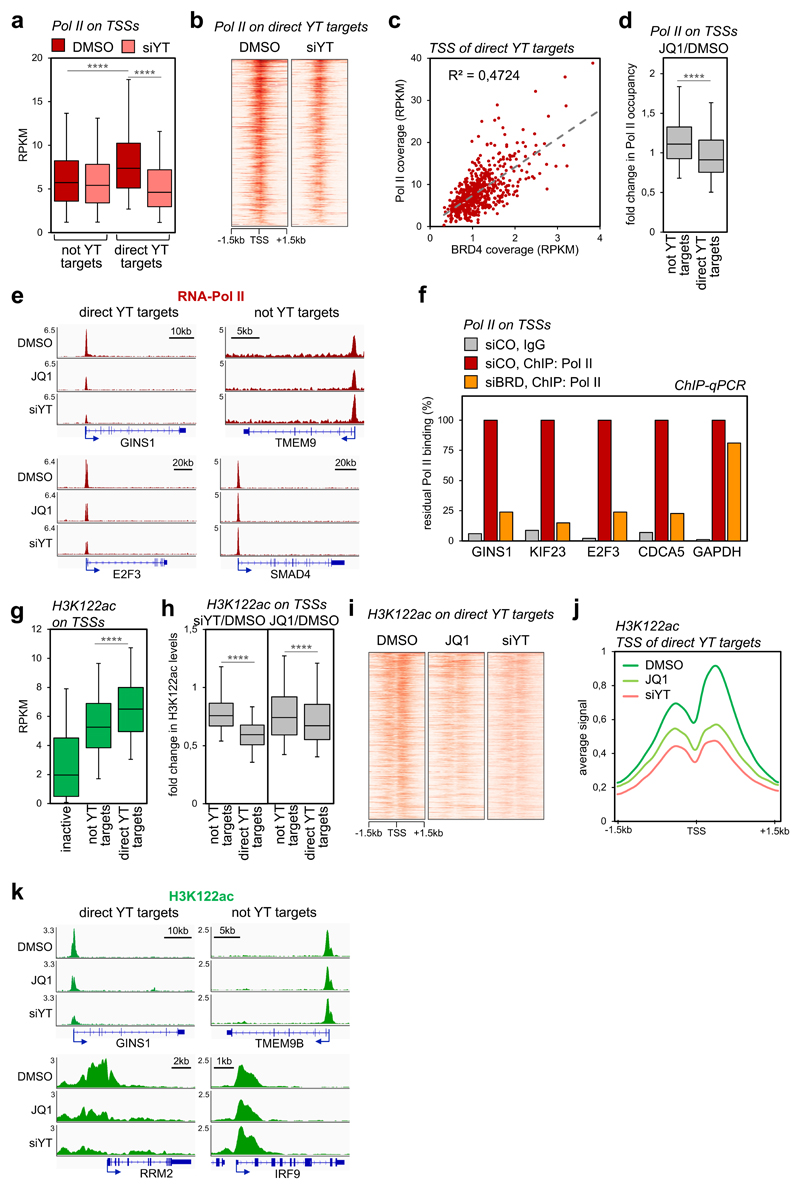
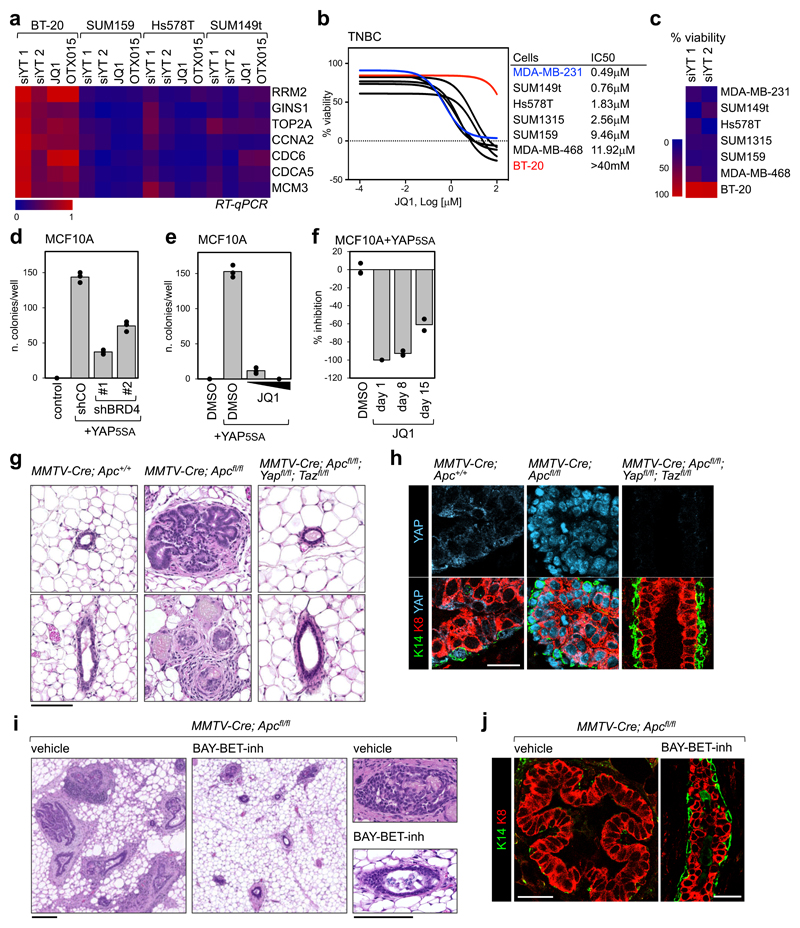
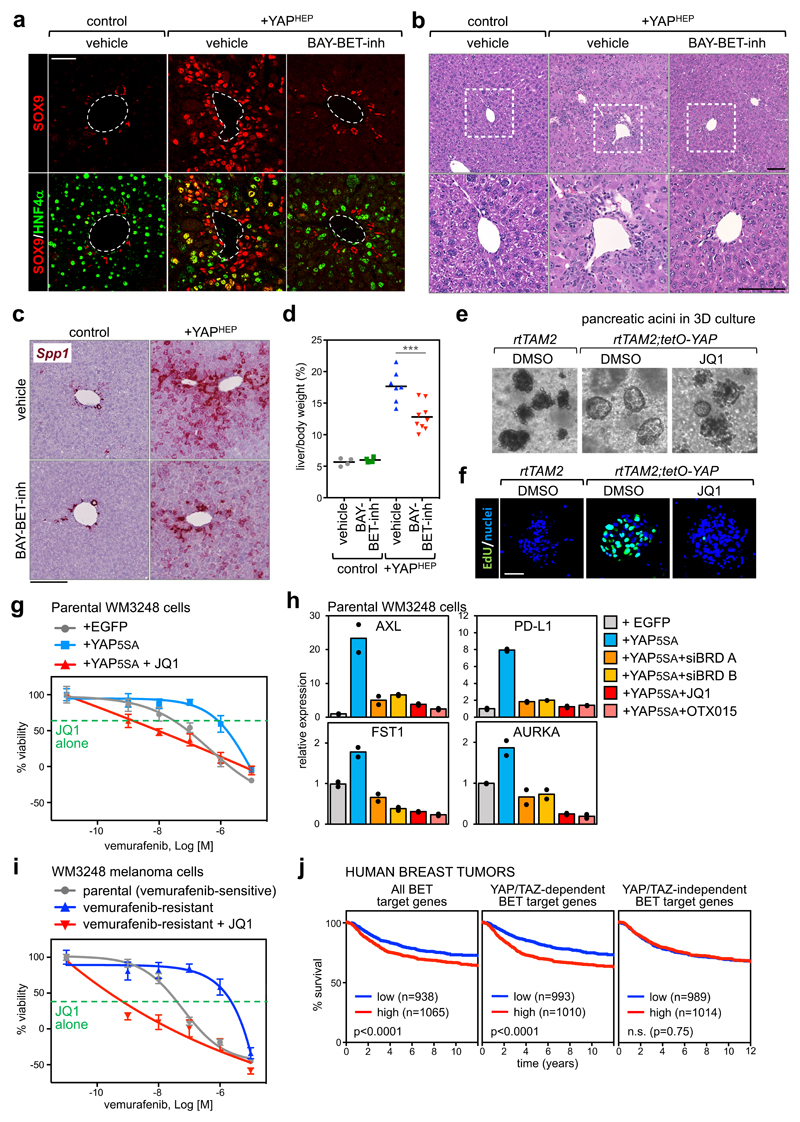
Cancer cells rely on dysregulated gene expression. This establishes specific transcriptional addictions that may be therapeutically exploited. Yet, the mechanisms that are ultimately responsible for these addictions are poorly understood. Here, we investigated the transcriptional dependencies of transformed cells to the transcription factors YAP and TAZ. YAP/TAZ physically engage the general coactivator bromodomain-containing protein 4 (BRD4), dictating the genome-wide association of BRD4 to chromatin. YAP/TAZ flag a large set of enhancers with super-enhancer-like functional properties. YAP/TAZ-bound enhancers mediate the recruitment of BRD4 and RNA polymerase II at YAP/TAZ-regulated promoters, boosting the expression of a host of growth-regulating genes. Treatment with small-molecule inhibitors of BRD4 blunts YAP/TAZ pro-tumorigenic activity in several cell or tissue contexts, causes the regression of pre-established, YAP/TAZ-addicted neoplastic lesions and reverts drug resistance. This work sheds light on essential mediators, mechanisms and genome-wide regulatory elements that are responsible for transcriptional addiction in cancer and lays the groundwork for a rational use of BET inhibitors according to YAP/TAZ biology.


Conflict of interest statement

Competing Financial Interest: BH and PL are employees of Bayer AG. SP is a consultant for and received institutional grants from Bayer AG.

Figures

Figure 1
Figure 1. BRD4 associates to YAP/TAZ and is a required cofactor for YAP/TAZ transcriptional activity
a) Interaction of endogenous YAP/TAZ, TEAD1 and BRD4 in MDA-MB-231 cells. Each co-IP experiment was performed three times with similar results. b) Endogenous YAP, TAZ or TEAD1 and exogenous FLAG- or HA-BRD4 interact in the nuclei of HEK293T cells, as shown by PLA signal (red fluorescent dots). Nuclei are counterstained with DAPI (blue). No dots could be detected in the nuclei of cells transfected with empty vector, confirming the specificity of interactions. Similar results were obtained in two additional experiments. c) Recombinant BRD4 is pulled-down by GST-YAP fusion protein. GST-pulldown was repeated three times with similar results. d) Genes activated by YAP/TAZ (n=2073) display higher expression levels compared to genes not activated by YAP/TAZ (not YT targets, n=8026) in MDA-MB-231 cells. Expression values (in RPKM) were determined by RNA-seq and are presented as box-and-whiskers plots (whiskers extend from the 10th to the 90th percentile; the box extends from the 25th to the 75th percentile; the line within the box represents the median). **** p<10-10 (one-tailed Mann-Whitney U test). See also Supplementary Fig. 1g. e) Box-and-whiskers plots of expression values of genes involved in cell proliferation (n=1449) vs. genes associated to all other functions (n=8650) according to GO annotation. Data are presented as in d. **** p<10-10 (one-tailed Mann-Whitney U test); ++++ p<10-10 (one-tailed Wilcoxon matched-pairs signed rank test) f) The fraction of genes activated by YAP/TAZ which are inhibited by JQ1 or BRD2/3/4 siRNAs is larger than the fraction of all expressed genes downregulated by the same treatments. See also Supplementary Fig. 1i. g) Fold change in gene expression of not-YAP/TAZ targets (n=8026) vs. genes activated by YAP/TAZ (n=2073) upon treatment with JQ1 (left) or BET proteins depletion (right). The y axis shows the fold change in transcript levels versus DMSO-treated cells or cells transfected with control siRNA. Data are presented as box-and-whiskers plots, as in d. **** p<10-10 (one-tailed Mann-Whitney U test) h) Fold change in gene expression of high-confidence YAP/TAZ direct targets (n=616) vs. not-YAP/TAZ targets (n=771) upon treatment with JQ1 (left) or BET proteins depletion (right). The group of not YT targets represents genes not significantly affected by YAP/TAZ depletion (FDR>0.05) in our RNA-seq dataset. Data are presented as box-and-whiskers plots, as in d. **** p<10-10 (one-tailed Mann-Whitney U test) i) Expression level of all YAP/TAZ activated genes (n=2073) in MDA-MB-231 cells treated with DMSO (vehicle), BET inhibitors (JQ1, OTX015), CDKs inhibitors (flavopiridol, THZ1) or RG-108 (a DNA methyltransferase inhibitor, here used as negative control to assess the effect of a compound targeting an epigenetic function not related to transcription). Expression levels were determined by RNA-seq and are presented as z-scores. Individual genes and their mean (black line) are presented. j) Odds ratio plot: genes activated by YAP/TAZ (n=2073) are more likely to be inhibited by BET inhibitors than not-YAP/TAZ target genes. CDK inhibitors and RG-108 do not display such property (see Methods).
Figure 2
Figure 2. YAP/TAZ are required for BRD4 recruitment to chromatin.
a) Comparison of BRD4 ChIP-seq signal (expressed as normalized read density, RPKM) in active enhancers with or without YAP/TAZ peaks (n=5169 and n=30281, respectively) in MDA-MB-231 cells treated with DMSO or JQ1 (1µM, 6h), or transfected with YAP/TAZ siRNAs (48h). Data are presented as box-and-whiskers plots (whiskers extend from the 5th to the 95th percentile; the box extends from the 25th to the 75th percentile; the line within the box represents the median). **** p<10-10 (one-tailed Mann-Whitney U test); ++++ p<10-10 (one-tailed Wilcoxon matched-pairs signed rank test) b) Average signal of BRD4 ChIP-seq reads in enhancers with YAP/TAZ peaks (n=5169) in a window of ±1 kb centered on the summit of YAP/TAZ peaks. c) Genome browser view of YAP, BRD4 and H3K4me1 binding profiles at representative active enhancers in MDA-MB-231 cells. Both JQ1 and YAP/TAZ siRNA induce a strong decrease in BRD4 binding. d) Box plot of BRD4 ChIP-seq signal (RPKM) comparing promoters of genes not activated by YAP/TAZ (n=8026) or of YAP/TAZ target genes (YT targets, n=616) in MDA-MB-231 cells (treated with DMSO). Data are presented as in a. **** p<10-10 (one-tailed Mann-Whitney U test) e) Treatment with JQ1 (left) and YAP/TAZ depletion (right) induce preferential loss of BRD4 at promoters of YAP/TAZ target genes (n=616) vs. promoters of not YAP/TAZ targets (n=8026). Fold change in BRD4 binding is calculated as RPKM(JQ1 or siYT)/RPKM(DMSO). Data are presented as box-and-whiskers plots (whiskers extend from the 5th to the 95th percentile; the box extends from the 25th to the 75th percentile; the line within the box represents the median). **** p<10-10 (one-tailed Mann-Whitney U test) f) Heatmap showing BRD4 binding on the promoters of YAP/TAZ targets in MDA-MB-231 cells, in a window of ±1.5kb centered on the transcription start site (TSS). g) Average signal of BRD4 ChIP-seq reads on the promoters of YAP/TAZ target genes (n=616) in MDA-MB-231 cells, in a window of ±1.5 kb centered on TSS. h) YAP, BRD4 and H3K4me3 binding profiles at representative promoters of YAP/TAZ target genes or not-YAP/TAZ targets. Arrows indicate BRD4 enrichment at the TSS. JQ1 and siYAP/TAZ induce a strong decrease in BRD4 binding on YAP/TAZ targets, whereas there is no overt variation of BRD4 binding on the TSS of not YAP/TAZ targets. GINS1 exemplifies direct YAP/TAZ target genes with YAP/TAZ binding sites in both enhancers and the TSS; E2F3 exemplifies direct YAP/TAZ target genes regulated by YAP/TAZ exclusively from distal enhancers. i) YAP, BRD4 and H3K4me1/H3K4me3 binding profiles on a distal enhancer and on CDCA5 promoter. JQ1 (1µM, 6h) and siYAP/TAZ (48h) induce a strong decrease in BRD4 binding both on the enhancer, containing YAP/TAZ peak, and on TSS of CDCA5.
Figure 3
Figure 3. YAP/TAZ are instrumental for BRD4 recruitment to chromatin
a) ChIP-qPCR showing increased BRD4 binding on enhancers and promoters of YAP/TAZ targets upon YAP5SA overexpression in MCF10A cells, but not in the presence of JQ1 (1µM, 6h). ChIP with pre-immune IgG displayed background signal (which was comparable in all samples). DNA enrichment was calculated as fraction of input and is presented as fold vs. BRD4 binding in control cells. b) RT-qPCR for representative YAP/TAZ target genes showing upregulation upon YAP5SA overexpression in MCF10A cells, but not in the presence of JQ1 (1µM, 24h) or upon depletion of BRD2/3/4 (siBRD mix A and B). Data are presented as individual data points (n=2 biologically independent samples) + average (bar), from one out of three experiments, all producing similar results. BET inhibition does not impair the expression of exogenous YAP (see Supplementary Fig. 3e).
Figure 4
Figure 4. YAP/TAZ and BRD4 regulate Pol II loading and H3K122 acetylation on TSSs.
a) Box-and whiskers plots showing the distribution of RNA-Pol II ChIP-seq signal (expressed as normalized read density, RPKM) comparing promoters of genes not activated by YAP/TAZ (n=8026) or of YAP/TAZ target genes (n=616) in control (DMSO) or YAP/TAZ depleted cells. The box includes values within the 25th and 75th percentile (with the median highlighted by the line in the middle) and whiskers extend from the 5th to the 95th percentile. **** p<10-10 (one-tailed Mann-Whitney U test) b) Heatmap showing RNA-Pol II loading on the promoters of YAP/TAZ targets in MDA-MB-231 cells, in a window of ±1.5kb centered on the transcription start site (TSS). c) Linear correlation between BRD4 and RNA-Pol II occupancy (both expressed in RPKM) on the TSS of YAP/TAZ target genes (n=616). r2 was calculated using linear regression analysis (F-test p-value<0.0001). d) Box-and whiskers plots (defined as in a) showing the change in RNA-Pol II promoter occupancy in JQ1-treated cells vs. control cells (DMSO), comparing promoters of genes not activated by YAP/TAZ (n=8026) with promoters of YAP/TAZ target genes (n=616). **** p<10-10 (one-tailed Mann-Whitney U test) e) Genome browser view of RNA-Pol II binding profiles at representative promoters of YAP/TAZ target genes or not-YAP/TAZ targets. Pol II binding is reduced upon JQ1 treatment or YAP/TAZ depletion on the TSS of YAP/TAZ targets. f) ChIP-qPCR verifying RNA-Pol II binding to promoters of established YAP/TAZ targets upon depletion of BET proteins. GAPDH promoter represents a non-YAP/TAZ target. ChIP with pre-immune IgG displayed background signal (which was comparable in all samples). DNA enrichment was calculated as fraction of input and is presented as % of RNA-Pol II binding in control cells (siCO). g) Box-and whiskers plots of H3K122ac ChIP-seq signal (RPKM) showing its enrichment on YAP/TAZ target genes (n=616) in comparison with inactive promoters (n=4618) and not-YAP/TAZ targets (n=8026). Data are presented as in a. **** p<10-10 (one-tailed Mann-Whitney U test) h) Box-and whiskers plots showing the change in H3K122ac promoter levels in YAP/TAZ-depleted (left) or JQ1-treated cells (right), both compared to control cells (DMSO), showing preferential loss of H3K122ac at promoters of YAP/TAZ target genes (n=616) vs. promoters of not YAP/TAZ targets (n=8026). Data are presented as in a. **** p<10-10 (one-tailed Mann-Whitney U test) i) Heat map showing acetylation of H3K122 on the promoters of YAP/TAZ targets in MDA-MB-231 cells, in a window of ±1.5kb centered on the transcription start site (TSS). j) Average ChIP-seq profile of H3K122ac on the promoters of YAP/TAZ target genes (n=616) in MDA-MB-231 cells, in a window of ±1.5 kb centered on TSS. k) Genome browser view of H3K122ac levels at representative promoters of YAP/TAZ target genes vs. not-YAP/TAZ targets.
Figure 5
Figure 5. Treatment with BET inhibitor blunts YAP/TAZ-addicted breast tumors
a) Heat map showing the regulation of YAP/TAZ target genes in triple negative breast cancer cells after YAP/TAZ depletion (siYT1, siYT2) or treatment with BET inhibitors (1µM, 24h). Expression values are normalized to cells transfected with control (siRNA) and to GAPDH. b) Left: viability curves of TNBC cells treated with increasing doses of JQ1 (1nM to 100µM). Data are mean of n=8 independent wells (independently treated and evaluated). Right: IC50 of listed cell lines. c) Proliferation of BT20 cells is not impaired by YAP/TAZ depletion, whereas all cells sensitive to JQ1 are also affected by YAP/TAZ depletion. d) BRD4 downregulation by shRNAs impairs colony formation by YAP5SA-overexpressing MCF10A cells in soft agar. Data are presented as individual data points (n=3 independent samples) + average (bar), from one of three experiments providing similar results. Similar results were obtained in MDA-MB-231 cells, whose colony-forming capacity depends on endogenous YAP/TAZ (see Supplementary Fig. 5b). e) Quantification of colonies formed by YAP5SA-overexpressing MCF10A cells in soft agar, upon treatment with 0,1µM or 1µM JQ1 for the entire experiment. Data are presented as in d. Similar results were obtained in MDA-MB-231 cells (see Supplementary Fig. 5c). f) Inhibition of the growth of colonies initiated by YAP5SA-overexpressing MCF10A cells in soft agar upon addition of JQ1 (1µM) to culture medium 8 or 15 days after seeding (treatment with JQ1 at day1 is presented as reference for maximal inhibition). Data are presented as in d. g) Representative hematoxylin and eosin (H&E) staining of sections of mammary glands from MMTV-Cre;Apc+/+, MMTV-Cre;Apcfl/fl, or MMTV-Cre;Apcfl/fl;Yapfl/fl;Tazfl/fl mice. Scale bar is 0.1 mm. The same phenotype was observed in at least 4 mice per each experimental group. h) Representative immunofluorescence (IF) pictures of mammary glands from the indicated mice, showing YAP accumulation in the nuclei of epithelial cells, expansion of luminal cells (K8-positive) and discontinuities in the basal layer of K14-positive cells in MMTV-Cre;Apcfl/fl. Ducts of MMTV-Cre;Apcfl/fl;Yapfl/fl;Tazfl/fl mice display a normal morphology. Scale bar is 25 µm. IF was performed on sections derived from 4 mice per each genotype. i) Representative H&E staining of sections of mammary glands from MMTV-Cre;Apcfl/fl mice, treated with vehicle (n=5) or BAY-BET inhibitor (n=5) for 6 weeks. All scale bars are 0.1mm. See BAY-BET-inhibitor has no effect on the histological appearance of mammary glands of Apcfl/fl (Cre-negative) littermates (see Supplementary Fig. 5g). j) Representative IF pictures of mammary glands from MMTV-Cre;Apcfl/fl mice, treated with vehicle (n=5) or BAY-BET inhibitor (n=5) for 6 weeks, showing that treatment with BET inhibitor restores normal distribution of the luminal marker K8 and the basal marker K14 in the mammary ducts. Scale bars are 25 µm. See Supplementary Fig. 5h for normal K8/K14 staining in Apcfl/fl (Cre-negative) mice treated with BAY-BET-inhibitor.
Figure 6
Figure 6. Treatment with BET inhibitors blunts YAP/TAZ-driven responses in vivo
a) Representative immunofluorescence (IF) for SOX9 and HNF4α in sections of control mouse livers or livers with hepatocyte-specific overexpression of YAPS127A (+YAPHEP), treated with vehicle or BAY-BET-inhibitor. Quantification of double positive cells is in Supplementary Fig. 6c. Scale bar is 50µm. IF was performed in n=4 control mice, n=4 +YAPHEP mice treated with vehicle, and n=4 +YAPHEP mice treated with BAY-BET-inhibitor. b) Representative hematoxylin and eosin (H&E) staining of liver sections from control mice + vehicle (n=4), +YAPHEP mice + vehicle (n=7), +YAPHEP mice + BAY-BET-inh (n=9). Lower panels are magnifications of the portal area. Scale bars are 100μm. Administration of BET-inhibitor to control mice had no overt consequences on liver morphology or molecular features (see Supplementary Fig. 6f-g). c) RNA in situ hybridization on liver tissues for Osteopontin (Spp1). Scale bar is 200µm. The experiment was performed in liver sections from 2 mice per each experimental group with similar results. d) BAY-BET inhibitor impairs liver overgrowth induced by YAP expression. Data are liver/body weight ratios in all examined mice (control mice + vehicle, n=4; control mice + BAY-BET-inh, n=4; +YAPHEP mice + vehicle, n=7; +YAPHEP mice + BAY-BET-inh, n=9). Lines represent the mean of each group. ***p=0.00098 (unpaired t-test, two-tailed) e) Representative images of pancreatic acini in 3D culture, derived from the indicated mice, after 3 days of culture in the presence of doxycycline to activate YAP expression. Treatment with BET inhibitor opposes YAP-induced ADM in organoids (see quantification in Supplementary Fig. 6i). The experiment was repeated four times with similar results. f) EdU staining showing as treatment with BET inhibitor impairs cell proliferation. Scale bar is 50 μm. The experiment was repeated two times with similar results. g) Viability curves of parental WM3248 cells (per se vemurafenib-sensitive) transduced with EGFP or YAP5SA, treated with increasing doses of vemurafenib (1nM to 10µM) with or without JQ1(1µM). The green line shows the effect of JQ1 alone (1µM). Data are mean + SD of n=8 independent wells (independently treated and evaluated). One representative experiment is shown; similar results were obtained in two additional independent experiments. h) RT-qPCR for YAP/TAZ target genes showing upregulation upon YAP5SA overexpression in WM3248 cells and downregulation upon treatment with BET inhibitors (1µM, 24h) or depletion of BRD2/3/4 (siBRD mix A and B). Data are presented as individual data points (n=2 independent samples) + average (bar). i) Viability curves of parental (vemurafenib-sensitive) WM3248 and vemurafenib-resistance WM3248, treated with increasing doses of vemurafenib (1nM to 10µM) with or without JQ1(1µM). The green line shows the effect of JQ1 alone (1µM). Data are presented as in g. One of three independent experiments (all with similar results) is shown. j) Kaplan–Meier graph representing the probability of metastasis-free survival in breast cancer patients. Survival curves are significantly different when patients are stratified according to high or low expression of all BET target genes and common YAP/TAZ/BET target genes, but not when patients are stratified according to BET-only targets (Log-rank Mantel Cox Test).

Comment in

  • BETting on YAP-TAZ.
    Harjes U. Harjes U. Nat Rev Cancer. 2018 Nov;18(11):663. doi: 10.1038/s41568-018-0065-9. Nat Rev Cancer. 2018. PMID: 30301931 No abstract available.

References

    1. Bradner JE, Hnisz D, Young RA. Transcriptional Addiction in Cancer. Cell. 2017;168:629–643. - PMC - PubMed
    1. Villicana C, Cruz G, Zurita M. The basal transcription machinery as a target for cancer therapy. Cancer Cell Int. 2014;14:18. - PMC - PubMed
    1. Andrieu G, Belkina AC, Denis GV. Clinical trials for BET inhibitors run ahead of the science. Drug Discov Today Technol. 2016;19:45–50. - PMC - PubMed
    1. Filippakopoulos P, et al. Selective inhibition of BET bromodomains. Nature. 2010;468:1067–1073. - PMC - PubMed
    1. Shi J, Vakoc CR. The mechanisms behind the therapeutic activity of BET bromodomain inhibition. Mol Cell. 2014;54:728–736. - PMC - PubMed

Publication types

MeSH terms