. 2018 Oct;20(10):1118-1125.
doi: 10.1038/s41556-018-0192-2. Epub 2018 Sep 17.

Single particle trajectories reveal active endoplasmic reticulum luminal flow

Affiliations

Single particle trajectories reveal active endoplasmic reticulum luminal flow

David Holcman et al. Nat Cell Biol. 2018 Oct.

Abstract

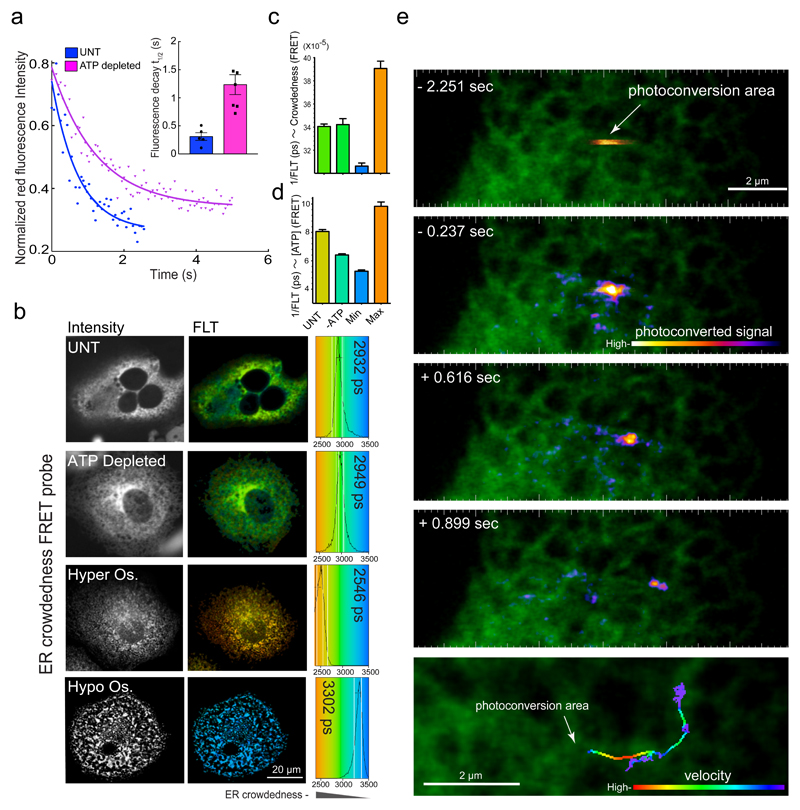
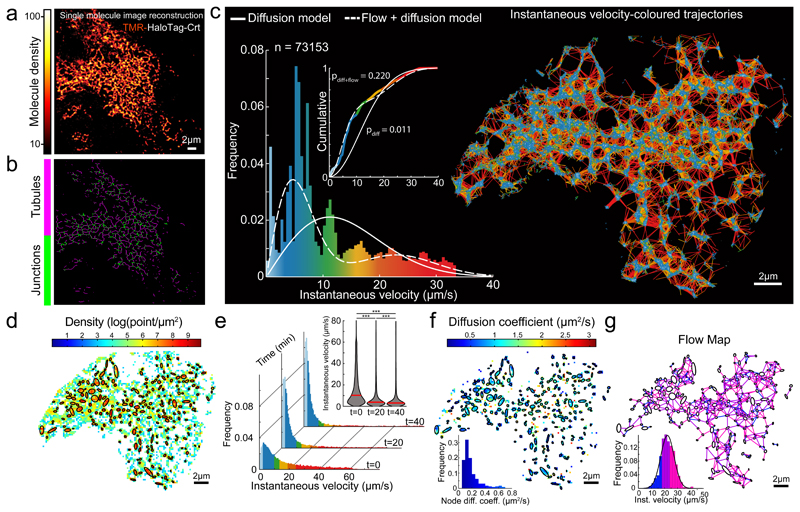
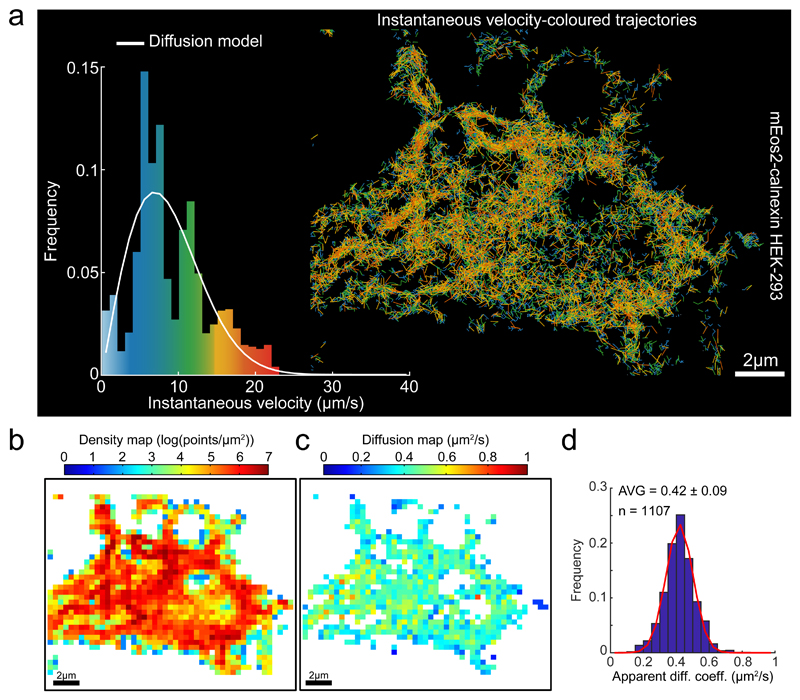
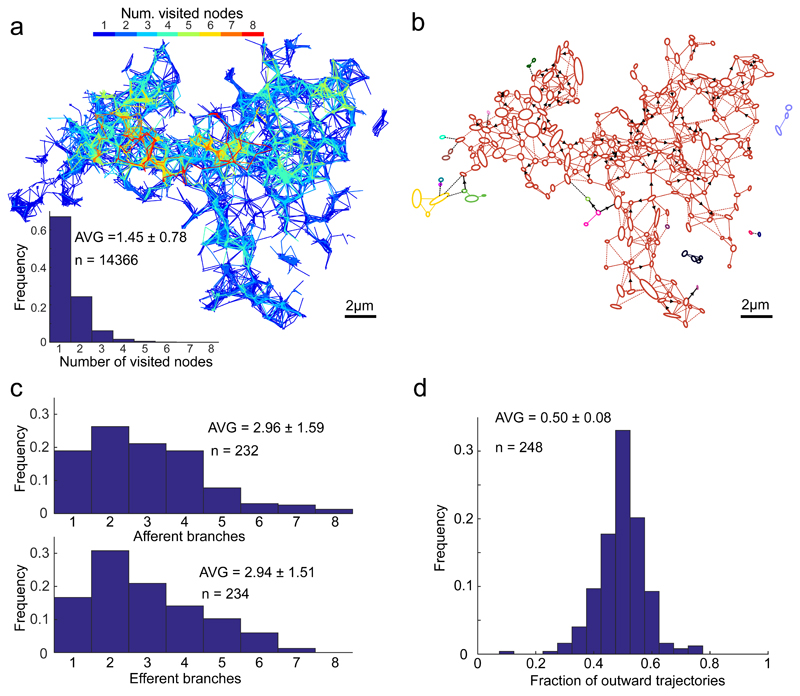
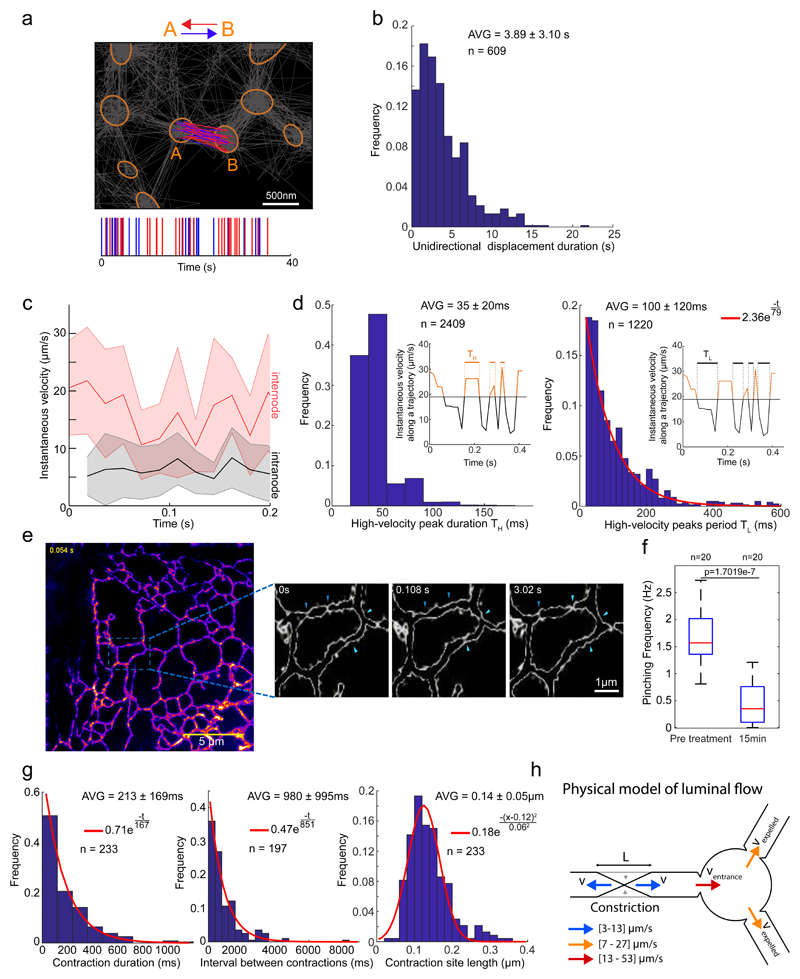
The endoplasmic reticulum (ER), a network of membranous sheets and pipes, supports functions encompassing biogenesis of secretory proteins and delivery of functional solutes throughout the cell1,2. Molecular mobility through the ER network enables these functionalities, but diffusion alone is not sufficient to explain luminal transport across supramicrometre distances. Understanding the ER structure-function relationship is critical in light of mutations in ER morphology-regulating proteins that give rise to neurodegenerative disorders3,4. Here, super-resolution microscopy and analysis of single particle trajectories of ER luminal proteins revealed that the topological organization of the ER correlates with distinct trafficking modes of its luminal content: with a dominant diffusive component in tubular junctions and a fast flow component in tubules. Particle trajectory orientations resolved over time revealed an alternating current of the ER contents, while fast ER super-resolution identified energy-dependent tubule contraction events at specific points as a plausible mechanism for generating active ER luminal flow. The discovery of active flow in the ER has implications for timely ER content distribution throughout the cell, particularly important for cells with extensive ER-containing projections such as neurons.


Figures

Fig. 1
Fig. 1. ATP depletion affects ER mobility without altering luminal crowdedness.
(a) Trace of time-dependent decay in the intensity of the fluorescence signal from an ER-localised photoconvertible protein, Dendra2-ER, after a pulse of photo-converting illumination delivered to a small patch of untreated or ATP-depleted COS7 cells. Inset denotes mean ± SEM, (n=5 traces per condition) of fluorescence decay half time, reflecting the probe’s escape from the photoconversion area. (b) Fluorescence intensity (left) and colour-coded fluorescence lifetime (FLT) images (right) of COS7 cells transfected with an ER-localised molecular crowding probe. FLT distribution within imaged cells is displayed in colour-coded histograms with mean FLT noted (in picoseconds, ps, right). Cells were left untreated (UNT), ATP depleted, or treated with hyper-osmotic (Hyper Os.) or hypo-osmotic buffers that induce cell shrinking or swelling to obtain maximal and minimal crowding values, respectively. Shown are characteristic images observed in three independent repeats. (c) Bar diagram of FRET-donor FLT values measured as in (b) (mean values ± SD, n=22 independently sampled cells). (d) Bar diagram of relative intracellular ATP concentration measured with FRET-based ATP-probe (A-Team) in cells untreated or ATP depleted as in (a & b). Minimum and maximum values represent the probe readings in ATP depleted or saturating conditions respectively, imposed in semi-permeabilised cells. Shown are mean values ± SD, n=10 independently sampled cells. (e) Images of COS7 cell expressing Dendra2. A brief pulse of illumination photoconverted Dendra2 from green to red in a restricted region of the ER. The progression of the photoconverted packet of proteins is revealed by the time series and summated in the bottom panel with its velocity colour coded.
Fig. 2
Fig. 2. Characteristics of single particle displacement tracked in the tubular ER lumen.
(a) Image reconstructed from single molecule localizations of TMR-labeled Halo-tagged Calreticulin (Crt), in HEK-293 cells, rendered with a molecular density colour code. (b) Skeletonization view of image in (a). Shown are representatives of n=3 independent experiments. (c) Single molecule trajectories generated using particle-tracking algorithm from time series of image (a)), color-coded according to instantaneous velocity distribution shown in histogram. Overlaid traces: velocity distribution simulated assuming exclusively diffusion-driven motion (solid line, using apparent D from (h)), or combination of diffusion and flow (using D and flow rate from f & g). Inset: cumulative distribution, Kolmogorov-Smirnov test of observed vs. expected distributions. (d) Density map computed for grid of square bins (sides of 0.2 μm) imposed on particle displacement map. Ellipses mark boundaries of higher density regions (correspond to tube-connecting reservoirs/junctions). (e) Histograms of instantaneous velocity frequency distributions of SPT from a cell before/after ATP depletion (as in Fig. 1 a-c). Inset: violin plot presenting the medians (red bars) and density (grey) of the distributions. A two-sided Mann-Whitney U-test was used to compare median of each pair of distributions (*** p-value < 1e-3), p(0-20 min)=1e-80, p(20-40 min)=9.889e-64, p(0-40 min)=1e-80; n=20526, n=14591 and n=10108 trajectory displacements respectively. (f) Diffusion map extracted from the empirical estimator of the Langevin equation (1, Suppl. Note 1) and computed from a square grid as in d. Inset: distributions of the diffusion coefficients inside nodes (AVG +/- SD=0.19 +/- 0.13, n=226 nodes). (g) Flow map computed by averaging non-Brownian velocity jumps of particles moving between pairs of neighbouring nodes identified in (d) and color-coded according to the inset histogram. Inset: distribution of average instantaneous velocity between pairs of neighbouring nodes (n=705 node-pairs; AVG +/- SD=22.90 +/- 6.92). Raw source single molecule time series and image-reconstruction are shown in Supplementary Video 2.
Fig. 3
Fig. 3. Statistics of Single Particle trajectories recorded from the ER membrane.
(a) Single molecule trajectories of mEOS2-calnexin expressed in HEK-293 cells generated as in Figure 2, color-coded according to instantaneous velocity distribution Inset: Instantaneous velocity distribution histograms computed from the displacements extracted from the trajectories and overlaid by the expected distribution for a purely diffusive motion with the diffusion coefficient extracted from (d). (b) Density map computed for a grid of square bins (sides of 0.4 μm) imposed on the particle displacement map. (c) Diffusion map extracted from the empirical estimator of the Langevin equation (1, methods) and computed from the same square grid as in (b). (d) Histograms of diffusion coefficients computed from individual square bins, pooled from two cells, for the entire domain as presented in (c). The red curve on top of the diffusion histogram corresponds to a fit (Trust Region Reflecting algorithm) to a Gaussian distribution with μD = 0.42 μm2/s, σD = 0.12 μm2/s and a determination coefficient R2 = 0.986. Descriptive statistics given as AVG +/- SD.
Fig. 4
Fig. 4. Properties of ER luminal trajectories’ directionality.
(a) Number of nodes visited by individual particles. Trajectories map, as in Figure 2, colour-coded according to the number of nodes visited by a particle; and the distribution of the number of nodes visited by each individual trajectory (excluding trajectories visiting 0 node). (b) Vectorial representation of the ER network from Figure 2 analysed using Oriented Network Graph analysis, to assess the direct or proxy, uni/bi-lateral trajectory-connectivity of the nodes, assigning single colour for each interconnected area. Note a strong connected component resulting in a monochromatic appearance of almost the entire network. Arrows denote prevalent displacement directionality (detected in 18% of tubes), defined as such if steady-state ratio of flow in one direction vs. the total flow exceed 0.75. Dashed links represent flows whose directionality could not be determined due to insufficient number of displacement events. (c) Distribution histogram of the number of outward (efferent) and inward (afferent) directed branching for individual nodes. Efferent branches were defined as the number of nodes, reached by the outward trajectories originating in the examined node, in the time-integrated map; accordingly, afferent branches reflect the number of nodes-of-origin for the trajectories arriving at the examined node. (d) Distribution of the fraction of exiting trajectories for each node. All values are given as AVG ± SD.
Fig. 5
Fig. 5. Dynamics of ER luminal flow correlated with tubule contractions.
a. Analysis of particle trajectories’ directionality. Tubular junctions/nodes denoted by orange ellipses; grey lines denote all particle trajectories. Trajectories connecting two nodes indicated as A and B are colour coded according to their direction either in red, denoting travel from A to B, or blue for travel from B to A. Lower graph represents the temporal pattern of traversal-directionality. Shown is representative of n=108 node-pairs. b. Distribution of time periods of unidirectional inter-node displacement. c. Plots of instantaneous particle velocities fluctuations. Velocities of particles following departure from nodes and traveling along tubules (between nodes, red), and those of particles residing within nodes (black). Solid lines represent mean values for all trajectories, shaded regions represent SD of total sample size: n=111 internode and n=140 intranode trajectory displacements. d. Analysis of time duration TH of high-velocity (v > 20 μm/s) peaks (left) and time interval TL between high-velocity peaks. Red line represents an exponential fit (R2 = 0.998). e. High-speed Structured Illumination Microscopy (SIM) super-resolved images of the tubular ER in live COS7 cells stained with an ER membrane dye (ER Tracker-Green). Images were acquired in 54 ms intervals and processed as described in Methods. The resulting SIM reconstructions were colour-coded according to intensity. The magnified area shows the contours of ER tubules at higher magnification. Arrows denote positions where transient contraction events occur repeatedly. Shown are frames from a time series measurement presented in full in supplementary Video S2. Tubule contractions are better visualized in COS7 cells, but detectable in HEK-293 cells too (Fig. S5). Shown is representative of n=5 independent experiments. f. Box plot of tubule contraction frequencies extracted from high-speed SIM time series as shown in (e) before and after ATP depletion. Red line – median, boxes’ bottom/top edges – the 25th and 75th percentiles respectively, whiskers – extreme data points. ***: Two-sided Mann-Whitney U-test p=1.7019e-7, n=20 ER tubules. g. Distributions of contraction duration, intervals and lengths from SIM videos as in (e) and Fig. S5. Red curves: exponential (left and middle) and Gaussian (right) fits (R2 = 0.988, R2 = 0.969, R2 = 0.937 respectively). h. Schematic representation of the model for estimating tubule contraction-induced particle velocity. All values are given as AVG ± SD for noted n.

References

    1. Powers RE, Wang S, Liu TY, Rapoport TA. Reconstitution of the tubular endoplasmic reticulum network with purified components. Nature. 2017;543:257–260. - PMC - PubMed
    1. Voeltz GK, Prinz WA, Shibata Y, Rist JM, Rapoport TA. A class of membrane proteins shaping the tubular endoplasmic reticulum. Cell. 2006;124:573–586. - PubMed
    1. Hubner CA, Kurth I. Membrane-shaping disorders: a common pathway in axon degeneration. Brain : a journal of neurology. 2014;137:3109–3121. - PubMed
    1. Blackstone C, O'Kane CJ, Reid E. Hereditary spastic paraplegias: membrane traffic and the motor pathway. Nature reviews. Neuroscience. 2011;12:31–42. - PMC - PubMed
    1. Dayel MJ, Hom EF, Verkman AS. Diffusion of green fluorescent protein in the aqueous-phase lumen of endoplasmic reticulum. Biophysical journal. 1999;76:2843–2851. - PMC - PubMed

Publication types