. 2018 Sep 17;8(1):13883.
doi: 10.1038/s41598-018-32306-4.

Serotonin receptor type 1B constitutes a therapeutic target for MDS and CMML

Affiliations

Serotonin receptor type 1B constitutes a therapeutic target for MDS and CMML

Antònia Banús-Mulet et al. Sci Rep. .

Abstract

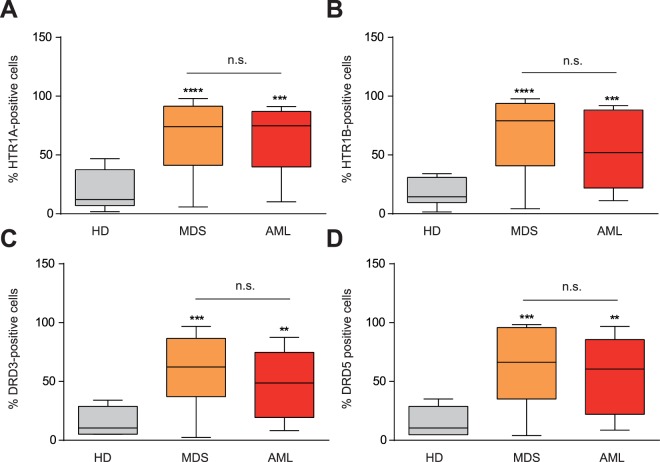
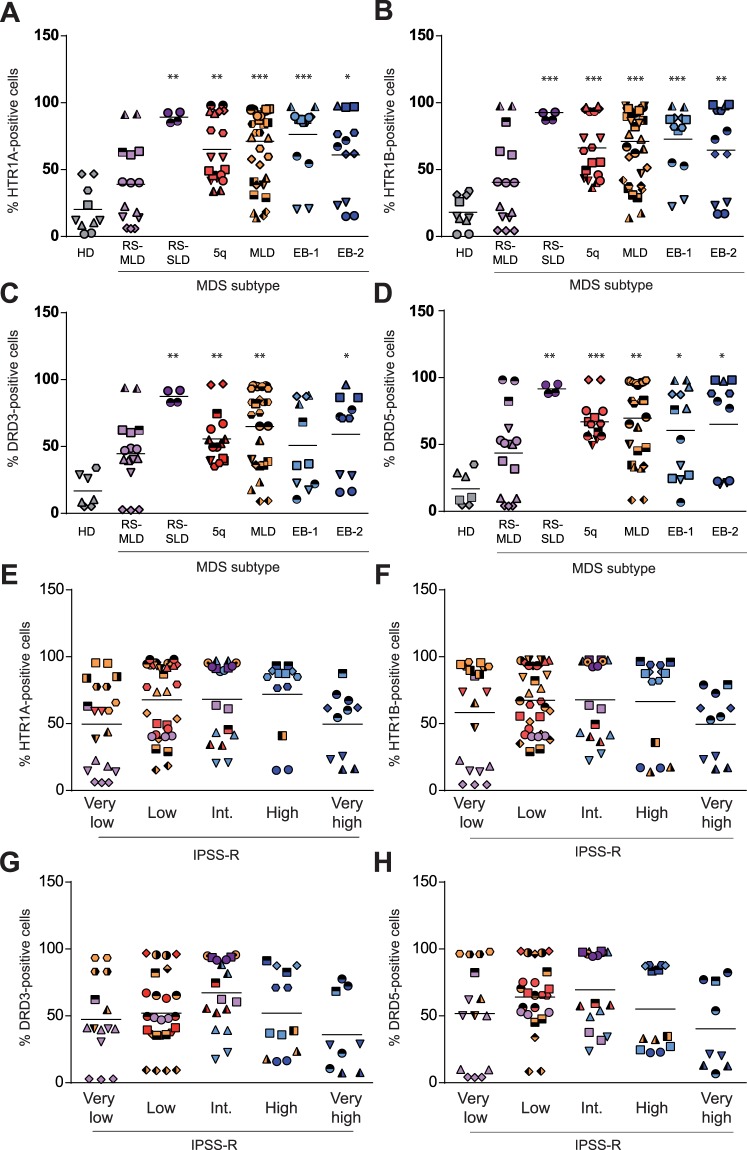
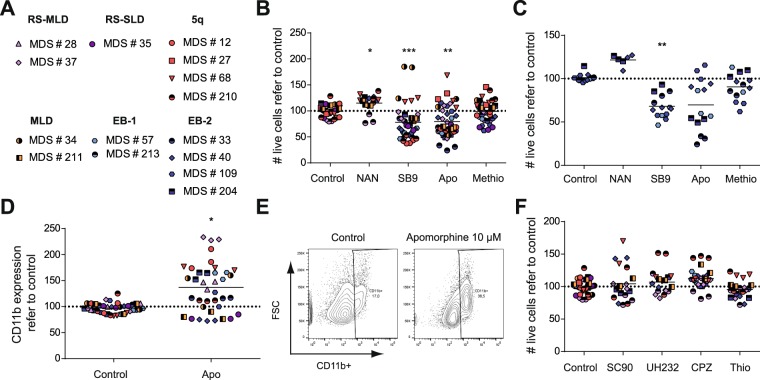
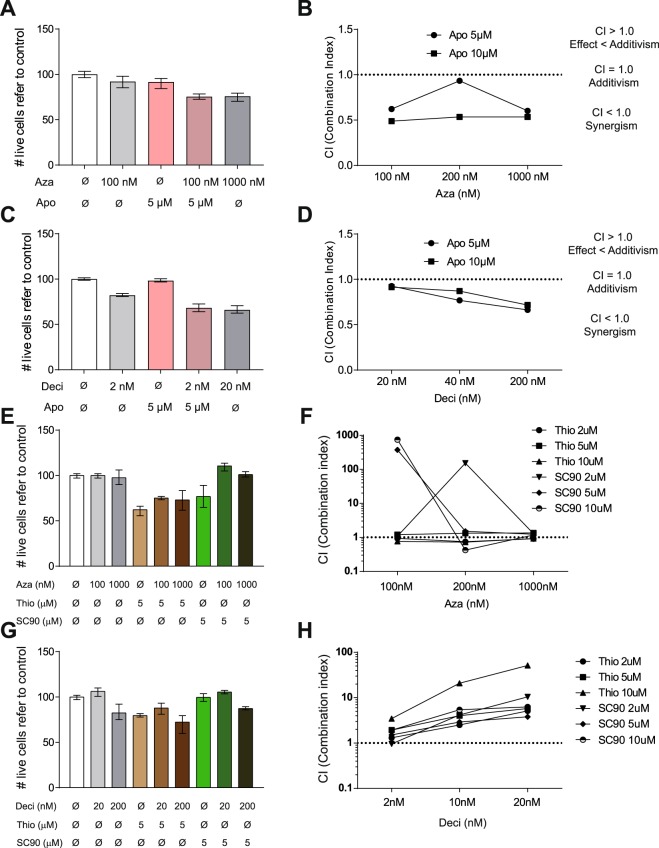
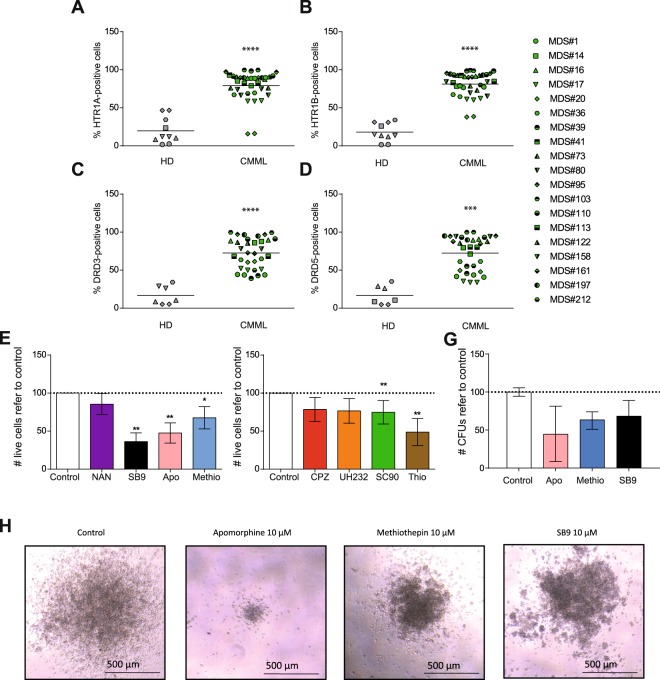
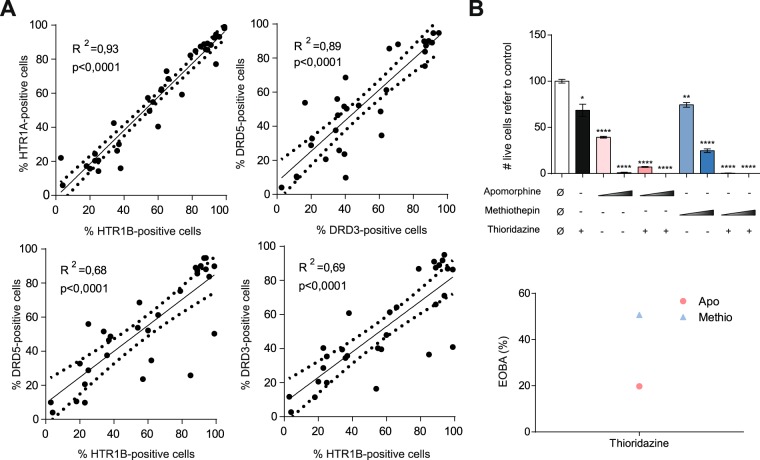
Myelodysplastic syndromes (MDS) and chronic myelomonocytic leukemia (CMML) are chronic myeloid clonal neoplasms. To date, the only potentially curative therapy for these disorders remains allogeneic hematopoietic progenitor cell transplantation (HCT), although patient eligibility is limited due to high morbimortality associated with this procedure coupled with advanced age of most patients. Dopamine receptors (DRs) and serotonin receptors type 1 (HTR1s) were identified as cancer stem cell therapeutic targets in acute myeloid leukemia. Given their close pathophysiologic relationship, expression of HTR1s and DRs was interrogated in MDS and CMML. Both receptors were differentially expressed in patient samples compared to healthy donors. Treatment with HTR1B antagonists reduced cell viability. HTR1 antagonists showed a synergistic cytotoxic effect with currently approved hypomethylating agents in AML cells. Our results suggest that HTR1B constitutes a novel therapeutic target for MDS and CMML. Due to its druggability, the clinical development of new regimens based on this target is promising.


Conflict of interest statement

The results presented in this paper have been patented. R.M.R. is a shareholder of Leukos Biotech.

Figures

Figure 1
Figure 1
HTR1A/B and DRD3/5 are expressed in AML and MDS. (A) HTR1A (HD n = 6; MDS n = 54; AML n = 14), (B) HTR1B (HD n = 6; MDS n = 55; AML n = 14), (C) DRD3 (HD n = 4; MDS n = 47; AML n = 14), and (D) DRD5 (HD n = 4; MDS n = 47; AML n = 14) surface expression measured by flow cytometry in blood samples from healthy donors (HD), MDS samples and AML samples. Frequency of positive cells for each marker is graphed as a box-and-whisker (turkey) plot, the statistical median is indicated as a horizontal line, error bars correspond to SEM and boxes indicated the lowest and upper quartile. **p < 0.01; ***p < 0.001; ****p < 0.0001.
Figure 2
Figure 2
All MDS subtypes differentially express DRD3/5 and HTR1A/B, except MDS-RS-MLD. MDS patient samples tested for (A) HTR1A, (B) HTR1B, (C) DRD3 and (D) DRD5 surface expression by flow cytometry. Each subtype of MDS is represented (Healthy donor (HD), grey; RS-MLD, violet; RS-SLD, purple; 5q, red; MLD, orange; EB-1, light blue; EB-2, dark blue). MDS patient samples were classified according to IPSS-R (Very low, low, intermediate, high, very high) and the surface expression of (E) HTR1A, (F) HTR1B, (G) DRD3 and (H) DRD5 is represented. Frequency of positive cells is graphed. Each symbol type corresponds to a patient sample, and each symbol corresponds to an experimental point. Grand mean values are indicated with horizontal lines. *p < 0.05; **p < 0.01; ***p < 0.001; ****p < 0.0001.
Figure 3
Figure 3
Treatment with HTR1 antagonists reduces MDS cell viability. (A) MDS patient samples used in cytotoxic experiments classified by subtypes. (B) MDS patient samples or (C) specifically MDS-EB-1/2 samples were treated with 10 µM of subtype specific-HTR antagonists (apomorphine –apo-, HTR1/2; methiothepin –methio-, HTR1/2; NAN190 –NAN-, HTR1A; SB-224289 –SB9–, HTR1B) for 72 h and cell viability was measured by 7-AAD exclusion by flow cytometry. Normalized live cell counts against vehicle-treated samples are represented. (D) MDS patient samples were treated with 10 µM apomorphine for 72 h and the expression of the granulocytic associated-differentiation surface marker CD11b was measured by flow cytometry. Normalized frequency of positive cells refer to vehicle control-treated samples is represented. (E) CD11b surface expression upon treatment with 10 μM apomorphine is shown. (F) MDS patient samples were treated with 10 µM of subtype specific-DR antagonists (SCH-23390 –SC90–, DRD1/5; UH-232 –H232–; DRD2/3; Chlorpromazine –CPZ–; pan-DR, Thioridazine –Thio–, pan-DR) for 72 h and cell viability was measured by 7-AAD exclusion by flow cytometry. Each symbol type corresponds to a patient sample, and each symbol corresponds to an experimental point. Grand mean values are indicated with horizontal lines. *p < 0.05; **p < 0.01; ***p < 0.001; ****p < 0.0001.
Figure 4
Figure 4
HTR and DR antagonist shown synergism with HMAs. MonoMac-1 AML cells were treated for 72 h with apomorphine –apo– (5 and 10 µM) and azaciditine –aza– (100, 200 and 1000 nM). (A) Cell viability was measured by 7-AAD exclusion by flow cytometry. (B) Synergism between drugs was evaluated based on the combination index method (CI). MonoMac-1 AML cells were treated for 72 h with apomorphine –apo– (5 and 10 µM) and decitabine –deci– (20, 40 and 200 nM). (C) Cell viability was measured by 7-AAD exclusion by flow cytometry. (D) Synergism between drugs was evaluated based on the combination index method (CI). (E) MonoMac-1 AML cells were treated for 72 h with thioridazine –thio– or SCH-23390 –SC90– (2, 5 and 10 µM) and azaciditine –aza– (100, 200 and 1000 nM). Cell viability was measured by 7-AAD exclusion by flow cytometry. (F) Synergism between drugs was evaluated based on the combination index method (CI). MonoMac-1 AML cells were treated for 72 h with thioridazine –thio– or SCH-23390 –SC90– (2, 5 and 10 µM) and decitabine –deci– (20, 40 and 200 nM). (G) Cell viability was measured by 7-AAD exclusion by flow cytometry. (H) Synergism between drugs was evaluated based on the combination index method (CI). Bars represent mean values of triplicates. Error bars represent range.
Figure 5
Figure 5
DRs and HTR1s are differentially express on CMML samples. CMML patient samples and healthy blood cells (HD) were tested for (A) HTR1A, (B) HTR1B, (C) DRD3 and (D) DRD5 surface expression by flow cytometry. Frequency of positive cells is represented. Each symbol type corresponds to a CMML patient samples, each symbol corresponds to an experimental point. Grand mean values are shown as a horizontal line. CMML patient samples were treated for 72 h with 10 µM of (E) subtype specific-HTR antagonists (apomorphine –apo–, HTR1/2; methiothepin –methio–, HTR1/2; NAN190 –NAN–, HTR1A; SB-224289 –SB9–, HTR1B) and 10 μM of (F) subtype specific-DR antagonists (SCH-23390 –SC90-, DRD1/5; UH-232 –H232-, DRD2/3; Chlorpromazine –CPZ-, pan-DR; Thioridazine –Thio-, pan-DR) and cell viability was measured by 7-AAD exclusion by flow cytometry. Data is normalized against vehicle-treated control sample. CMML n = 4 in triplicates. (G) CMML patient sample were plated in methylcellulose and the number of CFUs refer to control is represented. Normalized data refer to control are represented as mean ± range. CMML n = 2 in duplicates. *p < 0.05; **p < 0.01; ***p < 0.001; ****p < 0.0001.
Figure 6
Figure 6
DR3/5 and HTR1A/B are co-expressed in MDS and CMML cells. (A) Frequency of HTR1A- vs. HTR1B- (upper left), DRD3 vs. DRD5 (upper right), HTR1A vs. DRD5 (lower left) and HTR1B vs. DRD5 (lower right)-positive cells are represented. The coefficient of determination measured as R2 is specified. The regression line is shown as a solid line; the confidence interval is represented as a dotted line. (B) HL-60 AML cell line was treated for 72 h with apomorphine (5 µM and 10 µM) and methiothepin (5 µM and 10 µM), in combination with thioridazine at 10 µM. Cell viability was measured by 7-AAD exclusion by flow cytometry (left panel). The synergistic effect in combination treatment measured was evaluated based on EOBA (Excess Over Bliss Additivism) (right panel). *p < 0.05; **p < 0.01; ***p < 0.001; ****p < 0.0001.

References

    1. Visser O, et al. Incidence, survival and prevalence of myeloid malignancies in Europe. Eur J Cancer. 2012;48:3257–3266. doi: 10.1016/j.ejca.2012.05.024. - DOI - PubMed
    1. Gangat N, et al. Primary Myelodysplastic Syndromes: The Mayo Clinic Experience With 1000 Patients. Mayo Clin Proc. 2015;90:1623–1638. doi: 10.1016/j.mayocp.2015.08.022. - DOI - PubMed
    1. Garcia-Manero G. Myelodysplastic syndromes: 2015 Update on diagnosis, risk-stratification and management. Am J Hematol. 2015;90:831–841. doi: 10.1002/ajh.24102. - DOI - PubMed
    1. Arber DA, et al. The 2016 revision to the World Health Organization classification of myeloid neoplasms and acute leukemia. Blood. 2016;127:2391–2405. doi: 10.1182/blood-2016-03-643544. - DOI - PubMed
    1. Beran M. Chronic myelomonocytic leukemia. Cancer Treat Res. 2008;142:107–132. - PubMed

Publication types

MeSH terms

Substances