. 2018 Sep 17;8(1):13943.
doi: 10.1038/s41598-018-32291-8.

Effects of soiling on photovoltaic (PV) modules in the Atacama Desert

Affiliations

Effects of soiling on photovoltaic (PV) modules in the Atacama Desert

R R Cordero et al. Sci Rep. .

Abstract

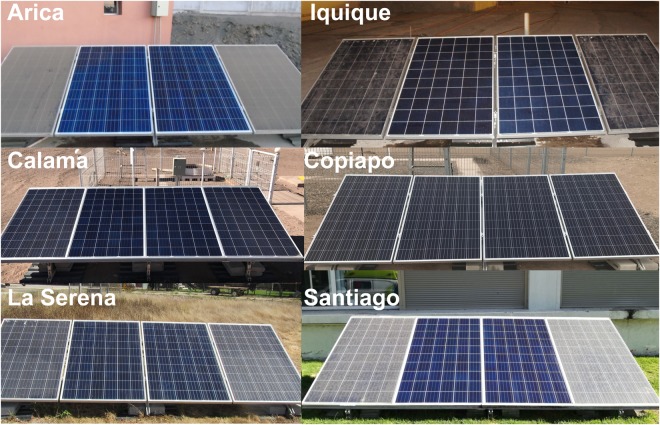
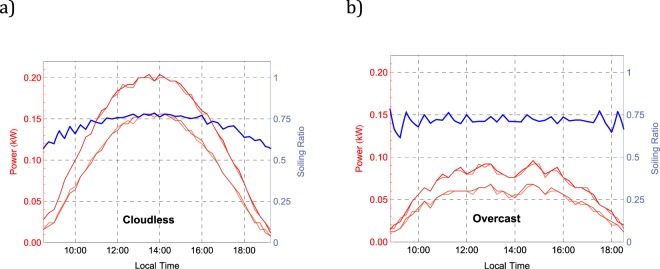
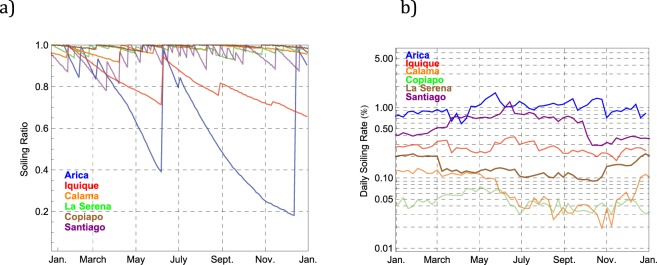
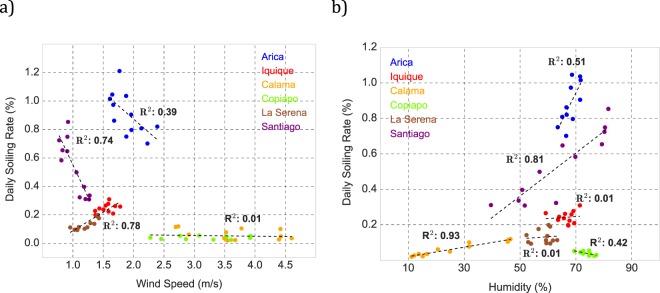
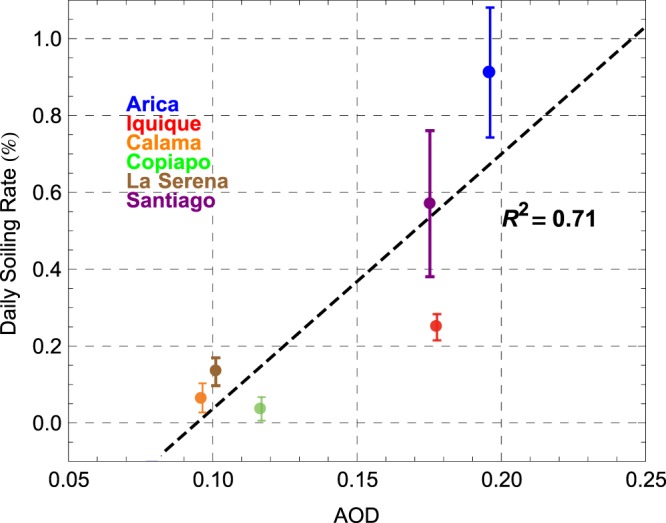
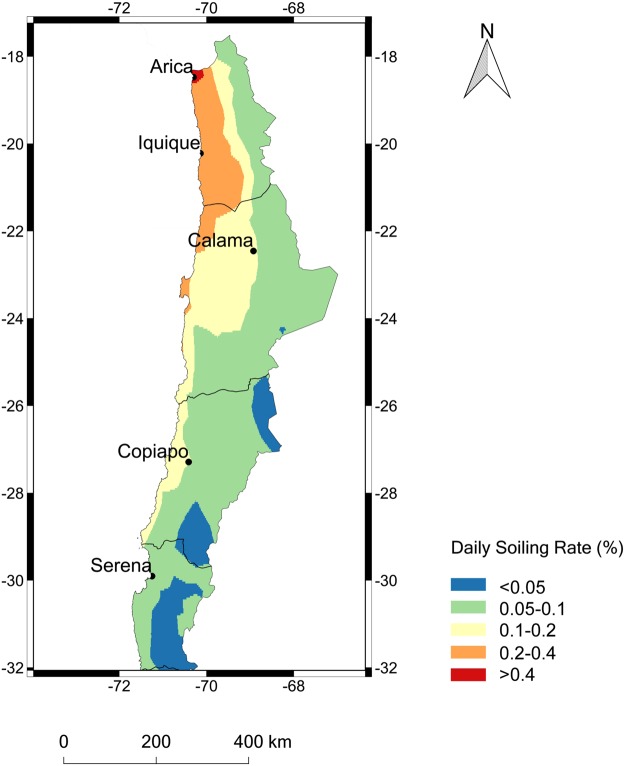
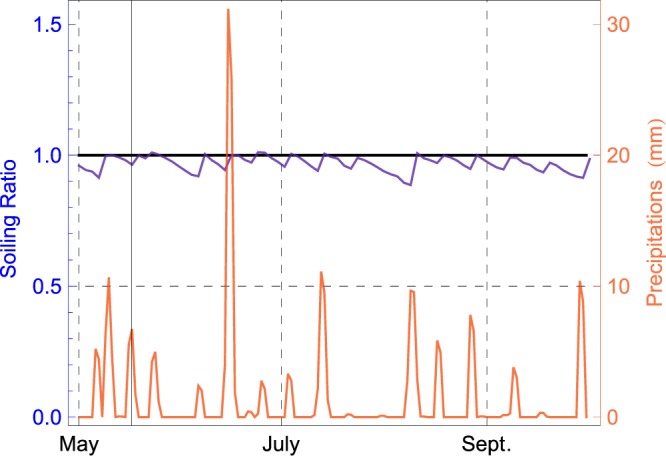
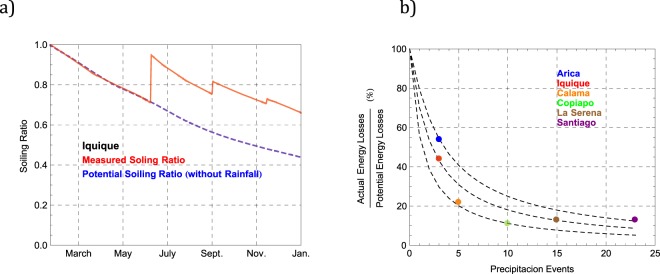
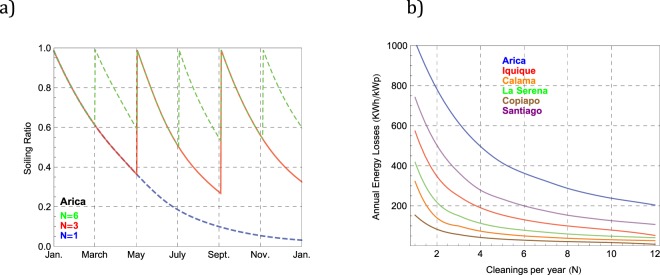
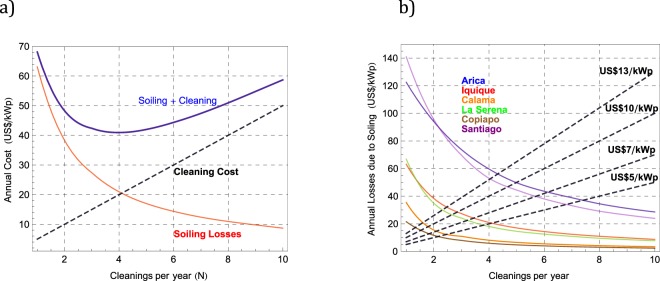
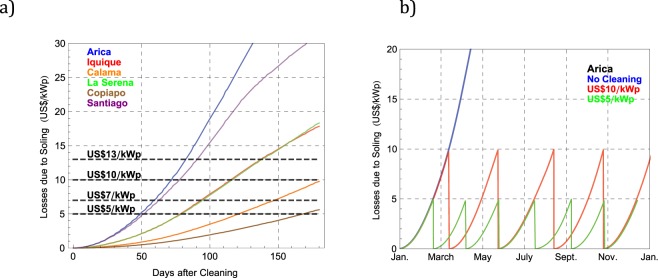
Soiling by dry deposition affects the power output of photovoltaic (PV) modules, especially under dry and arid conditions that favor natural atmospheric aerosols (wind-blown dust). In this paper, we report on measurements of the soiling effect on the energy yield of grid-connected crystalline silicon PV modules deployed in five cities across a north-south transect of approximately 1300 km in the Atacama Desert ranging from latitude 18°S to latitude 30°S. Energy losses were assessed by comparing side-by-side outputs of four co-planar PV modules. Two of the PV modules of the array were kept clean as a control, while we allowed the other two to naturally accumulate soiling for 12 months (from January 2017 to January 2018). We found that the combination of high deposition rates and infrequent rainfalls led to annual energy losses that peaked at 39% in the northern coastal part of the desert. In contrast, annual energy losses of 3% or less were measured at relatively high-altitude sites and also at locations in the southern part of the desert. For comparison, soiling-induced annual energy losses of about 7% were measured in Santiago, Chile (33°S), a major city with higher rainfall frequency but where urban pollution plays a significant role.


Conflict of interest statement

The authors declare no competing interests.

Figures

Figure 1
Figure 1
Maps generated by using IDL® (http://www.harrisgeospatial.com/SoftwareTechnology/IDL.aspx#language). (a) Annual insolation obtained from the Surface meteorology and Solar Energy (SSE) web portal supported by the NASA Langley Research Center (LaRC) POWER Project. (b) Annual average of AOD at 555 nm computed from retrievals of the Multi-angle Imaging SpectroRadiometer (MISR) instrument (aboard Terra satellite; https:// DOI 10.5067/Terra/MISR/MIL3MAE_L3.004) over the period 2006–2016; (c) Average of the annual precipitation over the period 2004–2012 based on the dataset of the Tropical Rainfall Measuring Mission (TRMM) was obtained from the “Observations for Climate Model Intercomparison (obs4MIPs)” project hosted on the Earth System Grid Federation (https://www.earthsystemcog.org/projects/obs4mips/).
Figure 2
Figure 2
Photographs of the soiling measuring systems. At each location, the central modules of the arrays were manually cleaned while we allowed the other two to naturally accumulate soiling. Please note that these pictures were not taken at the same time and they are not meant to show the typical soiling, since the latter significantly changes during the year. Photographs were taken by the authors (R.R.C., J.J., E.S., D.S., and S.M.).
Figure 3
Figure 3
The red curves show the power output of the four PV modules (two clean and two soiled) of our system in Iquique. The blue curve shows the Soiling Ratio (SR) taken in this case as being equal to the ratio between the power output of the soiled modules and the power output of the clean control modules. (a) Measurements on January 3rd, 2018 (clear sky conditions). (b) Measurements on November 6th, 2017 (overcast conditions).
Figure 4
Figure 4
(a) Soiling Ratio measurements over a 12-month period in Arica, Iquique, Calama, Copiapo, La Serena and Santiago; (b) Daily Soiling Rate computed from the data shown in (a).
Figure 5
Figure 5
Scatter plot of monthly averages of the daily soiling rate measured in Arica, Iquique, Calama, Copiapo, La Serena and Santiago, and the corresponding: (a) monthly wind speed averages; (b) monthly relative humidity averages.
Figure 6
Figure 6
Scatter plot of the annual averages of the daily soiling rate measured in Arica, Iquique, Calama, Copiapo, La Serena and Santiago, and the corresponding annual averages of the AOD estimates. Uncertainty bounds based on the standard deviation of the daily soiling rate measured at each location.
Figure 7
Figure 7
Map generated by using IDL® (http://www.harrisgeospatial.com/SoftwareTechnology/IDL.aspx#language). Daily soiling rate computed from the MISR-derived estimates of the AOD by using the linear regression shown in Fig. 6.
Figure 8
Figure 8
Soiling ratio and precipitations in Santiago from May to October 2017.
Figure 9
Figure 9
(a) Soiling ratio (SR) measured in Iquique (red curve) and SR computed assuming no self-cleaning events (dashed blue curve); (b) Fraction of the potential energy losses due to soiling that was actually lost during a 12-month period in Arica, Iquique, Calama, Copiapo, La Serena and Santiago.
Figure 10
Figure 10
(a) Soiling ratio (SR) computed using the daily soiling rate measured in Arica. Each curve stands for the expected SR progression under different cleanings per year (N): annual cleaning (N = 1, dashed blue curve), cleanings at a regular four-month period (N = 3, red curve), and cleanings every two months (N = 6, dashed green curve); (b) Energy losses expected under different cleaning frequencies at the locations considered in this study.
Figure 11
Figure 11
(a) Annual soiling losses expected with different cleanings per year (N) in Iquique (red curve); annual costs of cleaning computed under different N values assuming that the cleaning cost is US$5/kWp (dashed black curve); total annual costs under different N values adding up both the soiling losses and the cleaning costs (blue curve); (b) Annual soiling losses expected with different cleanings per year (N) at the locations considered in this study. The dashed lines stand for the annual costs associated to N cleanings per year considering different cleaning prices.
Figure 12
Figure 12
(a) Soiling losses progression after cleaning, computed using the daily soiling rate measured in summer at the locations considered in this study. The dashed lines stand for different cleaning prices; (b) Expected soiling losses computed by using the daily soiling rate measured in Arica assuming: no cleaning (blue curve), cleanings when losses due to soiling peak at US$10 (red curve), and cleanings when losses due to soiling peak at US$5 (green curve).

References

    1. Cordero RR, et al. The solar spectrum in the Atacama Desert. Sci Rep-UK. 2016;6:22457. doi: 10.1038/srep22457. - DOI - PMC - PubMed
    1. Molina A, Falvey M, Rondanelli R. A solar radiation database for Chile. Sci Rep-UK. 2017;7(1):14823. doi: 10.1038/s41598-017-13761-x. - DOI - PMC - PubMed
    1. Rondanelli R, Molina A, Falvey M. “The Atacama surface solar maximum.”. B Am Meteorol Soc. 2015;96(3):405–418. doi: 10.1175/BAMS-D-13-00175.1. - DOI
    1. CNE, Comision Nacional de Energia, Reporte del Sector Energetico Diciembre 2017 (2018).
    1. Feron S, Cordero RR, Labbe F. “Sustainability of rural electrification efforts based on off-grid Photovoltaic systems in the Andean Region”. Sustainability-Basel. 2017;9:1825. doi: 10.3390/su9101825. - DOI

Publication types

LinkOut - more resources