. 2018 Oct;21(10):1380-1391.
doi: 10.1038/s41593-018-0227-9. Epub 2018 Sep 17.

CNS lymphatic drainage and neuroinflammation are regulated by meningeal lymphatic vasculature

Affiliations

CNS lymphatic drainage and neuroinflammation are regulated by meningeal lymphatic vasculature

Antoine Louveau et al. Nat Neurosci. 2018 Oct.

Abstract

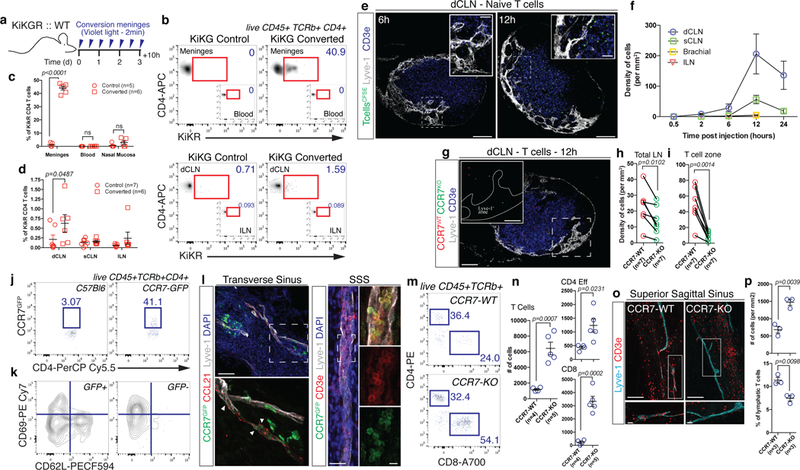
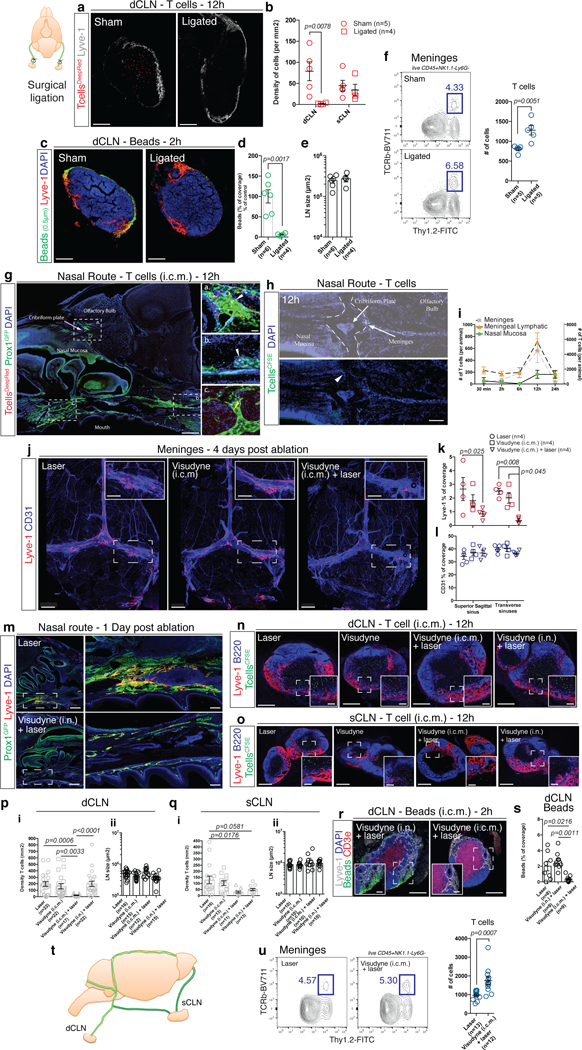
Neuroinflammatory diseases, such as multiple sclerosis, are characterized by invasion of the brain by autoreactive T cells. The mechanism for how T cells acquire their encephalitogenic phenotype and trigger disease remains, however, unclear. The existence of lymphatic vessels in the meninges indicates a relevant link between the CNS and peripheral immune system, perhaps affecting autoimmunity. Here we demonstrate that meningeal lymphatics fulfill two critical criteria: they assist in the drainage of cerebrospinal fluid components and enable immune cells to enter draining lymph nodes in a CCR7-dependent manner. Unlike other tissues, meningeal lymphatic endothelial cells do not undergo expansion during inflammation, and they express a unique transcriptional signature. Notably, the ablation of meningeal lymphatics diminishes pathology and reduces the inflammatory response of brain-reactive T cells during an animal model of multiple sclerosis. Our findings demonstrate that meningeal lymphatics govern inflammatory processes and immune surveillance of the CNS and pose a valuable target for therapeutic intervention.


Conflict of interest statement

Competing interests: J.K. is an Advisor to PureTech Health/Ariya.

Figures

Figure 1:
Figure 1:. Meningeal lymphatic sub-arachnoid extensions uptake molecules and immune cells from the cerebrospinal fluid.
a, General scheme of meningeal lymphatic vascular organization. b, Scheme of the experiment presented in (c). Prox1GFP mice were injected into the cisterna magna (i.c.m.) with 5µl of Qdot655. The transverse sinus was imaged through a thinned skull. c, Representative image of meningeal lymphatics adjacent to the transverse sinus (Prox1GFP – green) filled with the i.c.m. injected Qdot655 (red) 60min after injection. The inset represents the coronal view of the lymphatic vessel filled with Qdot655. Scale bar = 65 µm. Representative of 3 independent animals. d, Representative images of the lymphatic vessels co-labeled with i.c.m. injected anti-Lyve-1A488 and exogenously applied anti-Lyve-1A660 at different time points after i.c.m. injection. Arrows in inset at 5 and 15 min illustrate the initial points where the i.c.m. injected anti-Lyve-1A488 labelled the meningeal lymphatics. Scale bar = 1000 µm (upper panel); 250 µm (bottom left panel) 60 µm (bottom right panel). e, Quantification of the percentage of lymphatic vessels labeled by the i.c.m. injected antibody and total lymphatic area at different time points post injection (mean ± s.e.m.; n=4 mice/group). f, Representative images of OVA594 and fluorescent bead accumulation along the lymphatics (Lyve-1 - red) are shown. Arrows point to lymphatic extensions in the area of microbeads and OVA accumulation. Scale bar = 300 µm (upper panel), 120 µm (bottom panels). Representative of 5 independent animals. g, Representative images of the accumulation of exogenously injected T cells (CFSE – green) at the extension-rich regions of lymphatic vessels adjacent to the transverse sinuses 12h after i.c.m. injection. Scale bar = 1000µm (right panel), 200µm (insets) . Representative of 3 independent animals. h, Representative images of exogenously injected T cells (CFSE – green) located within the meningeal lymphatics (Lyve-1 – white) associated with the transverse sinus (CD31 – blue). Scale bar = 35 µm. Representative images of 5 independent animals. i, Representative images of the lymphatics of the superior sagittal sinus (left panel) and the transverse sinus (right panel) with i.c.m. injected Qdot655. Arrows point to the subarachnoid space (SAS). Scale bar = 25 µm. Representative of 2 independent animals. j, Representative images of lymphatic sprout at the extension-rich region of lymphatic vessels along the transverse sinus, immunostained with Lyve-1 (grey) and junction proteins, VE-Cadherin (green) and Claudin-5 (red). Scale bar = 25µm. Representative of 2 independent animals. k, Representative image of the meningeal lymphatic vessels adjacent to the transverse sinus of Prox1GFP mice. Arrows point toward sprouting/extensions along the lymphatic vessels. Scale bar = 350 µm. Representative of 5 mice. l, Quantification of the length of lymphatics and number of lymphatic extensions in adjacent sections of meningeal lymphatics associated with the transverse sinus starting from the pineal gland (mean ± s.e.m.; n = 5 mice; n = 2 transverse sinus/mouse).
Figure 2:
Figure 2:. Meningeal T cells migrate into the cervical lymph nodes in a CCR7 dependent manner.
a, Scheme of the experiments in (b-d). C57Bl6 mice were reconstituted with bone marrow from KiKGR mice after irradiation. Ten weeks after reconstitution, meninges were converted for 2 min with a violet light (through the intact skull) every twelve hours for 3 days. Ten hours after the last conversion, tissues were harvested and analyzed by FACS. b, Representative density plot of converted T cells (KiKR+) in the meninges and deep cervical (dCLN) of control and converted mice. c, Quantification of the percentage of converted CD4 T cells (KiKR+) in the meninges, blood and nasal mucosa of control and converted mice (mean ± s.e.m.; F(1,26)=388.8; 2-way ANOVA with Sidak’s multiple comparisons test). d, Quantification of the percentage of KiKR+ CD4 T cells in the dCLN, sCLN and ILN of control and converted mice (mean ± s.e.m.; F(1,33)=4.862; mice pooled from 2 independent experiments, 2-way ANOVA with Sidak’s multiple comparisons test). e, Representative images of i.c.m. injected naïve T cells in the dCLN of mice at 6 and 12h post injection. Scale bar = 200 µm, 50µm (insets). f, Quantification of the density of naïve T cells per mm2 of dCLN, sCLN, brachial, and ILN at different time points post injection (mean ± s.e.m.; n=2–7 mice per group pooled from 2 independent experiments). g, Representative images of CCR7-WT (red) and CCR7-KO (green) CD4 T cells in the dCLN 12h post injection. Scale bar = 200 µm, 75µm (inset). h, i, Quantification of the density of CCR7-WT and CCR7-KO cells per mm2 of total lymph nodes (h) or per T cell zone (i) at 12h post injection (mean ± s.e.m.; t=3.687 df=6 (h) t=5.586 df=6 (i); pooled from 2 independent experiments; two-tailed paired t-test). j, Representative dot plot of GFP expression by CD4 T cells in the meninges of C57Bl6 mice and CCR7GFP mice. Representative of 3 independent mice. k, Representative contour plot of phenotype of CCR7+ and CCR7-CD4 T cells in the meninges of CCR7GFP mice. Representative of 3 independent mice. l, Representative images of CCR7 expression (CCR7GFP – green) in and around the meningeal lymphatics (Lyve-1 – white and CCL21 – red) along the transverse and superior sagittal sinuses. Arrows point to leukocyte-shaped cells expressing CCR7 located inside of the meningeal lymphatics. Scale bar = 120 µm. CCR7 expressing T cells (CD3e – red) are found in the meningeal lymphatics (Lyve-1 – grey). Scale bar = 40 µm, 15µm (insets). Representative of 3 independent mice. m, Representative dot plots of meningeal T cells (both CD4 and CD8) in the meninges of adult CCR7-WT and CCR7-KO mice. n, Quantification of the number of total, CD4 effector and CD8 T cells in the meninges of CCR7-WT and CCR7-KO mice (mean ± s.e.m.; representative of 2 independent experiments; t=5.744 df=7 (T Cells), t=2.897 df=7 (CD4 Eff), t=6.961 df=7 (CD8); two-tailed unpaired t-test). o, Representative images of T cells (CD3e – red) in and around the meningeal lymphatics (Lyve-1 – blue) of the superior sagittal sinus in CCR7-WT and CCR7-KO mice. Scale bar = 120 µm, 15µm (inset). p, Quantification of the density of T cells in the proximity of the sinuses of CCR7-WT and CCR7-KO mice (top panel) and percentage of T cells localized inside of the lymphatics (bottom panel) (mean ± s.e.m.; t=5.998 df=4 (density), t=4.633 df=4 (percentage); two-tailed unpaired t-test).
Figure 3:
Figure 3:. Meningeal lymphatics as the main route for immune cell and macromolecule drainage from the CSF.
a, Representative images of exogenously injected T cells (CellTracker Deep Red Dye – red) in the dCLN at 12h after i.c.m. injection in sham-operate or ligated mice (24h post-surgery). Scale bar = 150 µm. b, Quantification of the density of T cells per mm2 of dCLN and sCLN in sham-operate or ligated mice (mean ± s.e.m.; F(1,14)=7.676; two-way ANOVA with Sidak’s multiple comparison test). c, Representative images of exogenously injected fluorescent microbeads (0.5µm in diameter – green) in the dCLN of sham-operated or ligated mice. Scale bar = 150 µm. d, Quantification of the percentage of bead coverage in the dCLN of sham-operated or ligated mice ((5µl of beads were injected); expressed as percentage of the control condition; mean ± s.e.m.; t=4.603 df=8; two-tailed unpaired t-test). e, Quantification of the size of the dCLNs of sham-operated or ligated mice (mean ± s.e.m). f, Representative contour plot of T cells in the meninges of sham-operated or ligated mice. Quantification of the number of T cells (TCRb+) in the meninges sham-operated or ligated mice (mean ± s.e.m.; representative of 2 independent experiment; t=3.813 df=8; two-tailed unpaired t-test). g, Representative images of i.c.m. injected T cells (Deep Red Cell Tracker – red) in the lymphatics of the cribriform plate (a) and in and around the lymphatics at the base of the nose (b and c). White arrowheads point to intra-lymphatic T cells while yellow arrowheads point to peri-lymphatic T cells. Scale bar = 1000 µm, 50µm (insets). Representative of 2 independent mice. h, Representative images of the cribriform plate region after 2 and 12h post i.c.m. injection of CFSE-labeled T cells (green). Arrowhead points to a CFSE-labeled T cell localized on the nasal side of the cribriform plate. Scale bar = 230 µm. Representative of 4 independent mice. i, Quantification of the number of exogenously injected T cells in the meninges (grey curve), in the meningeal lymphatics (orange curve), and in the nasal mucosa (green curve) of mice at different time post i.c.m. injection (mean ± s.e.m.; n=2–8 mice per group, pooled from 2 independent experiments). j, Representative images of the meningeal lymphatics (Lyve-1 – red) and blood (CD31 – blue) vasculature of laser alone, Visudyne (i.c.m.) alone and Visudyne (i.c.m.) + laser treated mice 4 days after photoconversion. Scale bar = 1000 µm, 400µm (insets). k, l, Quantification of the Lyve-1 (k) and CD31 (l) coverage on the superior sagittal and transverse sinuses of laser alone, Visudyne (i.c.m.) alone and Visudyne (i.c.m.) + laser treated mice 4 days after photoconversion (mean ± s.e.m.; representative of 3 independent experiments; F(2,18)=10.67; two-way ANOVA with Sidak’s multiple comparison test). m, Representative images of the nasal lymphatics (Prox1GFP – green, Lyve1 – red) 24h after laser or intranasal (i.n.) injection of Visudyne. The inset illustrates the lymphatic bundle at the base of the skull that is ablated after Visudyne treatment. Scale bar = 500 µm, 200µm (insets). Representative of 6 mice/group from 2 independent experiments. n, o, Representative images of i.c.m. injected T cells (CFSE-labeled, green) in the dCLNs (n) or sCLNs (o) of laser alone, Visudyne alone, Visudyne i.c.m. + laser, and Visudyne (i.n.) + laser treated mice 12h after i.c.m. injection. Scale bar = 150µm, 30µm (insets) (n), 300µm, 50µm (insets) (o). p, Quantification of the density of T cells per mm2 of dCLNs (i) and size of dCLNs (ii) in the laser alone, Visudyne alone, Visudyne i.c.m. + laser, and Visudyne (i.n.) + laser treated mice 12h after i.c.m. injection (mean ± s.e.m.; pooled from 4 independent experiments (i) pooled from 3 independent experiments (ii); Kruskal-Wallis test with Dunn’s multiple comparison test). q, Quantification of the density of T cells per mm2 of sCLNs (i) and sCLNs size (ii) in the laser alone, Visudyne alone, Visudyne i.c.m. + laser, and Visudyne (i.n.) + laser treated mice 12h after i.c.m. injection (mean ± s.e.m.; pooled from 2 independent experiment (i) and from a single experiment (ii); F(3,49)=4.282; one-way ANOVA with Sidak’s multiple comparison test). r, Representative images of CSF-injected beads drained to the dCLNs in Visudyne (i.n.) + laser and Visudyne (i.c.m.) + laser treated mice at 2h after injection. Scale bar = 150µm, 35µm (insets). s, Quantification of the percentage of bead coverage of the dCLNs of laser, Visudyne (i.c.m.) + laser and Visudyne (i.n.) + laser treated mice at 2h after CSF injection (mean ± s.e.m.; F(2,23)=9.122; one-way ANOVA with Tukey’s multiple comparisons test). t, Scheme of the proposed model of the route of drainage into the cervical lymph nodes. u, Representative contour plot of T cells in the meninges of laser and Visudyne (i.c.m.) + laser treated mice at 7 days post ablation. Quantification of the number of T cells in the meninges of laser and Visudyne (i.c.m.) + laser treated mice (mean ± s.e.m.; pooled from 3 independent experiments; t=3.939 df=23; two-tailed unpaired t-test).
Figure 4:
Figure 4:. Transcriptomic analysis of the meningeal lymphatic endothelial cells.
a, Principal component analysis of the transcriptome of the lymphatic endothelial cells (LEC) of the diaphragm (blue), meninges (green) and skin (red – ear) (n=3 biological replicate per group each pooled from 10 individual mice). b, Upset plot showing the set intersection between the differentially up-regulated genes in meningeal, diaphragm, and skin LEC. The orange bar represents the 304 up-regulated genes in the meningeal LEC compared to the diaphragm and skin LEC. c, Heat map of the significantly up– and down– regulated genes in the meningeal LEC compared to the diaphragm and skin LEC. d, Heat map of the relative expression of the LEC-related genes in the meningeal, diaphragm, and skin LEC. e, Representation of significantly up– and down– regulated gene pathways in the meningeal LEC compared to diaphragm and skin LEC (Fisher’s exact test). f, Quantification of the normalized counts for Sema3a, Ephb2, Thsp1, and Klf4 in the diaphragm, meningeal and skin LEC. Genes were selected from the significantly up-or down-regulated genes (mean ± s.e.m.). g, Quantification of the normalized counts from diaphragm, meninges and skin LECs for genes previously shown to be down-or up-regulated by LECs when cultured on high stiffness surfaces (mean ± s.e.m.; F(2,42)=12.14; two-way ANOVA with Tukey’s multiple comparison test).
Figure 5:
Figure 5:. Ablation of lymphatic drainage modulates T cell activation and ameliorates disease development.
a, EAE clinical symptoms development in laser, Visudyne (i.n.) + laser, and Visudyne (i.c.m.) + laser treated mice (on the day of EAE induction; mean ± s.e.m.; pooled from 3 independent experiments; F(2,79)=23.07; repeated measures two-way ANOVA with Tukey’s multiple comparisons test). b, Incidence of EAE development (the day mice reach a score of 1 or above) in laser, Visudyne (i.n.) + laser, and Visudyne (i.c.m.) + laser treated mice (pooled from 3 independent experiments, Log-rank (Mantel-Cox) test). c, Representative dot plots of CD4 and CD8 T cells in the spinal cord, brain meninges and spinal cord meninges of laser and Visudyne (i.c.m.) + laser mice during late onset EAE (D17). d, Quantification of the number of CD4 and CD8 T cells in the spinal cord, brain meninges and spinal cord meninges of laser and Visudyne (i.c.m.) + laser treated mice at D17 post immunization (mean ± s.e.m.; pooled from 2 independent experiments; F(1,26)=5.5990 (Brain Meninges), F(1,26)=10.91; two-way ANOVA with Sidak’s multiple comparisons test). e-h, Adult wild-type mice were injected i.v. with 1:1 ratio of 2D2TdTOMATO and OTIIGFP T cells (4 millions total). One day after injection, mice were laser or Visudyne (i.c.m.) + laser treated and EAE was induced by immunization with MOG35–55. The dCLNs were harvested at day 8 of EAE development and the interaction of the 2D2 and OTII T cells with CD11c+ cells were analyzed. e, Representative images of MOG-specific T cells (2D2 – red) and OVA-specific T cells (OTII - green) in the dCLNs of laser and Visudyne (i.c.m.) + laser treated mice at D8 post EAE induction. Green arrowheads points to OTII T cells. Yellow arrowheads points to 2D2 non in contact with a CD11c+ cells, and white arrowheads points to 2D2 in contact with a CD11c+ cells. Scale bar = 150µm, 25µm (insets). Representative of 5 independent mice per group. f, Representative images and associated profile plot of a MOG-specific T cells (2D2 – red) in close contact (upper panel) or not (lower panel) to a CD11c+ expressing cells (cyan) in the dCLNs of laser and Visudyne (i.c.m.) + laser treated mice at D8 post EAE induction. Scale bar = 10µm. Representative of 5 independent mice per group. g, Quantification of the density of OTII and 2D2 T cells in the dCLNs of laser and Visudyne (i.c.m.) + laser treated mice at D8 post EAE induction (mean ± s.e.m.). h, Quantification of the percentage of OTII and 2D2 T cells in contact with a CD11c+ cells in the dCLNs of laser and Visudyne (i.c.m.) + laser treated mice at D8 post EAE induction (mean ± s.e.m.; F(1,8)=4.204; two-way ANOVA with Sidak’s multiple comparisons test). i, Heat map of the significantly up-and down-regulated genes in the CD44+ 2D2 T cells obtained from dCLN and spleen of Visudyne (i.c.m.) + laser vs. control laser treated mice (Fisher’s exact test with p value > 0.05). j, Volcano plot of the significantly up– and down– regulated genes in the CD44+ 2D2 T cells obtained from dCLN of Visudyne (i.c.m.) + laser vs. control laser treated mice (n=3 samples per group; P values were corrected for multiple hypothesis testing with the Benjamini-Hochberg false-discovery rate procedure). k, Representation of some of the significantly enriched pathways in the CD44+ 2D2 T cells obtained from dCLN of Visudyne (i.c.m.) + laser vs. control laser treated mice (P values were corrected for multiple hypothesis testing with the Benjamini-Hochberg false-discovery rate procedure). l, Dot plot analysis of the active miRNA in the CD44+ 2D2 T cells obtained from dCLN of the Visudyne (i.c.m.) + laser vs. control laser treated mice (data was analyzed using the hypergeometric distribution with a significance at p<0.05).

Comment in

Similar articles

Cited by

References

    1. Louveau A et al. Structural and functional features of central nervous system lymphatic vessels. Nature 523, 337–341, doi:10.1038/nature14432 (2015). - DOI - PMC - PubMed
    1. Kida S, Pantazis A & Weller RO CSF drains directly from the subarachnoid space into nasal lymphatics in the rat. Anatomy, histology and immunological significance. Neuropathol Appl Neurobiol 19, 480–488 (1993). - PubMed
    1. Cserr HF, Harling-Berg CJ & Knopf PM Drainage of brain extracellular fluid into blood and deep cervical lymph and its immunological significance. Brain Pathol 2, 269–276 (1992). - PubMed
    1. Iliff JJ et al. A paravascular pathway facilitates CSF flow through the brain parenchyma and the clearance of interstitial solutes, including amyloid beta. Sci Transl Med 4, 147ra111, doi:10.1126/scitranslmed.3003748 (2012). - DOI - PMC - PubMed
    1. Go KG, Houthoff HJ, Hartsuiker J, Blaauw EH & Havinga P Fluid secretion in arachnoid cysts as a clue to cerebrospinal fluid absorption at the arachnoid granulation. J Neurosurg 65, 642–648, doi:10.3171/jns.1986.65.5.0642 (1986). - DOI - PubMed

Publication types

MeSH terms