Review
. 2018 Aug 27:2018:2015237.
doi: 10.1155/2018/2015237. eCollection 2018.

Targeted Optical Imaging Agents in Cancer: Focus on Clinical Applications

Affiliations
Review

Targeted Optical Imaging Agents in Cancer: Focus on Clinical Applications

Bishnu P Joshi et al. Contrast Media Mol Imaging. .

Abstract

Molecular imaging is an emerging strategy for in vivo visualization of cancer over time based on biological mechanisms of disease activity. Optical imaging methods offer a number of advantages for real-time cancer detection, particularly in the epithelium of hollow organs and ducts, by using a broad spectral range of light that spans from visible to near-infrared. Targeted ligands are being developed for improved molecular specificity. These platforms include small molecule, peptide, affibody, activatable probes, lectin, and antibody. Fluorescence labeling is used to provide high image contrast. This emerging methodology is clinically useful for early cancer detection by identifying and localizing suspicious lesions that may not otherwise be seen and serves as a guide for tissue biopsy and surgical resection. Visualizing molecular expression patterns may also be useful to determine the best choice of therapy and to monitor efficacy. A number of these imaging agents are overcoming key challenges for clinical translation and are being validated in vivo for a wide range of human cancers.


Figures
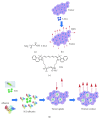
Figure 1
Figure 1
Nonspecific optical imaging agents. (a) Chemical structure of 5-ALA. (b) 5-ALA is taken up by tumor cells and used for synthesis of PpIX (abs = 405 nm, em = 635 nm). (c) Chemical structure of ICG (abs = 783 nm, em = 813 nm). (d) ICG binds to albumin and forms a complex that accumulates in tumor cells to enhance image contrast.
Figure 2
Figure 2
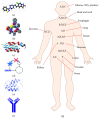
Molecular probe platforms. Targeted contrast agents being developed for optical imaging include (A) small molecule, (B) peptide, (C) affibody, (D) activatable, (E) lectin, and (F) antibody. (G) Clinical studies are being performed using each platform in a wide range of cancers.
Figure 3
Figure 3
In vivo optical imaging with folate. Chemical structure is shown of folate labeled with (a) FITC (abs = 490 nm, em = 525 nm), known as EC17, and (b) ICG (abs = 783 nm, em = 813 nm), known as OTL38. (c) White light laparoscopic image of peritoneum in vivo and corresponding (d) fluorescence image show enhanced contrast from ovarian cancer metastases following systemic administration of EC17 ((c) and (d) reprinted with the permission from [60]).
Figure 4
Figure 4
Small molecular inhibitors. Chemical structures of (a) PARP1 labeled with BODIPY (abs = 507 nm and em = 525 nm) and (b) Hsp90 inhibitor HS-196 labeled with FITC. (c) Fluorescence imaging of the oral cavity is performed with topical application of PARPi-FL followed by an acetic acid rinse to remove any unbound contrast agent. (d) Detection of OSCC in mouse tongue in orthotopic xenograft model using fluorescence stereoscope ((c) and (d) reprinted with the permission from [70]).
Figure 5
Figure 5
Peptides. (a) Chlorotoxin (CTX) is labeled with Cy5.5 (abs = 675 nm and em = 695 nm), also known as BLZ-100. (b) GE-137 is specific for c-Met and is labeled with Cy5 (abs = 645 nm and em = 665 nm), also known as EMI-137. (c) VRPMPLQ is labeled with fluorescein (abs = 490 nm and em = 520 nm). (d) Peptides ASYNYDA, KCCFPAQ, and QRHKPRE are labeled with either FITC or Cy5 via a linker (X = FITC or CY5). (e) Peptide specific for Her2 is labeled with IRDye800 via a thiol-maleimide (X = IRDYE800). (f) Cyclic peptide LS301 specific for integrin is labeled with cypate (abs = 778 nm and em = 805 nm). (g) ABY-029 affibody specific for EGFR is labeled with IRDye800 ((a) reprinted and modified with the permission from [102] and (b) reprinted with the permission from [78]).
Figure 6
Figure 6
In vivo peptide image of human colonic adenoma. (a) SSA (arrow) with flat morphology collected with conventional white light is shown. (b) Fluorescence image following topical administration of peptide KCCFPAQ labeled with FITC shows increased contrast from lesion (arrow). (c) Reflectance and fluorescence images are combined as a (d) ratio to quantify image. (e) Image intensities along horizontal dashed line in (b–d) show a peak located at site of the SSA (arrow). (f) Corresponding histology of SSA shows serrated morphology (arrow) (reprinted with the permission from [81]).
Figure 7
Figure 7
Activatable probe. (a) LUM015 consists of GGRK cleavage site. The Cy5 fluorophore is quenched by QSY21 in native state. (b) Proteolytic cleavage of the quencher by cathepsins activates fluorescence from Cy5. (c) Significantly increased signal is seen in a preclinical model of sarcoma. (d) Representative ex vivo fluorescence images of resected normal human muscle and sarcoma along with corresponding histology ((c) and (d) reprinted with the permission from [89]).
Figure 8
Figure 8
Lectin. (a) Chemical structure is shown of wheat germ agglutinin (WGA) labeled with AF647 (abs = 650 nm and em = 668 nm). (b) Immunofluorescence of human colon, including (HP), low-grade dysplasia (LGD), high grade dysplasia (HGD), and adenocarcinoma (AC), is shown stained with lectin Helix pomatia agglutinin (HPA) labeled with AF647. (c) Corresponding histology (H&E) ((a) reprinted and modified with the permission from [111] and (b) reprinted with the permission from [90]).
Figure 9
Figure 9
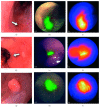
Antibody. Wide-field endoscopic images collected in vivo of human esophageal adenocarcinoma (EAC) following topical administration of bevacizumab labeled with IRDye800. (a) White light (WL), (b) overlay (OV), and (c) fluorescence (FL) image from nonfocal lesion (arrow) is shown. Similar set of images are shown for (d–f) flat and (g–i) protruding EAC (reprinted and modified with the permission from [96]).

Similar articles

Cited by

References

    1. American Cancer Society. Cancer Facts and Figures. Atlanta, GA, USA: American Cancer Society; 2017.
    1. Bray F., Jemal A., Grey N., Ferlay J., Forman D. Global cancer transitions according to the human development Index (2008–2030): a population-based study. The Lancet Oncology. 2012;13(8):790–801. - PubMed
    1. National Cancer Institute. Surveillance, Epidemiology, and End Results (SEER) Program Research Data (1973-2014), DCCPS, Surveillance Research Program, released April 2017, based on the November 2016 Submission. Rockville, MD, USA: National Cancer Institute; 2017. http://www.seer.cancer.gov.
    1. Howlader N., Noone A. M., Krapcho M., et al. SEER Cancer Statistics Review, 1975–2013. Bethesda, MD, USA: National Cancer Institute; 2016.
    1. Jain S., Dhingra S. Pathology of esophageal cancer and Barrett’s esophagus. Annals of Cardiothoracic Surgery. 2017;6(2):99–109. doi: 10.21037/acs.2017.03.06. - DOI - PMC - PubMed

Publication types

Substances