. 2018 Aug 8;5(Pt 5):608-618.
doi: 10.1107/S205225251800996X. eCollection 2018 Sep 1.

Twist and turn: a revised structural view on the unpaired bubble of class II CPD photolyase in complex with damaged DNA

Affiliations

Twist and turn: a revised structural view on the unpaired bubble of class II CPD photolyase in complex with damaged DNA

Manuel Maestre-Reyna et al. IUCrJ. .

Abstract

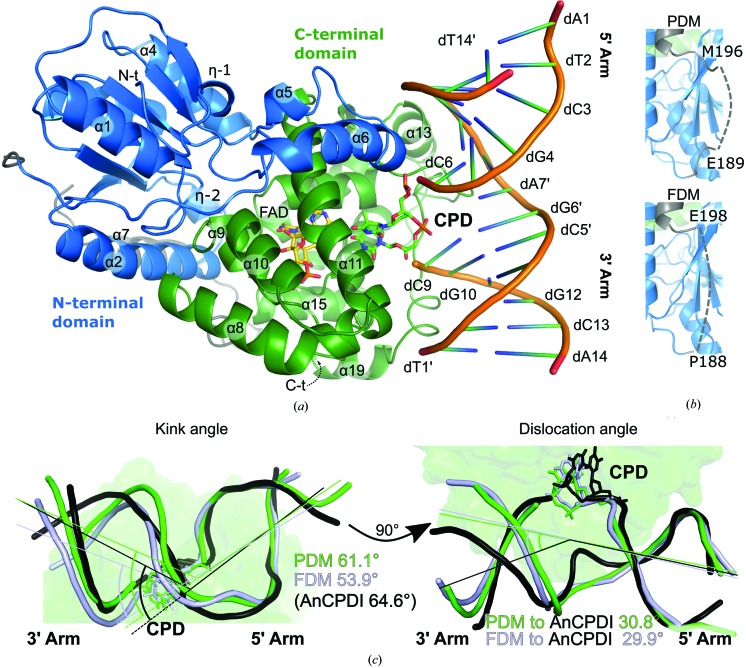
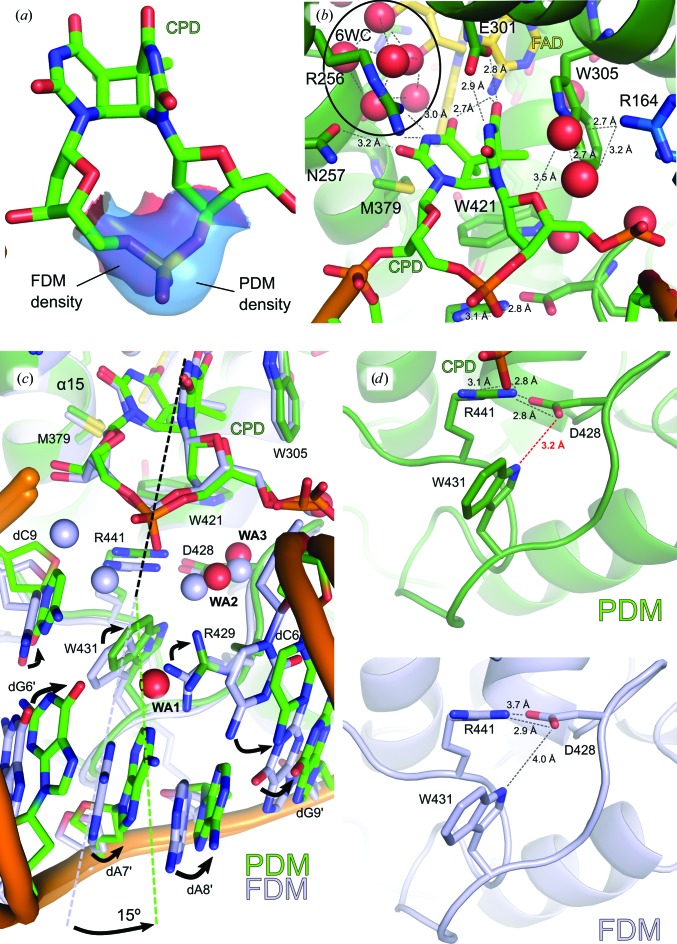
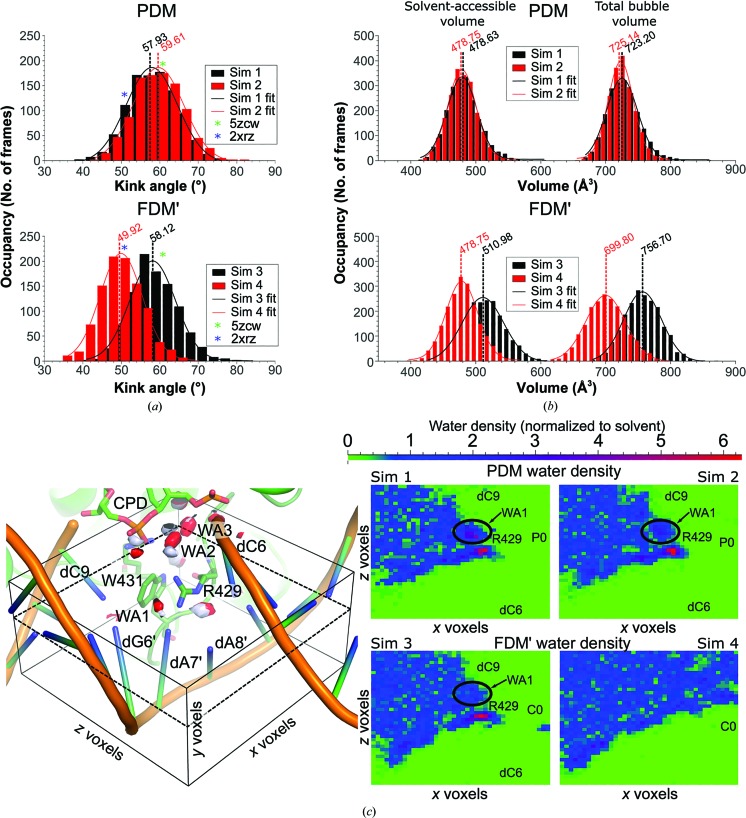
Cyclobutane pyrimidine dimer (CPD) photolyases harness the energy of blue light to repair UV-induced DNA CPDs. Upon binding, CPD photolyases cause the photodamage to flip out of the duplex DNA and into the catalytic site of the enzyme. This process, called base-flipping, induces a kink in the DNA, as well as an unpaired bubble, which are stabilized by a network of protein-nucleic acid interactions. Previously, several co-crystal structures have been reported in which the binding mode of CPD photolyases has been studied in detail. However, in all cases the internucleoside linkage of the photodamage site was a chemically synthesized formacetal analogue and not the natural phosphodiester. Here, the first crystal structure and conformational analysis via molecular-dynamics simulations of a class II CPD photolyase in complex with photodamaged DNA that contains a natural cyclobutane pyrimidine dimer with an intra-lesion phosphodiester linkage are presented. It is concluded that a highly conserved bubble-intruding region (BIR) mediates stabilization of the open form of CPD DNA when complexed with class II CPD photolyases.

Keywords: DNA distortion; DNA repair; class II CPD photolyases; crystal structure; cyclobutane pyrimidine dimer.


Figures

Figure 1
Figure 1
Overall fold of MmCPDII in complex with double-stranded DNA containing a native cyclobutane pyrimidine dimer (CPD). (a) View of the overall complex, with the two subdomains in blue (N-terminal) and green (C-terminal). The DNA is shown as a double-stranded cartoon, while the oxidized FAD cofactor (yellow) and the CPD damage (green) are shown as stick models. (b) Differences in the domain-linker region (grey) in the PDM structure (PDB entry 5zcw) versus the FDM structure (PDB entry 2xrz). (c) DNA geometry distortions as a result of photolyase binding. Double strands are shown in green (PDM), pale blue (FDM) and black (A. nidulans class I CPD photolyase; AnCPDI). For orientation purposes, the outline of the MmCPDII structure is shown in pale green in the background. The side view (left) shows the kink angle, i.e. the sharp bend in the DNA resulting from CPD flipping and partial unstacking of the complementary adenines. Here, kink angles were calculated from the vector products of the 5′ versus 3′ arms of each chain. The top view (right) shows the dislocation of the 3′ arm in class II CPD photolyase (green, PDM; pale blue, FDM) when compared with class I (black, AnCPDI). Dislocation angles were calculated by superposing the 5′ arms of all three molecules, followed by determining the vector products between either the PDM or FDM 3′ arm and the AnCPDI 3′ arm.
Figure 2
Figure 2
Natural CPD binding by MmCPDII. (a) Determining the nature of the CPD backbone. Electron density for PDM (blue; PDB entry 5zcw) was much more prominent than for FDM (red; PDB entry 2xrz), clearly confirming the presence of a phosphodiester backbone. Electron densities were calculated as OMIT maps at a 1.5σ contour level against their respective models and then superposed with the PDM structure. (b) The PDM active site. The active site of the co-crystal structure contained the CPD (bright green) as well as an oxidized FAD cofactor (gold). It also included the class II CPD photolyase-specific water cluster (6WC). (c) Stabilizing the distorted DNA in the presence of a native CPD. Superposition of the active-site residues of PDM (green) and FDM (pale blue) reveals an ∼15° twist in the DNA geometry, which is accompanied by side-chain and base rearrangements (black arrows). Furthermore, the immediate hydration sphere also shifts, facilitating new interactions (WA1, WA2 and WA3 in red for PDM and in pale blue for FDM). (d) The lock bolt of the BIR. Top, the BIR lock bolt in the presence of a phosphodiester-linked CPD lesion (PDB entry 5zcw). The differential locking interaction between Asp428 and Trp431 is highlighted in red. Bottom, the BIR lock bolt in the presence of a formacetal-linked CPD lesion (PDB entry 2xrz).
Figure 3
Figure 3
Simulating the breathing behaviour of CPD phosphodiester or formacetal linkage-containing dsDNA–MmCPDII complexes. (a) DNA kink-angle population analysis, with the middle of the distribution highlighted by a dotted line and value in the corresponding colour. The bins corresponding to either the PDM (PDB entry 5zcw, complex I) or FDM (PDB entry 2xrz, complex II) crystal structures are highlighted with green and blue asterisks, respectively. Top, populations for CPD phosphodiester-containing simulations (simulation 1 in black, simulation 2 in red). Bottom, populations for two of the CPD formacetal-containing simulations (simulation 3 in black, simulation 4 in red). (b) Non-occluded and total volume population analysis for the unpaired DNA bubble. Non-occluded volumes (i.e. the volume not covered by the amino acids occluding the unpaired space) are always smaller and on the left side of the graph. The total volume is always larger and on the right side of the graph. The middle point of the distribution is highlighted via a dotted line and the corresponding value. Top, populations for the two phosphodiester-containing simulations (simulations 1 and 2 in black and red, respectively). Bottom, populations for two of the formacetal-containing simulations (simulations 3 and 4 in black and red, respectively). (c) Water-density analysis for the phosphodiester- and formacetal-containing systems. Left, overall representation of the water-density analysis system. An analysis box (black lines) was drawn roughly around the area of interest, comprising the unpaired bubble and portions of the surrounding solvent. The box was divided into voxels of 0.5 × 0.5 × 0.5 Å. Here, red objects show regions of the analysis box containing waters with an occupancy higher than 5 in simulation 1 (containing phosphodiester) and pale blue objects those in simulation 3 (containing formacetal). Right, highest water occupancy y-axis slice at the 12th y voxel (dotted plane on the left panel), shown for each of the simulations. High-occupancy voxels are shown in red and voxels with solvent-equivalent densities are shown in blue. Voxels occupied by solute, i.e. with water densities below 1, are shown in green. For orientation purposes, the approximate positions of dC6, dC9, C0, P0 and Arg429 are shown on the map, although they are not necessarily coplanar with the 12th y voxel.

Similar articles

Cited by

References

    1. Brettel, K. & Byrdin, M. (2010). Curr. Opin. Struct. Biol. 20, 693–701. - PubMed
    1. Case, D. A. et al. (2017). Amber17. University of California, San Francisco, USA.
    1. Cheatham, T. E. & Case, D. A. (2013). Biopolymers, 99, 969–977. - PMC - PubMed
    1. Chen, C.-Y., Ko, T.-P., Lin, T.-W., Chou, C.-C., Chen, C.-J. & Wang, A. H.-J. (2005). Nucleic Acids Res. 33, 430–438. - PMC - PubMed
    1. Chong, S.-H. & Ham, S. (2016). J. Phys. Chem. Lett. 7, 3967–3972. - PubMed