. 2018 Aug 1;5(8):180249.
doi: 10.1098/rsos.180249. eCollection 2018 Aug.

How wide is the cone of direct gaze?

Affiliations

How wide is the cone of direct gaze?

Tarryn Balsdon et al. R Soc Open Sci. .

Abstract

The cone of direct gaze refers to the range of gaze deviations an observer accepts as looking directly at them. Previous experiments have calculated the width of the cone of direct gaze using the gaze deviations actually presented to the observer, however, there is considerable evidence that observers actually perceive gaze to be systematically more deviated than actually presented. Here, we examine the width of the cone of direct gaze in units of perceived gaze deviation. In doing so, we are able to disambiguate differences in width both within and between observers that are due to differences in their perception of gaze and due to differences in what observers consider to be looking at them. We suggest that this line of inquiry can offer further insight into the perception of gaze direction, and how this perception may differ in clinical populations.

Keywords: gaze perception; person perception; social cognition.


Conflict of interest statement

We have no competing interests.

Figures

Figure 1
Figure 1
Psychophysical model of the cone of direct gaze, and transformations. (a) The cone of direct gaze model, where presented gaze deviations form a Gaussian probability distribution on an internal axis of gaze deviation. The boundaries L and R on the internal axis are used to decide whether to respond ‘left', ‘direct', or ‘right’. Here, the likelihood of the observer responding ‘left’ is represented by the grey area under the Gaussian distribution, the likelihood of responding ‘direct’ is the white area, and the observer will not respond ‘right' to this gaze deviation. (b) Increased noise (either external or internal noise) is represented as an increased standard deviation of the Gaussian distribution, creating more variable responses. (c) Wider category boundaries will allow the observer to accept a wider range of gaze deviations as looking directly at them. (d) Less overestimation, the observer perceives the gaze deviation as more direct and the distribution shifts towards subjective direct gaze. Although the category boundaries remain in the same location on the internal axis, they differ with respect to the actual presented gaze deviation.
Figure 2
Figure 2
Trial procedure for each task. The top set shows an example estimation task trial, demonstrating 0% opacity sunglasses. The bottom set shows an example categorization task trial, illustrating the approximate moderate opacity (99.7%) sunglasses. Stimuli were the same across tasks. Response cues not to scale with stimuli.
Figure 3
Figure 3
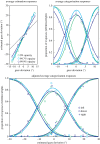
Average responses in the estimation and categorization tasks. Solid lines show the implemented analysis described above, fit to the actual data points shown in markers. The grey line in the estimation graph indicates veridical responding (a slope of 1), an increased slope reflects the overestimation effect. The adjusted average plots the categorization responses against the estimated gaze deviation from the estimation task. The widths of the x-axes of the two categorization graphs equate perceived and actual gaze deviations; however, the x-axis of the estimation responses is relatively contracted.
Figure 4
Figure 4
The effect of opacity on measures in the categorization and estimation tasks. Error bars show 95% within subjects confidence intervals.
Figure 5
Figure 5
Width of the cone of direct gaze measured with actual gaze deviation and estimated gaze deviation. Widths (in degrees) based on estimated gaze deviation (from the estimation task) are the lighter, larger bars. Error bars show the 95% within subject confidence intervals.
Figure 6
Figure 6
Cone of direct gaze relative to the observer. The calculated values are based on the average cone widths, taking into account the viewing distance of the observer (57 cm). The green cone shows the width measured with the actual deviations presented to the observer, the blue cone shows the width measured by the perceived deviation, based on the estimation responses. The vertical extent of the cone of direct gaze has not been measured here, although there is some evidence that the vertical extent may be similar to the horizontal extent [33] and overestimation has also been demonstrated for vertical gaze deviations [21].

References

    1. Senju A, Johnson MH. 2009. The eye contact effect: mechanisms and development. Trends Cogn. Sci. 13, 127–134. (10.1016/j.tics.2008.11.009) - DOI - PubMed
    1. Hamilton AF. 2016. Gazing at me: the importance of social meaning in understanding direct-gaze cues. Phil. Trans. R. Soc. B 371, 20150080 (10.1098/rstb.2015.0080) - DOI - PMC - PubMed
    1. Farroni T, Csibra G, Simion F, Johnson MH. 2002. Eye contact detection in humans from birth. Proc. Natl Acad. Sci. USA 99, 9602–9605. (10.1073/pnas.152159999) - DOI - PMC - PubMed
    1. von Grünau M, Anston C. 1995. The detection of gaze direction: a stare-in-the-crowd effect. Perception 24, 1297–1313. (10.1068/p241297) - DOI - PubMed
    1. Stein T, Senju A, Peelen MV, Sterzer P. 2011. Eye contact facilitates awareness of faces during interocular suppression. Cognition 119, 307–311. (10.1016/j.cognition.2011.01.008) - DOI - PMC - PubMed

LinkOut - more resources