The contributions of ankle, knee and hip joint work to individual leg work change during uphill and downhill walking over a range of speeds
- PMID: 30225047
- PMCID: PMC6124028
- DOI: 10.1098/rsos.180550
The contributions of ankle, knee and hip joint work to individual leg work change during uphill and downhill walking over a range of speeds
Abstract
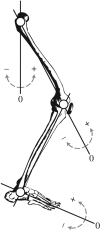
The muscles surrounding the ankle, knee and hip joints provide 42, 16 and 42%, respectively, of the total leg positive power required to walk on level ground at various speeds. However, each joint's contribution to leg work when walking up/downhill at a range of speeds is not known. Determining each biological joint's contribution to leg work over a range of speeds and slopes can inform the design of biomimetic assistive devices (i.e. prostheses). Twenty healthy adults walked 1.00, 1.25 and 1.50 m s-1 on 0°, ±3°, ±6° and ±9° while we collected kinematic and kinetic data. We calculated sagittal plane joint work and individual leg work over the entire stance phase. The ratio of ankle joint to total individual leg positive work (summed ankle, knee and hip joint work) did not change (0.42) with speed or slope, but the ratio of ankle joint to individual leg negative work was 0.38 at -9°, 0.42 at 0° and 0.27 at +9° across all speeds. The ratio of ankle joint to total individual leg negative work was 0.41 at 1.00 m s-1 and 0.32 at 1.50 m s-1 across all slopes. The ratio of knee joint to total individual positive leg work (0.22) did not change with speed or slope. The ratio of knee joint to total individual leg negative work was 0.39 at 1.00 m s-1 and 0.45 at 1.50 m s-1 across all slopes. The ratio of hip joint to total individual leg positive work did not change with speed but was 0.34 at -9°, 0.33 at 0° and 0.37 at +9° across all speeds. The ratio of hip joint to total individual leg negative work was 0.21 at 1.00 m s-1, and 0.24 at 1.50 m s-1 across all slopes and 0.17 at -9°, 0.19 at 0° and 0.29 at +9° across all speeds. The ankle significantly contributes to walking on slopes and this contribution changes during sloped compared with level-ground walking, thus assistive devices that provide biomimetic ankle function must adapt to accommodate walking at different speeds and slopes; whereas assistive biomimetic devices for the knee only need to adapt at different speeds.
Keywords: amputation; biomechanics; gait; prostheses; slope.
Conflict of interest statement
We declare we have no competing interests.
Figures


References
Associated data
Grants and funding
LinkOut - more resources
Full Text Sources
Other Literature Sources
Medical

