Assessing the accumulated stickiness magnitude from fabric-skin friction: effect of wetness level of various fabrics
- PMID: 30225075
- PMCID: PMC6124082
- DOI: 10.1098/rsos.180860
Assessing the accumulated stickiness magnitude from fabric-skin friction: effect of wetness level of various fabrics
Abstract
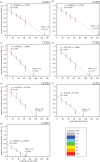
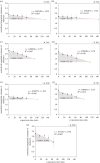
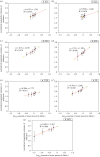
Increasing skin wetness tends to increase fabric-skin adhesion and friction, resulting in wear discomfort or skin injuries. Here, the magnitude estimation approach was used to assess the stickiness sensation perceived in fabrics. Seven fabric types were wetted by putting onto wet 'skin' surface and dried for different durations to achieve different wetness levels, simulating wearing conditions during the recovery period after sweating. Results showed that the relationship between magnitude estimates of stickiness and amount of water present in fabric demonstrated a power function. The exponents and constant from power regression show the growth rate of stickiness sensation with moisture intensity and the perceived stickiness under fixed stimulus intensity, respectively. A novel parameter, accumulated stickiness magnitude (ASM), describing how much discomfort a wetted fabric offered throughout the drying period, was developed. Thin cotton fabrics (fabric W01 and W03), having higher saturation level after contacting with wetted skin surface, arouse stronger stickiness feeling and their ASM is remarkably higher. The difference in stickiness estimates is due to the difference in chemical composition and surface geometry. This study suggests us the way to predict perceived stickiness in fabrics with different wetness levels which is useful for applications like sportswear, intimate apparel or healthcare products.
Keywords: adhesion; fabric; friction; magnitude estimate; stickiness sensation; wet skin.
Conflict of interest statement
We have no competing interests.
Figures


References
-
- Bertaux E, Derler S, Rossi RM, Zeng X, Koehl L, Ventenat V. 2010. Textile, physiological, and sensorial parameters in sock comfort. Text. Res. J. 80, 1803–1810. (10.1177/0040517510369409) - DOI
-
- Toftum J, Rasmussen LW, Mackeprang J, Fanger PO. 2000. Discomfort due to skin humidity with different fabric textures and materials. ASHRAE Trans. 106, 521.
-
- Gwosdow A, Stevens J, Berglund L, Stolwijk J. 1986. Skin friction and fabric sensations in neutral and warm environments. Text. Res. J. 56, 574–580. (10.1177/004051758605600909) - DOI
-
- Gupta D, Chaudhary H, Gupta C. 2015. Sericin-based polyester textile for medical applications. J. Text. Inst. 106, 366–376. (10.1080/00405000.2014.922244) - DOI
LinkOut - more resources
Full Text Sources
Other Literature Sources
