. 2018 Aug 29;5(4):ENEURO.0293-18.2018.
doi: 10.1523/ENEURO.0293-18.2018. eCollection 2018 Jul-Aug.

Human Rapid Eye Movement Sleep Shows Local Increases in Low-Frequency Oscillations and Global Decreases in High-Frequency Oscillations Compared to Resting Wakefulness

Affiliations

Human Rapid Eye Movement Sleep Shows Local Increases in Low-Frequency Oscillations and Global Decreases in High-Frequency Oscillations Compared to Resting Wakefulness

Benjamin Baird et al. eNeuro. .

Abstract

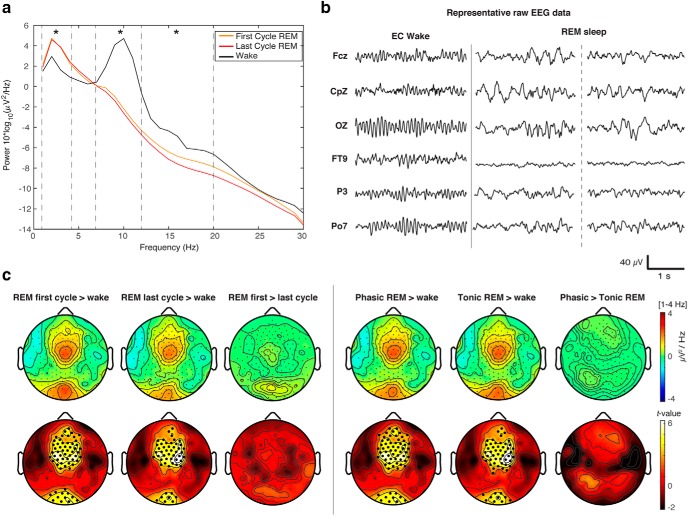
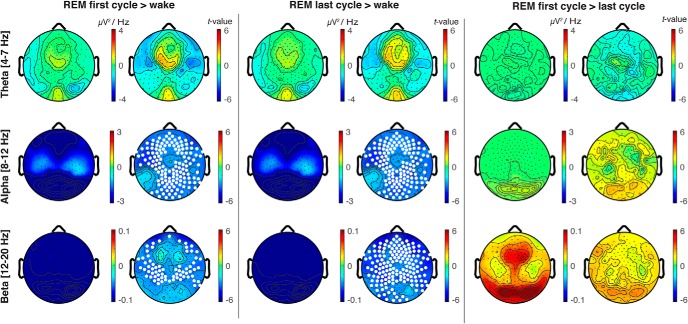
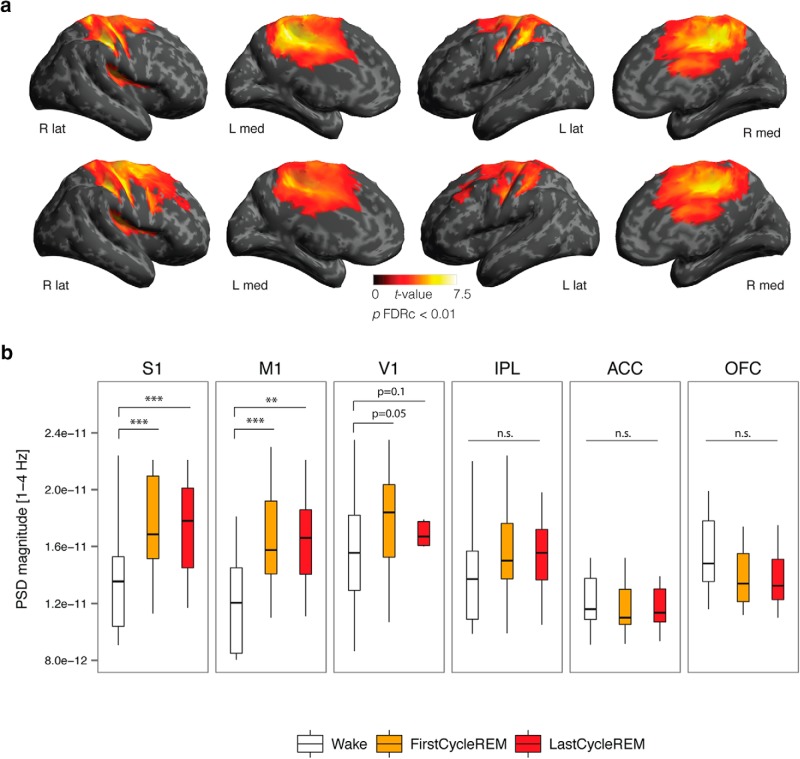
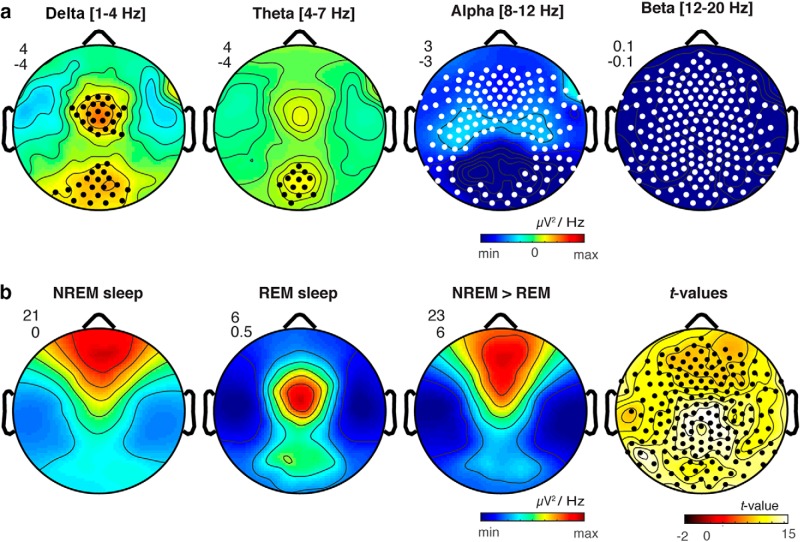
It is often assumed that during rapid eye movement (REM) sleep the cerebral cortex homogenously shows electroencephalogram (EEG) activity highly similar to wakefulness. However, to date no studies have compared neural oscillatory activity in human REM sleep to resting wakefulness with high spatial sampling. In the current study, we evaluated high-resolution topographical changes in neural oscillatory power between both early and late naturalistic REM sleep and resting wakefulness in adult humans. All-night recordings with 256-channel high-density EEG (hd-EEG) were collected in healthy volunteers (N = 12). Topographic analysis revealed that, compared to wake, both the first and last cycle of REM sleep were associated with increased low-frequency oscillations in local central and occipital regions. In contrast, high-frequency activity in both α and β bands (8-20 Hz) was globally decreased during both early and late REM sleep cycles compared to wakefulness. No significant differences in topographic power in any frequency band were observed between REM sleep cycles occurring early and late in the night. We replicated these findings in an independent dataset (N = 33). Together, our findings show that human REM sleep shows consistent topographical changes in oscillatory power across both early and late sleep cycles compared to resting wakefulness.

Keywords: EEG; REM sleep; sensory disconnection sleep; slow oscillations.


Figures

Figure 1.
Figure 1.
A, Global PSD for the first and last cycle of REM sleep and quiet wakefulness. Group average global power spectra (average of all 185 EEG sensors) separated by state (wake (black line), the first cycle of REM sleep (orange line), and the last cycle of REM sleep (red line). Asterisks indicate significant differences between conditions (p < 0.05; repeated measures ANOVA) for δ (1–4 Hz), θ (4–7 Hz), α (8–12 Hz), and β (12–20 Hz) frequency bands. B, Representative EEG data across scalp regions for eyes-closed (EC) wakefulness and REM sleep. Central region: Fcz, CpZ; occipital region: OZ; other regions: frontotemporal (FT9), parietal (P3, Po7). C, Topography of REM sleep δ power. Left panel, Topographical differences in δ power [1–4 Hz] in the first and last cycle of REM sleep contrasted with wake. Right panel, Topographical differences in δ power [1–4 Hz] in phasic and tonic REM sleep contrasted with wake. Bottom row, t values for all electrodes (two-tailed, paired t test); black dots indicate significant differences between states (p < 0.05) after correcting for multiple comparisons with SNPM cluster size test.
Figure 2.
Figure 2.
EEG topography of REM sleep contrasted with quiet wakefulness in θ, α and β frequency bands. Topographical differences in oscillatory power between the first cycle of REM sleep contrasted with wake (left panel), the last cycle of REM sleep contrasted with wake (central panel), and the first cycle of REM sleep contrasted with the last cycle of REM sleep (right panel) for θ (4–7 Hz), α (8–12 Hz), and β (12–20 Hz) frequency bands; t values are plotted for all electrodes (two-tailed, paired t test); white dots indicate significant differences between states (p < 0.05) after correcting for multiple comparisons with SNPM.
Figure 3.
Figure 3.
A, Source topography of increased δ power [1–4 H] in the first (top row) and last (bottom row) cycle of REM sleep contrasted with wake; t values are plotted for all vertices (two-tailed, paired t test) exhibiting significant differences between states (p < 0.05) after correcting for multiple comparisons using topological FDR cluster correction (height threshold: p < 0.01). B, Compared to wake, increased δ power was observed in primary sensory (S1), primary motor (M1), and primary visual (V1) cortices, but was not significantly increased in IPL, ACC, or OFC associative regions. The bottom and top of the boxes show the 25th and 75th percentiles (the lower and upper quartiles), respectively; the inner band shows the median; and the whiskers show the upper and lower quartiles ±1.5× the interquartile range (IQR). Asterisks indicate significant differences between states (*p < 0.05, **p < 0.01, ***p < 0.001; one-tailed paired t test).
Figure 4.
Figure 4.
A, Replication study. Scalp topography of differences in oscillatory power between REM sleep contrasted with wakefulness in a replication sample (N = 33) for δ (1–4 Hz), θ (4–7 Hz), α (8–12 Hz), and β (12–20 Hz) frequency bands. Black dots indicate significantly increased power in REM sleep compared to wakefulness; white dots indicate significant decreases in REM sleep compared to wakefulness (SNPM cluster corrected p < 0.05). B, Comparison of REM and NREM δ power. Scalp topography of δ power shown separately for NREM sleep, REM sleep, and NREM > REM sleep as well as t values for NREM > REM sleep δ power. The minimum and maximum values for each topographic map are plotted with the corresponding numeric range for the color scale shown in the upper left. Black dots indicate significantly increased power in REM sleep compared to wakefulness (SNPM cluster corrected p < 0.05).

References

    1. Amunts K, Schleicher A, Zilles K (2007) Cytoarchitecture of the cerebral cortex—more than localization. Neuroimage 37:1061–1065. 10.1016/j.neuroimage.2007.02.037 - DOI - PubMed
    1. Armitage R (1995) The distribution of EEG frequencies in REM and NREM sleep stages in healthy young adults. Sleep 18:334–341. - PubMed
    1. Aserinsky E, Kleitman N (1953) Regularly occurring periods of eye motility, and concomitant phenomena, during sleep. Science 118:273–274. - PubMed
    1. Bernardi G, Siclari F, Yu X, Zennig C, Bellesi M, Ricciardi E, Cirelli C, Ghilardi MF, Pietrini P, Tononi G (2015) Neural and behavioral correlates of extended training during sleep deprivation in humans: evidence for local, task-specific effects. J Neurosci 35:4487–4500. 10.1523/JNEUROSCI.4567-14.2015 - DOI - PMC - PubMed
    1. Borbély AA, Achermann P (1999) Sleep homeostasis and models of sleep regulation. J Biol Rhythms 14:557–568. 10.1177/074873099129000894 - DOI - PubMed

Publication types