. 2018 Dec 3;128(12):5280-5293.
doi: 10.1172/JCI94307. Epub 2018 Oct 22.

A carnosine analog mitigates metabolic disorders of obesity by reducing carbonyl stress

Affiliations

A carnosine analog mitigates metabolic disorders of obesity by reducing carbonyl stress

Ethan J Anderson et al. J Clin Invest. .

Abstract

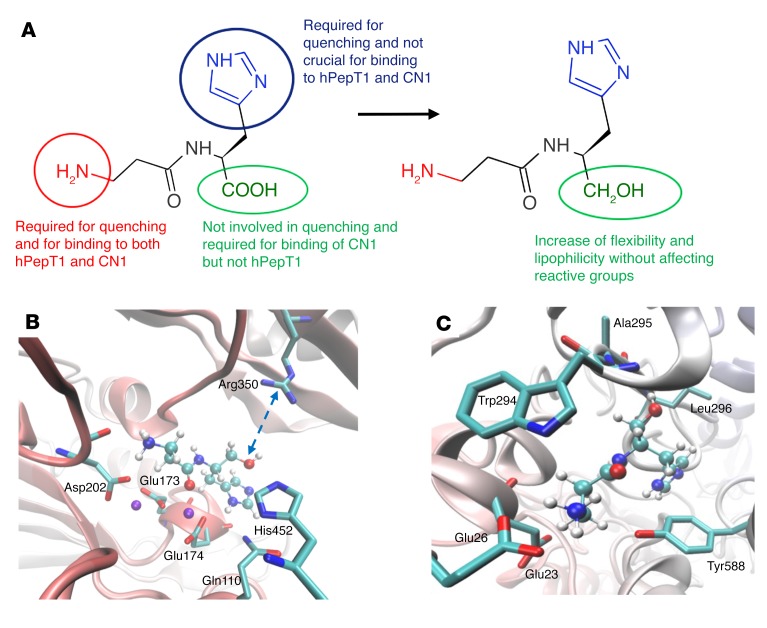
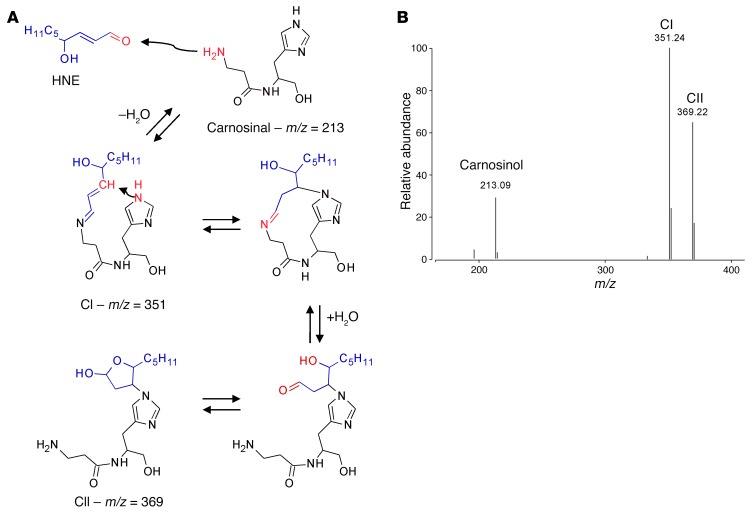
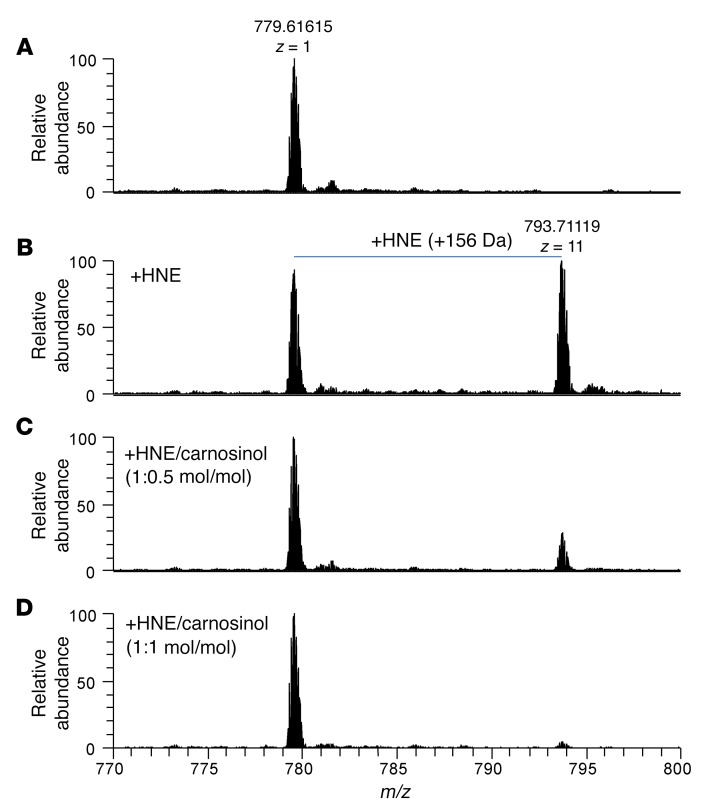
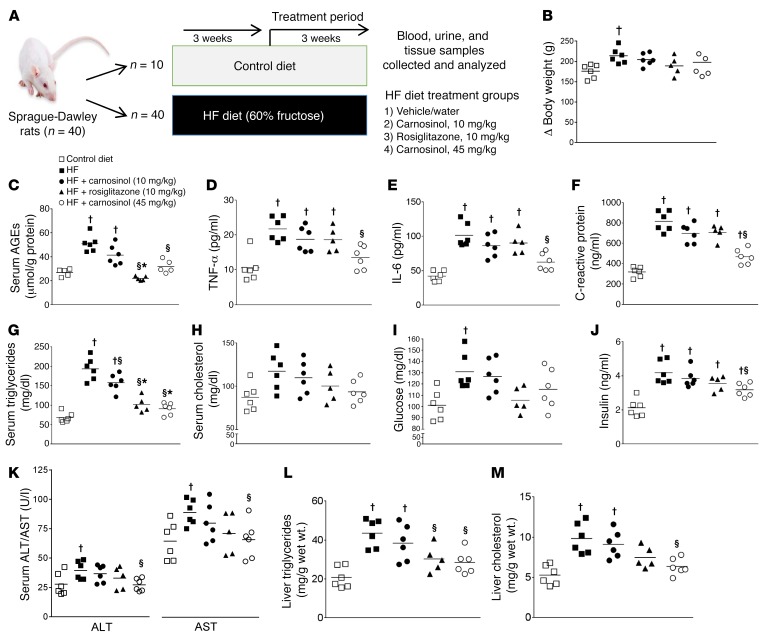
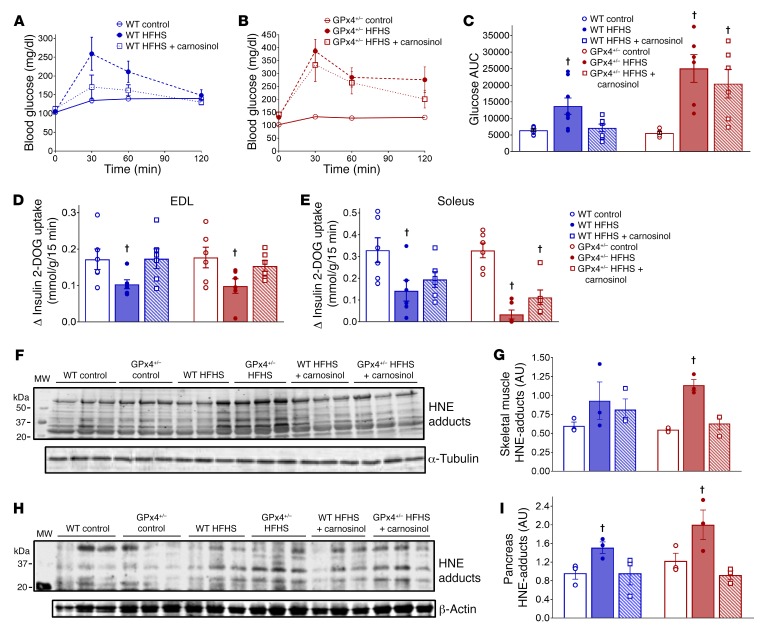
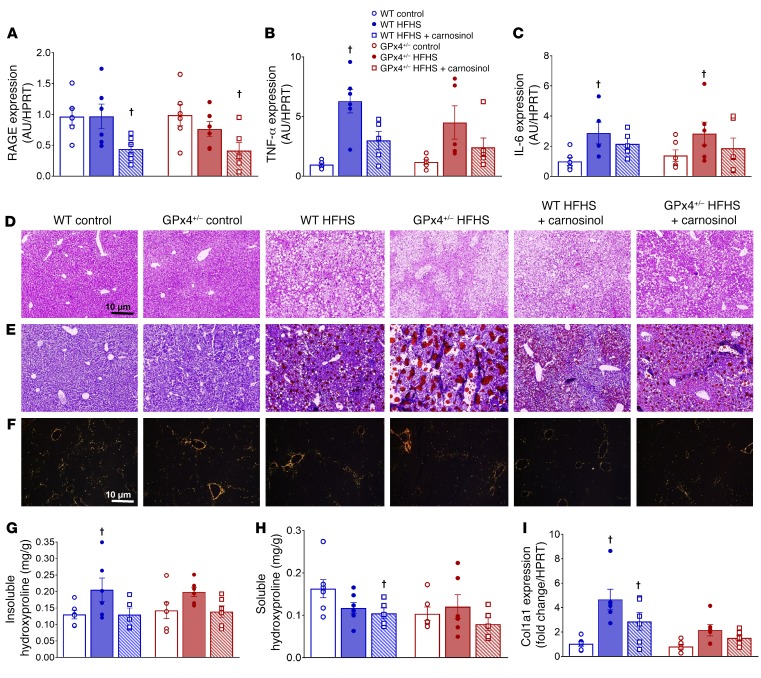
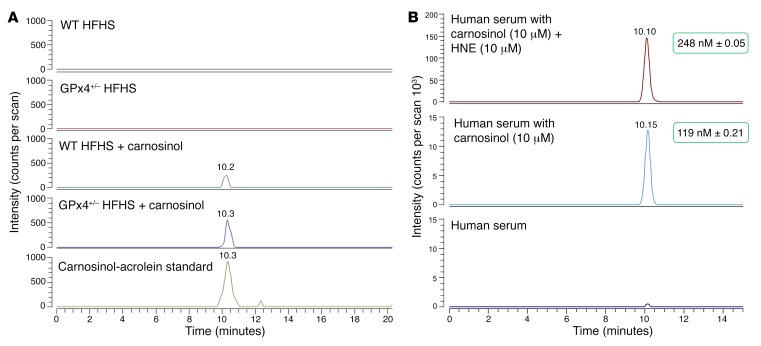
Sugar- and lipid-derived aldehydes are reactive carbonyl species (RCS) frequently used as surrogate markers of oxidative stress in obesity. A pathogenic role for RCS in metabolic diseases of obesity remains controversial, however, partly because of their highly diffuse and broad reactivity and the lack of specific RCS-scavenging therapies. Naturally occurring histidine dipeptides (e.g., anserine and carnosine) show RCS reactivity, but their therapeutic potential in humans is limited by serum carnosinases. Here, we present the rational design, characterization, and pharmacological evaluation of carnosinol, i.e., (2S)-2-(3-amino propanoylamino)-3-(1H-imidazol-5-yl)propanol, a derivative of carnosine with high oral bioavailability that is resistant to carnosinases. Carnosinol displayed a suitable ADMET (absorption, distribution, metabolism, excretion, and toxicity) profile and was determined to have the greatest potency and selectivity toward α,β-unsaturated aldehydes (e.g., 4-hydroxynonenal, HNE, ACR) among all others reported thus far. In rodent models of diet-induced obesity and metabolic syndrome, carnosinol dose-dependently attenuated HNE adduct formation in liver and skeletal muscle, while simultaneously mitigating inflammation, dyslipidemia, insulin resistance, and steatohepatitis. These improvements in metabolic parameters with carnosinol were not due to changes in energy expenditure, physical activity, adiposity, or body weight. Collectively, our findings illustrate a pathogenic role for RCS in obesity-related metabolic disorders and provide validation for a promising new class of carbonyl-scavenging therapeutic compounds rationally derived from carnosine.

Keywords: Diabetes; Drug therapy; Endocrinology; Metabolism; Obesity.


Conflict of interest statement

Conflict of interest: GA, GV, and M. Carini of the University of Milan and Flamma S.p.A. are co-inventors on the patent “Amino alcohol derivatives and their therapeutic activities” (patent nos. EP 2519507B1 and US 8623900B2), which includes carnosinol. RC and SG are employees of Flamma S.p.A., the manufacturer of carnosinol.

Figures

Figure 1
Figure 1. In silico models and biochemistry of carnosinol metabolism.
(A) Structure-activity relationships for l-carnosine and comparison with carnosinol. (B) Putative complex between carnosinol and CN1, highlighting the missing ion pair with Arg350 when compared with the corresponding complex for l-carnosine. (C) Putative complex between carnosinol and hPepT1, revealing that the inserted hydroxyl group elicits H-bonds similar to those already observed for l-carnosine.
Figure 2
Figure 2. Carnosinol is a selective sequestering agent of HNE.
(A) Proposed reaction mechanism of carnosinol (m/z = 213) with HNE (MW = 156 kDa). Carnosinol, like l-carnosine, reacts with HNE through a 2-step mechanism. The reaction starts with the formation of a reversible Schiff base (an α,β-unsaturated imine, CI) to yield the macrocyclic adduct through an intramolecular Michael addition, which hydrolyzes to form the stable hemiacetal derivative CII. (B) Mass spectrum of the reaction mixture of carnosinol with HNE incubated for 24 hours at 37°C, characterized by the peaks at m/z = 213, attributed to the carnosinol; m/z = 351, attributed to the Schiff base (CI); and m/z = 369, attributed to the Michael adduct (CII).
Figure 3
Figure 3. Carnosinol inhibits HNE-induced ubiquitin carbonylation.
(A) MS spectrum of ubiquitin control sample focusing on the z = 11 multicharged ion peak at m/z = 779; (B) 11+ peaks obtained upon incubation of ubiquitin with HNE, corresponding to unmodified (m/z = 779) and HNE-modified (m/z = 793) forms of the protein. (C and D) 11+ peaks obtained upon incubation of ubiquitin with HNE and carnosinol at 2 different molar ratios: HNE/carnosinol 1:0.5 mol/mol (C) and HNE/carnosinol 1:1 mol/mol (D), showing reduced intensity for the peak corresponding to the modified protein (m/z = 793).
Figure 4
Figure 4. Dose-dependent mitigation of inflammation and metabolic disease parameters by carnosinol in HF diet–fed rats.
(A) Study design for HF diet–induced metabolic disease in a rat model. The effect of either a HF diet alone or in combination with low-dose (10 mg/kg) or high-dose (45 mg/kg) carnosinol or rosiglitazone in the drinking water on overall changes in body weight (B) and the levels of serum AGEs (C), TNF-α (D), IL-6 (E), C-reactive protein (F), triglycerides (G), cholesterol (H), glucose (I), and insulin (J). Serum alanine aminotransferase (ALT) and aspartate aminotransferase (AST) (K), along with liver triglycerides (L) and liver cholesterol (M) levels, are also shown. P < 0.01 versus control diet; §P < 0.01 versus HF diet alone; *P < 0.01 versus HF plus carnosinol (10 mg/kg); 1-way ANOVA using a Newman-Keuls post hoc test for multiple comparisons (n = 6).
Figure 5
Figure 5. Therapeutic effect of carnosinol on metabolic homeostasis and carbonyl stress in mouse models of diet-induced obesity.
The effect of a HFHS diet with and without carnosinol treatment is shown for glucose tolerance (AC, n = 8) and insulin sensitivity of EDL (D) and soleus muscle (E) tissue upon termination of the study for each group (n = 6). Representative immunoblots for HNE adducts in whole-tissue homogenates prepared from mixed gastrocnemius skeletal muscle (F) and pancreas (H) tissue (n = 3 mice per group), along with the corresponding densitometric analysis (G and I). P < 0.01 versus control diet within each respective genotype. A 2-way ANOVA followed by Tukey’s multiple comparisons test was used to test for the main effect of the treatment within each genotype.
Figure 6
Figure 6. Carnosinol effect on liver inflammation and steatosis in mouse models of diet-induced obesity.
Expression of the proinflammatory genes RAGE (A), TNF-α (B), and IL-6 (C) in the livers of mice from each treatment group was determined by quantitative reverse transcription PCR (qRT-PCR). Representative images of liver histology showing H&E staining (D), oil red O staining of triglycerides (E), and Picrosirius red staining under polarized light for collagen/fibrosis (F) in mice from each treatment group. Original magnification, ×100; scale bars: 10 μm. Both insoluble (G) and soluble (H) forms of liver hydroxyproline were quantified, along with expression of collagen 1a1 (Col1a1), determined by qRT-PCR (I). Quantified data are shown as the mean ± SEM (n = 6/group). P < 0.01 versus control diet for each respective genotype. A 2-way ANOVA followed by Tukey’s multiple comparisons test was used to test for the main effect of treatment within each genotype.
Figure 7
Figure 7. Pharmacodynamics and aldehyde-scavenging capacity of carnosinol.
LC-MS analyses were performed on pooled, prepared liver homogenates from WT and GPx4+/– mice from each of the treatment groups. (A) Single-ion chromatograms of the carnosinol-ACR adduct (269.16082 m/z, ± 1 ppm). The bottom trace in A is the reference standard used in this analysis and was prepared by spiking rat liver homogenate with 0.5 μM carnosinol-ACR adduct. (B) LC-MS analysis showing the single-ion chromatogram of carnosinol-HNE adducts in human serum spiked with carnosinol and HNE (top), carnosinol only (middle), and serum only. Values shown in the green boxes denote the corresponding concentration of these adducts.

Comment in

References

    1. Uribarri J, et al. Dietary advanced glycation end products and their role in health and disease. Adv Nutr. 2015;6(4):461–473. doi: 10.3945/an.115.008433. - DOI - PMC - PubMed
    1. Schmidt AM, Yan SD, Stern DM. The dark side of glucose. Nat Med. 1995;1(10):1002–1004. doi: 10.1038/nm1095-1002. - DOI - PubMed
    1. Cho SJ, Roman G, Yeboah F, Konishi Y. The road to advanced glycation end products: a mechanistic perspective. Curr Med Chem. 2007;14(15):1653–1671. doi: 10.2174/092986707780830989. - DOI - PubMed
    1. Palimeri S, Palioura E, Diamanti-Kandarakis E. Current perspectives on the health risks associated with the consumption of advanced glycation end products: recommendations for dietary management. Diabetes Metab Syndr Obes. 2015;8:415–426. - PMC - PubMed
    1. Van Puyvelde K, Mets T, Njemini R, Beyer I, Bautmans I. Effect of advanced glycation end product intake on inflammation and aging: a systematic review. Nutr Rev. 2014;72(10):638–650. doi: 10.1111/nure.12141. - DOI - PubMed

Publication types

MeSH terms