Review
. 2019 Apr;20(4):405-419.
doi: 10.1016/j.jpain.2018.08.009. Epub 2018 Sep 15.

Contributions of Nociresponsive Area 3a to Normal and Abnormal Somatosensory Perception

Affiliations
Review

Contributions of Nociresponsive Area 3a to Normal and Abnormal Somatosensory Perception

Barry L Whitsel et al. J Pain. 2019 Apr.

Abstract

Traditionally, cytoarchitectonic area 3a of primary somatosensory cortex (SI) has been regarded as a proprioceptive relay to motor cortex. However, neuronal spike-train recordings and optical intrinsic signal imaging, obtained from nonhuman sensorimotor cortex, show that neuronal activity in some of the cortical columns in area 3a can be readily triggered by a C-nociceptor afferent drive. These findings indicate that area 3a is a critical link in cerebral cortical encoding of secondary/slow pain. Also, area 3a contributes to abnormal pain processing in the presence of activity-dependent reversal of gamma-aminobutyric acid A receptor-mediated inhibition. Accordingly, abnormal processing within area 3a may contribute mechanistically to generation of clinical pain conditions. PERSPECTIVE: Optical imaging and neurophysiological mapping of area 3a of SI has revealed substantial driving from unmyelinated cutaneous nociceptors, complementing input to areas 3b and 1 of SI from myelinated nociceptors and non-nociceptors. These and related findings force a reconsideration of mechanisms for SI processing of pain.

Keywords: C-nociception; gamma-aminobutyric acid reversal; pain affect; secondary pain; somatosensory cortex.


Conflict of interest statement

DISCLOSURES: The authors have no conflicts of interest to declare.

Figures

FIGURE 1.
FIGURE 1.. Location of area 3a in different mammalian species.
Shown are the surface views of the cerebral cortex and representative sections. Section locations are indicated on the views by dashed lines. CS – central sulcus. A: human cortex view and coronal section. B: macaque cortex view and sagittal section. C: cat cortex view and sagittal section. D: surface view of the rat sensorimotor cortex and its location on the cerebral hemisphere. In rat SI, the dysgranular zone (DZ) and the transitional zone (tz) are proposed to be homologs of area 3a in nonrodent mammals, , , , , whereas the granular zone (GZ) is a homolog of area 3b and the lateral agranular cortex (AGl) is the primary motor cortex. Portions of Figure 1 have been reproduced with permission. (Adapted from: human; macaque; cat; rat)
FIGURE 2.
FIGURE 2.. An exemplary nociresponsive area 3a neuron.
A: Photograph of the surface of squirrel monkey right hemisphere. Dots anterior to the central sulcus (CS) mark locations of microelectrode penetrations that sampled the spike firing of area 3a neurons responsive to noxious stimulation of the contralateral hand (lateral group of dots) or foot (medial dots). LF – lateral fissure. B: Photomicrograph of a Nissl-stained parasagittal section showing an electrolytic lesion (indicated by open arrow) at the site where spike firing activity of an individual nociresponsive area 3a neuron was recorded. Filled arrows identify the 3b/3a and 3a/4 boundaries. Note progressive thinning of layer IV, which starts at the 3b/3a border, and ends at the 3a/4 border, as well as the presence of large pyramidal cells in layer V in the anterior third of area 3a (marked with a horizontal two-headed arrow)—the locus where this exemplary neuron was recorded. C: Higher-power image showing cytoarchitectural details in the vicinity of the electrolytic lesion. Tic marks on the left (posterior) and right (anterior) edges indicate boundaries between layers III, IV, and V. D: Spike firing response of this area 3a neuron to intradermal injection of α,β methylene ATP (a potent algogen) at a site within its receptive field. Arrow – time of injection. Note prominent elevation of spike firing which persisted for ~13s and then transitioned to an irregular, and prolonged elevation of mean firing rate (MFR). E: Superimposed PST histograms showing the same neuron’s spike firing response to nonnoxious (25˚C) skin indentation before and after intracutaneous injection of α,β methylene ATP. Note the strengthening of this neuron’s response to mechanical stimulation that occurred subsequent to algogen injection. (Reproduced with permission)
Figure 3.
Figure 3.. Optical intrinsic signal imaging response of SI cortex to thermoneutral vs. thermonoxious vibrotactile stimulation.
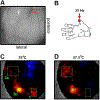
A: Dorsal surface of SI cortex of a squirrel monkey with the location of responses to stimulation (red spot). B: Site on contralateral digit 1 exposed to 5s vibrotactile stimulation delivered via a temperature-controlled contactor. C: Averaged SI activity pattern evoked by a neutral contactor temperature of 38°C. Green rectangles indicate regions of interest in areas 3a, 3b, and 1. Note the prominent response in areas 3b and 1. D: Averaged SI activity pattern evoked at a noxious contactor temperature of 47.5°C. Note that raising the contactor temperature led to emergence of a response in area 3a, while significantly reducing the response in area 3b and completely abolishing it in area 1.
FIGURE 4.
FIGURE 4.. Exemplary recordings from rat transitional zone, TZ.
A: Cytochrome oxidasestained tangential section of a rat’s somatosensory cortex. PMBSF – posterior medial barrel subfield representation of mystacial vibrissae. FBS – forelimb barrel subfield. HBS – hindlimb barrel subfield. The arrow points at an electrolytic lesion made in a microelectrode penetration in TZ. B: A representative examples of raw neuroelectrical activity recorded at the TZ site before, during, and after submerging the contralateral forepaw in either noxious 50°C or non-noxious 45οC water (the stimulus period is marked by the black bar). The 50°C bath evoked vigorous spike discharging activity, with a 2-sec delay after forepaw submersion and also around the time of forepaw extraction and for 3 sec thereafter. In contrast, the 45°C water bath did not evoke any response. C: An example of a single-unit TZ recording from another rat showing the buildup of response after submerging the contralateral forepaw in the heated water bath, but not after submersion in the warm water bath. Note the delayed and long post stimulus firing in response to thermonoxious stimulation.
Figure 5.
Figure 5.. Exemplary neuroelectric activity recorded in superficial dorsal horn of the spinal cord before, during (red bar), and after submerging the ipsilateral hindpaw in a heated water bath before and after ablation of contralateral TZ.
Left: Representative examples of raw neuroelectric activity recorded in the superficial dorsal horn in response to 50°C thermonoxious vs. 41°C thermoneutral stimulation. Center: Cytochrome oxidase-stained tangential section of the contralateral sensorimotor cortex showing the site and extent of TZ ablation by cauterization. Right: Representative responses to thermonoxious vs. thermoneutral stimulation, recorded at the same dorsal horn site 30min after the contralateral TZ ablation.
Figure 6.
Figure 6.
Diagram of circuitry linking somatosensory cortex with dorsal horn region that processes C-nociceptor afferent drive.
Figure 7:
Figure 7:. Optical intrinsic signal imaging of SI responses to non-noxious vibrotactile stimulation before and after the intradermal injection of the algesic chemical formalin.
A: Dorsal surface of SI cortex of a squirrel monkey. B: Site on contralateral hand exposed to 5s vibrotactile stimulation at the neutral contactor temperature of 25°C and the location of formalin injection. C: Averaged SI activity pattern evoked before formalin injection. D: Averaged SI activity pattern evoked 50–60min after injecting 5% formalin at a skin site located 3cm from the stimulated site. Note that before the formalin injection, non-noxious flutter stimulation evoked a local response at the border between areas 3b and 1. However, 1hr after the injection the flutter stimulus activated a much larger SI territory in the vicinity of the border between areas 3b and 1, as well as in area 3a.
Figure 8.
Figure 8.. Depolarizing effect of GABA in actively driven cortical columns.
A: Experimental design. A bipolar electrode (E-labeled black circle) placed at the layer VI-white matter junction was used to activate a cortical column-shaped region (delineated by enclosed rectangle) in a rat sensorimotor slice preparation. A series of 20 2mA electrical pulses at 20Hz was delivered. A pyramidal cell (shown as a triangle) was isolated with a whole-cell patch clamp recording electrode in the upper layers, radially aligned with the stimulating electrode. The tip of a GABAcontaining micropipette was placed in close proximity to the recorded neuron. GABA was repeatedly pressure-ejected from the micropipette following electrical stimulation of the column. B: Representative example of an optical intrinsic signal imaging response to 20Hz electrical stimulation, revealing activation of a column-shaped cortical region. C: GABA’s effect on an exemplary pyramidal neuron before and after 20 Hz electrical stimulation of the host cortical column. The top trace shows that GABA puff applications before such ―conditioning‖ stimulation hyperpolarized the neuron’s membrane potential (P-labeled dots below the trace indicate time of each GABA puff release). The bottom trace shows that for 20 seconds after 1 second activation of the column by 20Hz conditioning electrical stimulation, GABA puff applications prominently depolarized, rather than hyperpolarized, the neuron’s membrane potential (C-labeled filled box indicates the duration of electrical stimulation). D: Responses of 16 upper-layer pyramidal neurons to a train of GABA puffs. Amplitude of the response of each neuron to GABA is plotted as a function of time of each puff in series delivered before or after 20Hz conditioning electrical stimulation. The plot shows that for 15sec subsequent to the conditioning electrical stimulation of the column, GABA puffs produce prominent neuronal depolarization, whereas prior to such conditioning stimulation GABA puffs produced neuronal hyperpolarization. (Reproduced from)

Similar articles

Cited by

References

    1. Aasvang EK, Gmaehle E, Hansen JB, Gmaehle B, Forman JL, Schwarz J, Bittner R, Kehlet H: Predictive risk factors for persistent posthernioectomy pain. Anesthesiol. 112:957–969, 2010 - PubMed
    1. Aderjan D, Stankewitz A, May A: Neuronal mechanisms during repetitive trigemino-nociceptive stimulation in migraine patients. Pain. 151:97–103, 2010 - PubMed
    1. Akbarian S, Grusser OJ, Guldin WO: Thalamic connections of the vestibular cortical fields in the squirrel monkey (Saimiri sciureus). J. Comp. Neurol 326:423–441, 1992 - PubMed
    1. Andreou AP, Goadsby PJ: Topiramate in the treatment of migraine: A kinate (glutamate) receptor antagonist within the trigeminothalamic pathway. Cephalagia. 31: 1343–1358, 2011 - PubMed
    1. Artemenko AR, Kurenkov AL, Filatova SS, Kaube H, Katsarava Z: Effects of topiramate on migraine frequency and cortical excitability in patients with frequent migraine. Cephalagia. 28:203–208, 2008. - PubMed

Publication types

MeSH terms