. 2018 Dec 7:13:16-28.
doi: 10.1016/j.omtn.2018.08.007. Epub 2018 Aug 18.

The IS2 Element Improves Transcription Efficiency of Integration-Deficient Lentiviral Vector Episomes

Affiliations

The IS2 Element Improves Transcription Efficiency of Integration-Deficient Lentiviral Vector Episomes

Sabina Sánchez-Hernández et al. Mol Ther Nucleic Acids. .

Abstract

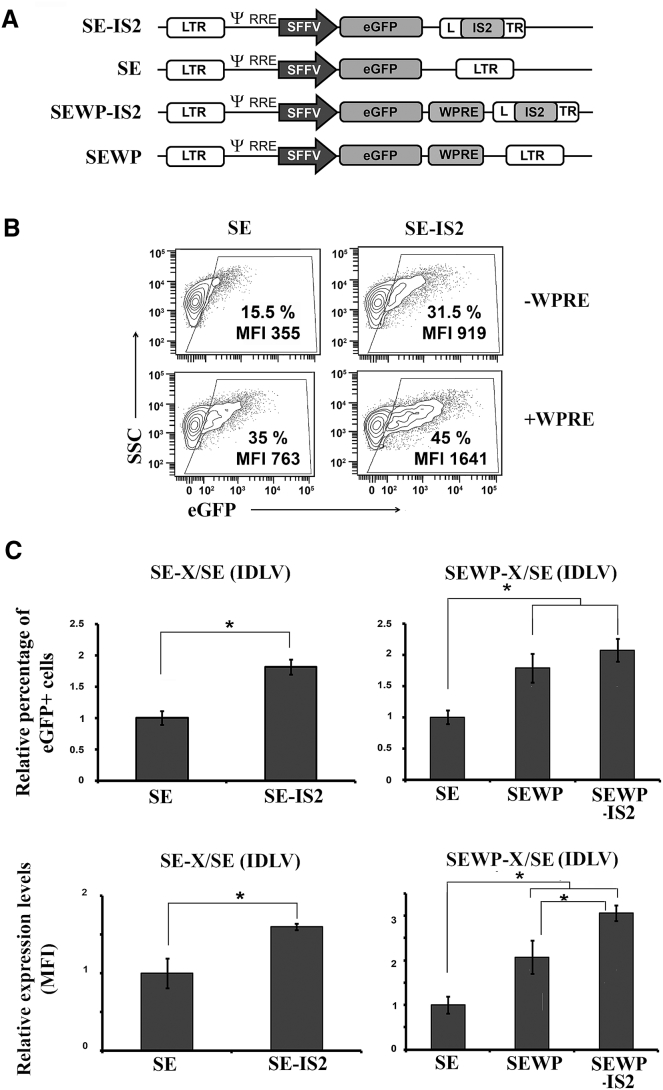
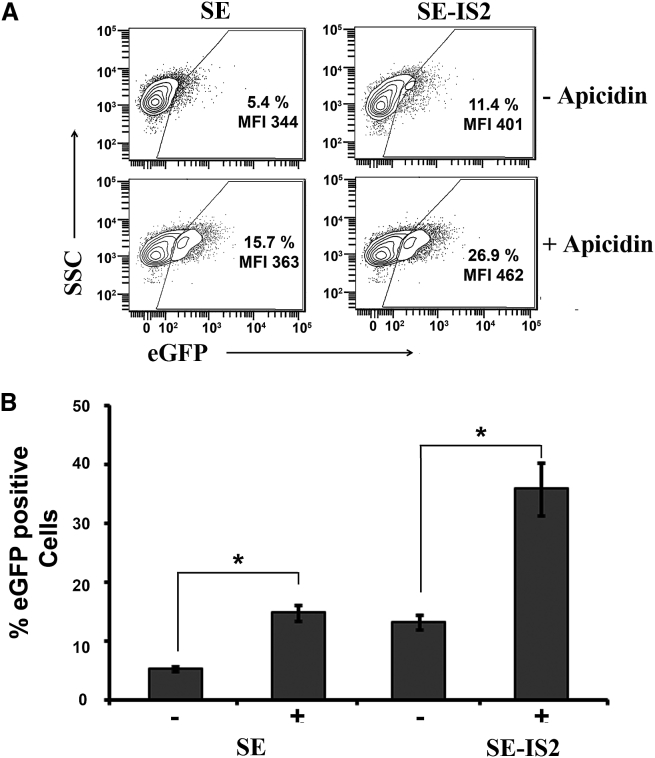
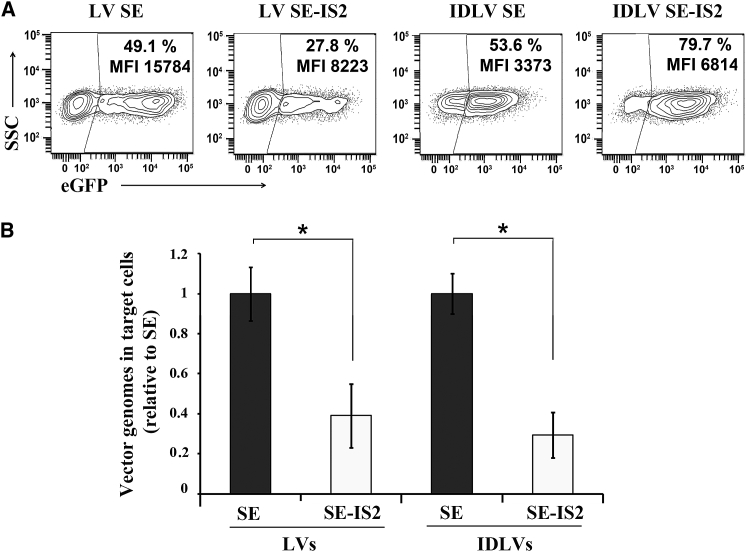
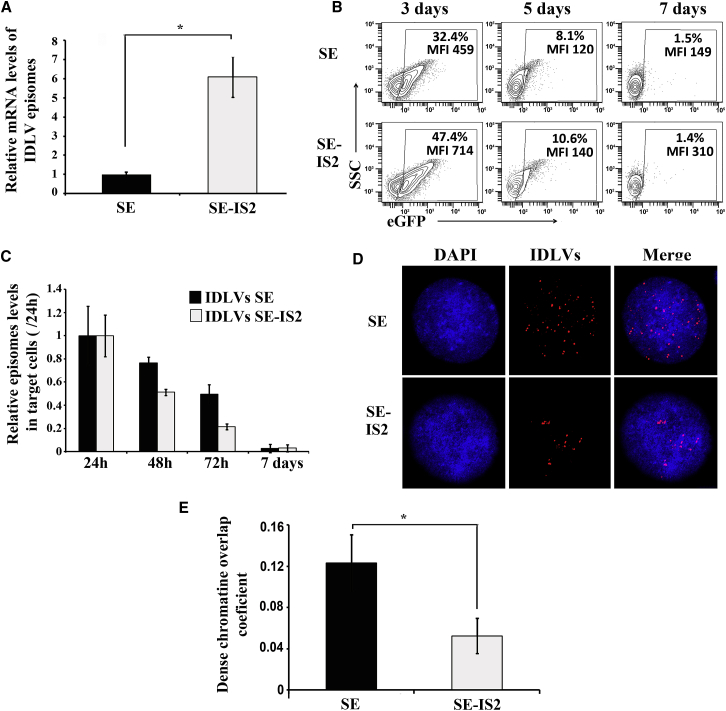
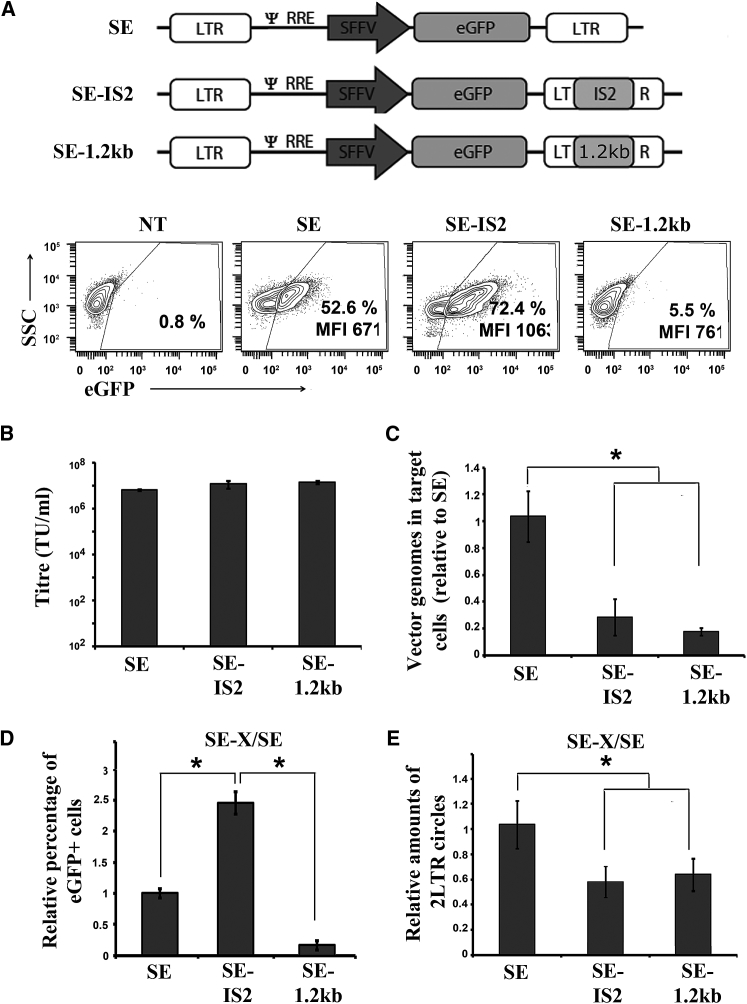
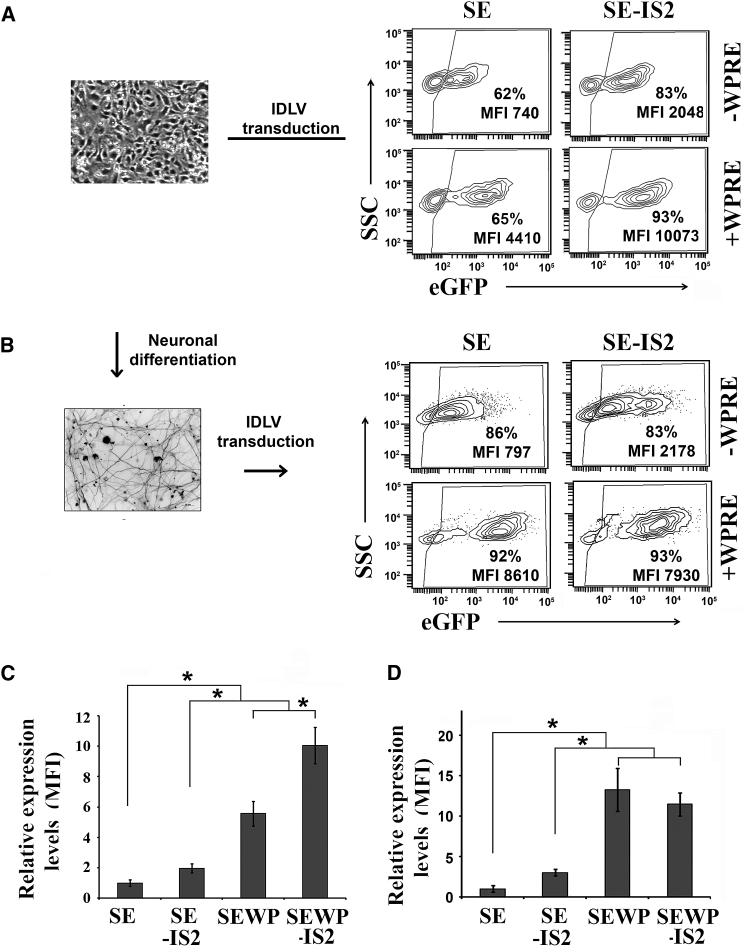
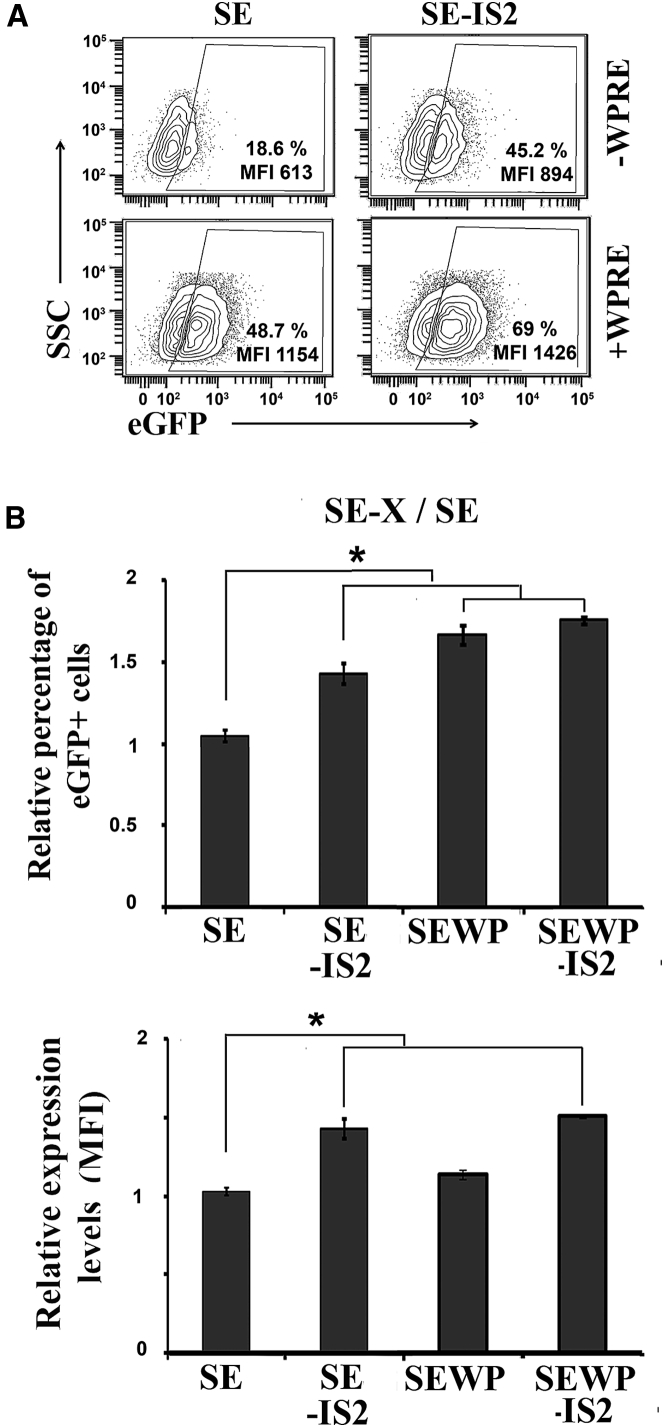
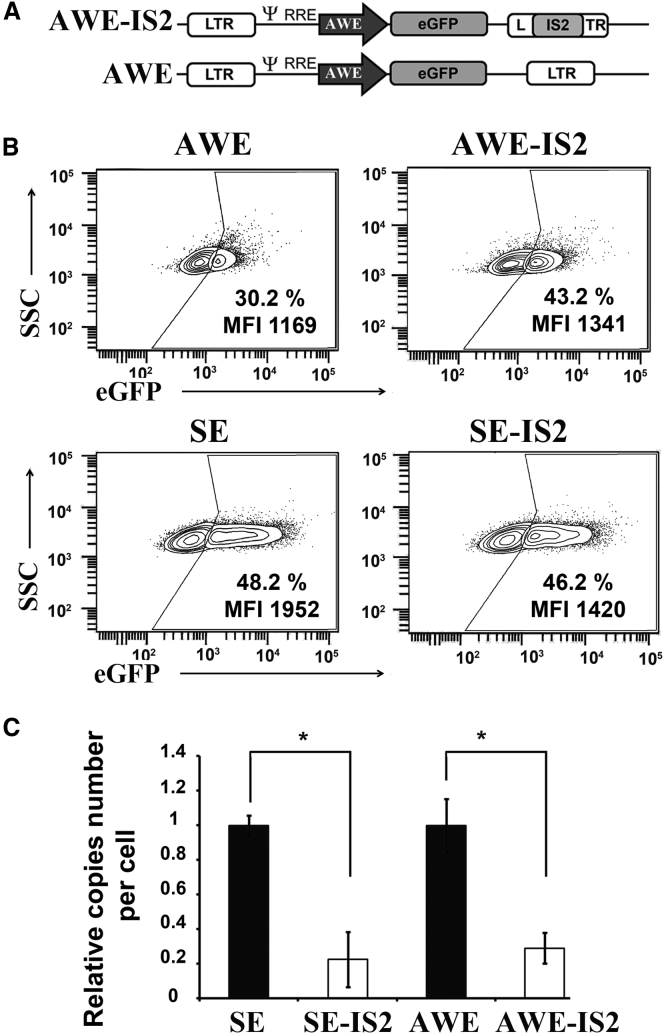
Integration-defective lentiviral vectors (IDLVs) have become an important alternative tool for gene therapy applications and basic research. Unfortunately, IDLVs show lower transgene expression as compared to their integrating counterparts. In this study, we aimed to improve the expression levels of IDLVs by inserting the IS2 element, which harbors SARs and HS4 sequences, into their LTRs (SE-IS2-IDLVs). Contrary to our expectations, the presence of the IS2 element did not abrogate epigenetic silencing by histone deacetylases. In addition, the IS2 element reduced episome levels in IDLV-transduced cells. Interestingly, despite these negative effects, SE-IS2-IDLVs outperformed SE-IDLVs in terms of percentage and expression levels of the transgene in several cell lines, including neurons, neuronal progenitor cells, and induced pluripotent stem cells. We estimated that the IS2 element enhances the transcriptional activity of IDLV LTR circles 6- to 7-fold. The final effect the IS2 element in IDLVs will greatly depend on the target cell and the balance between the negative versus the positive effects of the IS2 element in each cell type. The better performance of SE-IS2-IDLVs was not due to improved stability or differences in the proportions of 1-LTR versus 2-LTR circles but probably to a re-positioning of IS2-episomes into transcriptionally active regions.

Keywords: HS4 insulator; IDLV; gene therapy; lentiviral vector; scaffold or matrix attachment regions.


Figures

Figure 1
Figure 1
Inclusion of IS2 Element into IDLVs Enhances eGFP Expression Levels in 293T Cells (A) Schematic representation of SE-IS2, SE, SEWP-IS2, and SEWP. eGFP, enhanced green florescence protein; SFFV, spleen focus forming virus promoter; WPRE, woodchuck hepatitis virus posttranscriptional regulatory element. (B) Representative plots showing eGFP expression profiles of 293T cells transduced with the different IDLVs. An MOI of 0.3 was used to maintain the percentage of eGFP+ cells below 50%. The eGFP+ population gates were set to 0.2%–0.7% of eGFP+ cells in the untransduced population and subtracted from the % obtained under the different vectors and conditions for the analysis. The percentages (%) and expression levels (MFI) of the eGFP+ population are shown in each plot. (C) Graphs showing relative % of GFP+ cells (top graphs) and relative expression levels (MFI, bottom graphs) in 293T cells of SE-IS2-IDLVs and SE-IDLVs in the absence (left graphs) or presence (right graphs) of the WPRE element. Values represent means ± SEM of at least four separate experiments (*p < 0.05).
Figure 2
Figure 2
Apicidin Enhances Gene Expression of IDLV Transduced Cells Independently of the Presence of the IS2 Element (A) Representative plots showing eGFP expression profiles of 293T cells transduced with the SE or SE-IS2 at MOI = 0.2, in the absence or presence of 0.4 μM apicidin. (B) Graphs showing % of GFP+ cells transduced with the SE-IS2-IDLVs and SE-IDLVs in the absence (−) or presence (+) of 0.4 μM apicidin. Values represent means ± SEM of at least four separate experiments (*p < 0.05).
Figure 3
Figure 3
The Insertion of the IS2 Element into the LV Backbone Reduces Their Efficiency to Generate Vector Genomes in Target Cells (A) Representative plots showing eGFP expression profiles of 293T cells transduced with integrative LVs (left plots) and IDLVs (right plots) with (SE-IS2) or without (SE) the IS2 element. All the experiments were carried out using 0.7 viral particle/cells. (B) Graph showing the amounts of reverse-transcribed products (vector genomes) in 293T cells transduced with LVs (left bars) and IDLVs (right bars) with (SE-IS2) or without (SE) the IS2 element at 72 hr after transduction. Values represent means ± SEM of at least four separate experiments (*p < 0.05).
Figure 4
Figure 4
The IS2 Element Does Not Affect the Stability of IDLV Episomes but Enhances Their Transcriptional Efficacy and Relocates Them into DAPI-Low Nuclear Domains (A) Graph showing the relative amount of eGFP mRNA expression level in 293T cells transduced with IDLV-SE and IDLV-SE-IS2 normalized to the amount of vector genomes in each target cell. (B) Representative plots showing eGFP expression profiles of 293T cells transduced with SE (top) and SE-IS2 (bottom) IDLVs at MOI = 0.5 and analyzed at days 3, 5, and 7 post-transduction. The percentages (%) and expression levels (MFI) of the eGFP+ population are shown in each plot. (C) Relative amount of SE-IS2-IDLVs episomes related to SE-IDLVs at different time points post-transduction. (D) Representative confocal images showing nuclear distribution of SE- and SE-IS2-IDLV episomes. The cells were transduced at MOI = 10 in order to obtain several episomes inside the cells. The cells were subsequently fixed, methanol permeabilized, and incubated with Alexa Fluor 555 IDLV-labeled probes. (E) Graph showing the chromatin/IDLV colocalization in 293T cells transduced with SE- and SE-IS2-IDLVs. Values represent the Mander’s overlap coefficient (MOC; see Materials and Methods for details) between DAPI (DNA staining blue) and Alexa Fluor 555 (IDLV staining, in red). Values represent means ± SEM of at least four separate experiments (*p < 0.05).
Figure 5
Figure 5
Insertion of the IS2 Element or a Control 1.2-kb Fragment into the IDLVs Reduce the Total Number of Episomes and the Formation of Lower Expressing 2-LTR Circles (A) Top, schematic representation of SE, SE-IS2, and SE-1.2kb eGFP; SFFV (spleen focus-forming virus) promoter. Bottom, representative plots showing eGFP expression profiles of 293T cells transduced with the different IDLVs at MOI = 0.7. The percentages (%) and expression levels (MFI) of the eGFP+ population are shown in each plot. (B) Graph showing the titer of the different IDLV supernatants using the ABM’s Lentiviral qPCR Titer Kit (see Materials and Methods for details). (C) Relative amounts of vector genomes in 293T cells transduced with the different IDLVs at 72 hr post-transduction and normalized to the levels observed in SE IDLVs (see Materials and Methods for details). (D) Graph showing the percentage of GFP positive cells in 293T cells transduced with the different IDLVs and normalized to the levels observed in SE-IDLVs. (E) Graph showing the relative amounts of 2-LTR circles relative to total viral genomes in 293T target cells at 72 hr post-transduction and normalized to the levels observed in SE-IDLVs (see Materials and Methods for details). The values represent means ± SEM of at least four separate experiments (*p < 0.05). The data were reported to an equal amount of cells, estimated by β-albumin housekeeping gene.
Figure 6
Figure 6
The IS2 Sequence Improves Transgene Expression in Neural Progenitor Cells and Differentiated Neuron-like Cells (A) Representative image (left) and plots (right) showing eGFP expression profiles of undifferentiated neural stem cells transduced at MOI = 3 with SE, SE-IS2, SEWP, and SEWP-IS2-IDLVs and analyzed 72 hr post-transduction. The percentage (%) of the eGFP+ cells and the eGFP expression levels (MFI) are shown in each plot. (B) Representative image (left) and plots (right) showing eGFP expression profiles of differentiated neuron-like cells (positive for β-tubulin, see Materials and Methods for details) transduced at MOI = 3 with SE-, SE-IS2-, SEWP-, and SEWP-IS2-IDLVs and analyzed 72 hr post-transduction. The percentage (%) of the eGFP+ cells and the eGFP expression levels (MFI) are shown in each plot. (C) Graph showing the relative expression levels of eGFP (MFI) in NPCs transduced with the different IDLVs and normalized to the levels observed in SE-IDLVs. (D) Graph showing the relative expression levels of eGFP (MFI) in differentiated NPCs (neuron-like cells) transduced with the different IDLVs and normalized to the levels observed in SE-IDLVs. Values represent means ± SEM of at least four separate experiments (*p < 0.05).
Figure 7
Figure 7
The IS2 Sequence Improves Transgene Expression in iPSCs (A) Representative plots showing eGFP expression profiles of iPSCs transduced with the SE, SE-IS2, SEWP, and SEWP-IS2 IDLVs at MOI = 10. The percentage (%) of the eGFP+ population and the relative transgene expression levels (MFI) are shown in each plot. (B) Graphs showing the relative percentage of eGFP+ cells (top) and the relative transgene expression levels (bottom) in iPSCs transduced with different IDLVs and normalized to the levels obtained with SE-IDLVs. The values represent means ± SEM of at least four separate experiments (*p < 0.05).
Figure 8
Figure 8
Performance of the IS2-IDLVs Expressing the Transgene through the Human WAS Promoter (A) Scheme of the IDLVs harboring the human WAS promoter. (B) Representative plots showing eGFP expression profiles of Jurkat cells transduced with AWE and AWE-IS2 (top) and the SE- and SEIS2 (bottom)-IDLVs at MOI = 0.5. The percentage (%) of the eGFP+ population and the expression levels (MFI) are shown in each plot. (C) Graphs showing the relative vector DNA genomes in IDLV-transduced cells at 72 hr after transduction. Values represent means ± SEM of at least four separate experiments (*p < 0.05).

Similar articles

Cited by

References

    1. Naldini L. Gene therapy returns to centre stage. Nature. 2015;526:351–360. - PubMed
    1. Ungari S., Montepeloso A., Morena F., Cocchiarella F., Recchia A., Martino S., Gentner B., Naldini L., Biffi A. Design of a regulated lentiviral vector for hematopoietic stem cell gene therapy of globoid cell leukodystrophy. Mol. Ther. Methods Clin. Dev. 2015;2:15038. - PMC - PubMed
    1. Biffi A., Aubourg P., Cartier N. Gene therapy for leukodystrophies. Hum. Mol. Genet. 2011;20(R1):R42–R53. - PubMed
    1. Biffi A., Montini E., Lorioli L., Cesani M., Fumagalli F., Plati T., Baldoli C., Martino S., Calabria A., Canale S. Lentiviral hematopoietic stem cell gene therapy benefits metachromatic leukodystrophy. Science. 2013;341:1233158. - PubMed
    1. Kato S., Kobayashi K., Kobayashi K. Improved transduction efficiency of a lentiviral vector for neuron-specific retrograde gene transfer by optimizing the junction of fusion envelope glycoprotein. J. Neurosci. Methods. 2014;227:151–158. - PubMed