. 2018 Sep 17;19(9):2789.
doi: 10.3390/ijms19092789.

Biomolecular Clusters Distribution up to Mega Dalton Region Using MALDI-Quadrupole Ion Trap Mass Spectrometer

Affiliations

Biomolecular Clusters Distribution up to Mega Dalton Region Using MALDI-Quadrupole Ion Trap Mass Spectrometer

Yung-Kun Chuang et al. Int J Mol Sci. .

Abstract

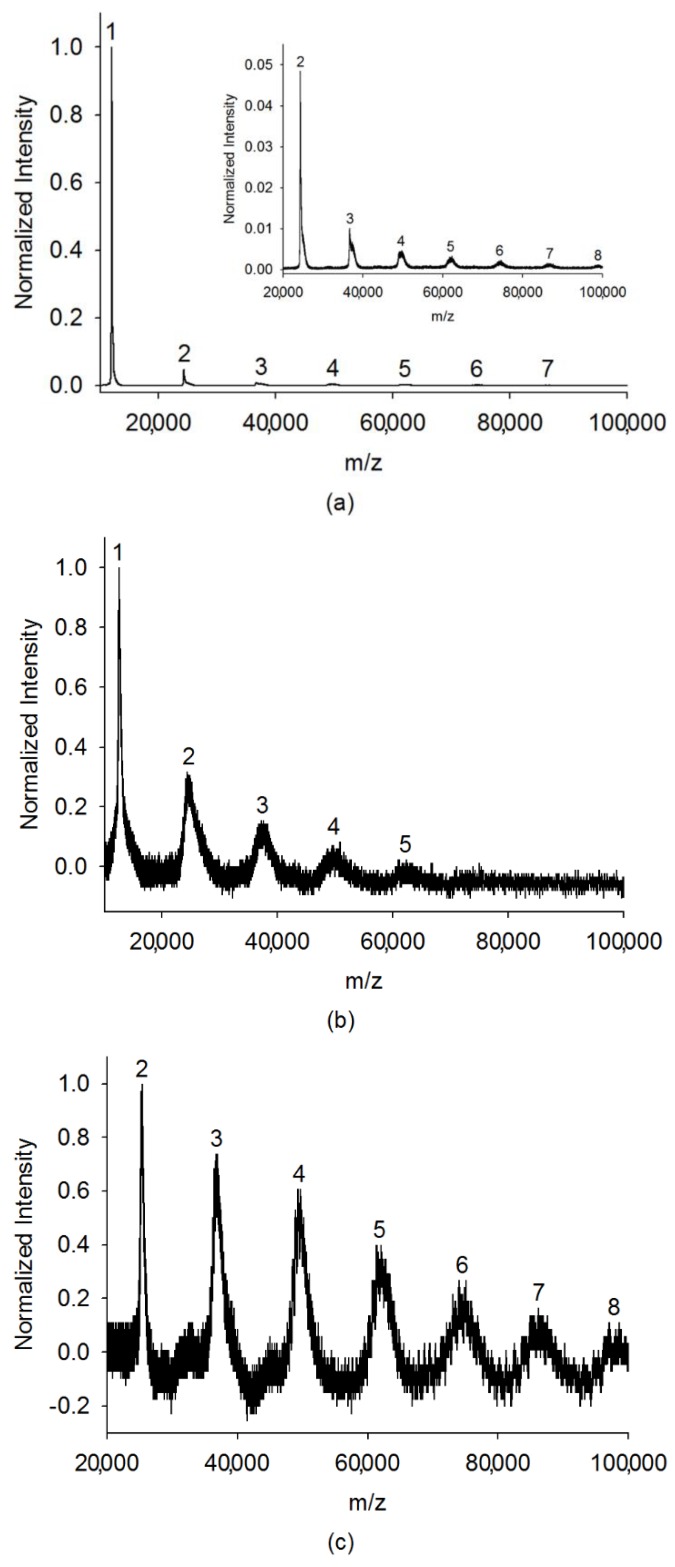
We present the first report on complete cluster distributions of cytochrome c (molecular weight of 12.4 kDa) and bovine serum albumin ((BSA), molecular weight of 66.4 kDa) with mass-to-charge ratio (m/z) reaching 350,000 and 1,400,000, respectively, by matrix-assisted laser desorption/ionization (MALDI). Large cluster distributions of the analytes were measured by our homemade frequency-scanned quadrupole ion trap (QIT) mass spectrometer with a charge detector. To our knowledge, we report the highest m/z clusters of these two biomolecules. The quantitative results indicate that large clusters ions of cytochrome c and BSA follow the power law (r² > 0.99) with cluster size distribution, which provides experimental evidence for the laser ablation studies of MALDI.

Keywords: MALDI; bovine serum albumin (BSA); cytochrome c; large clusters; quantitative distribution.


Conflict of interest statement

The authors declare no conflict of interest.

Figures

Figure 1
Figure 1
(a) Schematic diagram of photoionization and subsequent reaction pathways in matrix-assisted laser desorption/ionization mass spectrometry (MALDI)-MS, as proposed by Ehring, Karas, and Hillenkamp in 1992 (see the literature [8] for further details). (b) Sketch of the major processes proposed in the cluster models of MALDI ionization, as proposed and largely developed by the Karas group (see the literature [22] for further details).
Figure 2
Figure 2
(a) Cytochrome c clusters with m/z from 10,000 to 100,000 Da obtained by the Bruker Ultraflex II MALDI-time-of-flight (TOF)/TOF mass spectrometer. The inside box is the magnified mass spectrum for a molecular weight from 20,000 to 100,000 Da. (b) Cytochrome c clusters with m/z from 10,000 to 100,000 Da and (c) from 20,000 to 100,000 Da obtained by our homemade frequency-scanned quadrupole ion trap (QIT) mass spectrometer with a charge detector.
Figure 3
Figure 3
Mass calibration curves of expected m/z (theoretical value) versus measured m/z (actual value) for mass spectra of (a) cytochrome c with mass range from 150 kDa to 350 kDa, and (b) bovine serum albumin (BSA) with a mass range from 300 kDa to 1500 kDa.
Figure 4
Figure 4
(a) Cytochrome c clusters in low-mass region. (b) Cytochrome c clusters with m/z from 150 kDa to 350 kDa.
Figure 5
Figure 5
(a) The BSA clusters in low-mass region. (b) BSA clusters with m/z from 300 kDa to 1500 kDa. (c) Signals of specific BSA cluster with various sizes (14-mer to 21-mer) in very high mass region under eight different ranges of scanning frequencies, respectively. The gap between each size of BSA clusters is around 66 kDa.
Figure 6
Figure 6
Cluster size distribution of cytochrome c from trimer to 30-mer. The cluster size (x-axis) and the normalized relative intensity (y-axis) are plotted on a base-10 logarithmic scale.
Figure 7
Figure 7
Cluster size distribution of BSA from monomer to 22-mer. The cluster size (x-axis) and the normalized relative intensity (y-axis) are plotted on a base-10 logarithmic scale.
Figure 8
Figure 8
Experimental setup of our homemade MALDI frequency-scanned quadrupole ion trap mass spectrometer with a charge detector.
Figure 9
Figure 9
The principle of MALDI-TOF/TOF mass spectrometer.

References

    1. Karas M., Bachmann D., Bahr U., Hillenkamp F. Matrix-assisted ultraviolet laser desorption of non-volatile compounds. Int. J. Mass Spectrom. Ion Process. 1987;78:53–68. doi: 10.1016/0168-1176(87)87041-6. - DOI
    1. Tanaka K., Waki H., Ido Y., Akita S., Yoshida Y., Yoshida T. Protein and polymer analyses up to m/z 100,000 by laser ionization time-of-flight mass spectrometry. Rapid Commun. Mass Spectrom. 1988;2:151–153. doi: 10.1002/rcm.1290020802. - DOI
    1. Chen C.-H.W. Review of a current role of mass spectrometry for proteome research. Anal. Chim. Acta. 2008;624:16–36. doi: 10.1016/j.aca.2008.06.017. - DOI - PubMed
    1. Lu I.-C., Lin J.-L., Lai S.-H., Chen C.-H. Frequency-scanning MALDI linear ion trap mass spectrometer for large biomolecular ion detection. Anal. Chem. 2011;83:8273–8277. doi: 10.1021/ac202083c. - DOI - PubMed
    1. Taranenko N.I., Potter N.T., Allman S.L., Golovlev V.V., Chen C.H. Detection of trinucleotide expansion in neurodegenerative disease by matrix-assisted laser desorption/ionization time-of-flight mass spectrometry. Genet. Anal. Biomol. Eng. 1999;15:25–31. doi: 10.1016/S1050-3862(98)00034-5. - DOI - PubMed

MeSH terms

LinkOut - more resources