

Evaluation of the nutrient content of yogurts: a comprehensive survey of yogurt products in the major UK supermarkets
- PMID: 30228100
- PMCID: PMC6144340
- DOI: 10.1136/bmjopen-2017-021387
Evaluation of the nutrient content of yogurts: a comprehensive survey of yogurt products in the major UK supermarkets
Abstract
Objectives: To comprehensively survey the sugar and nutrient contents of yogurt products available in UK supermarkets, in particular those marketed to children.
Design: A cross-sectional survey of yogurt products available in the UK's supermarkets in November 2016.
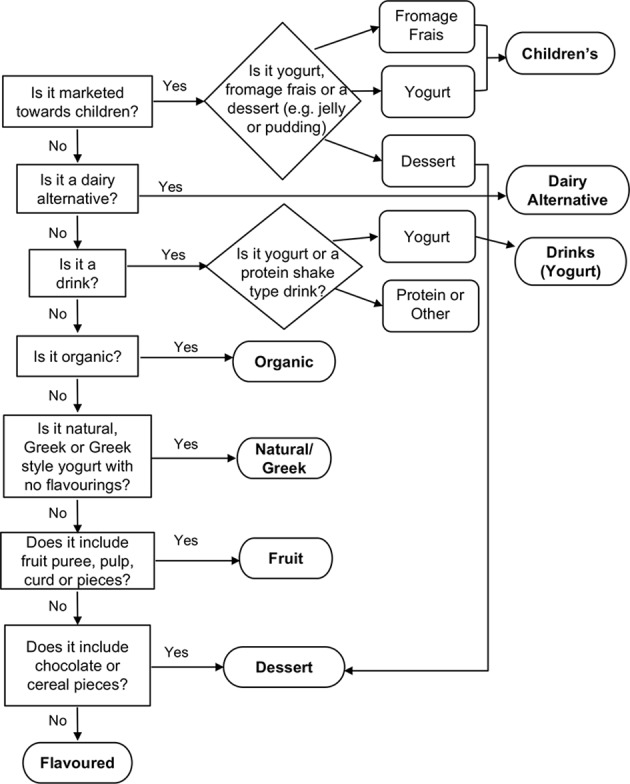
Methods: Data were collected from five major online UK supermarkets and a process flow strategy was used to place yogurts into eight categories: children's, dairy alternatives, dessert, drinks, fruit, flavoured, natural/Greek style and organic. A comprehensive database of product information for 921 unique products was created and analysed.
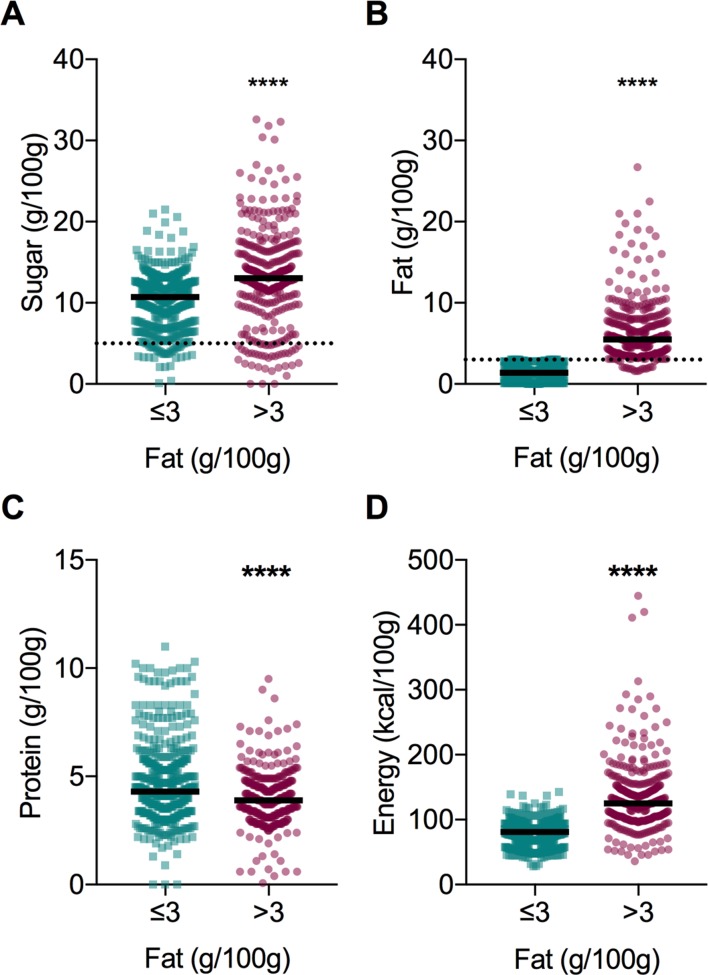
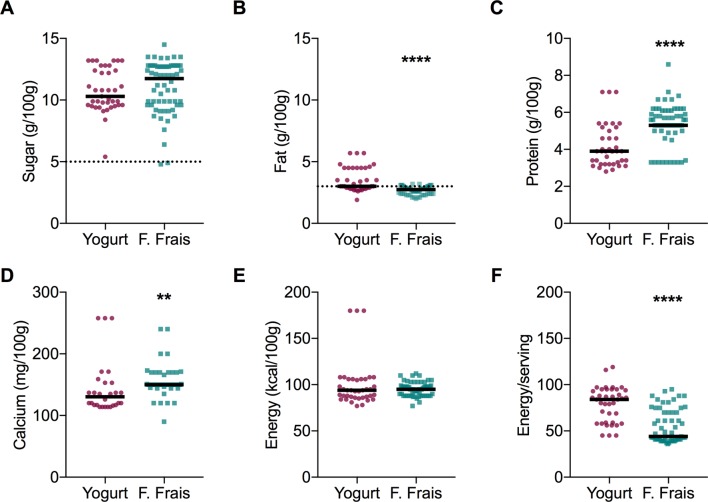
Results: The total sugar, fat, protein, calcium and energy contents were highly variable across categories, and the ranges were extremely broad. Although lower than the dessert category, the medians (range) of the total sugar content of children's (10.8 g/100 g (4.8-14.5)), fruit (11.9 g/100 g (4.6-21.3)), flavoured (12.0 g/100 g (0.1-18.8)) and organic (13.1 g/100 g (3.8-16.9)) yogurt products were all well above 10 g/100 g, and represented >45% of total energy. Only two out of 101 children's yogurt and fromage frais products surveyed qualified as low sugar (≤5 g/100 g). Natural/Greek yogurts had dramatically lower sugar contents (5.0 g/100 g (1.6, 9.5), largely lactose) than all other categories. While low-fat (<3 g/100 g) products had less sugar and energy than higher fat yogurts, nonetheless 55% (285 of 518 low-fat yogurts) contained between 10 and 20 g sugar/100 g. Within the children's category, fromage frais had higher protein (5.3 g/100 g (3.3, 8.6) vs 3.2 (2.8, 7.1); p<0.0001) and calcium contents (150 mg/100 g (90, 240) vs 130.5 mg/100 g (114, 258); p=0.0015) than yogurts.
Conclusions: While there is good evidence that yogurt can be beneficial to health, products on the market vary widely in total sugars. Fewer than 9%, and only 2% of the children's, products surveyed were low enough in sugar to earn 'green' in UK front of the pack labelling. Reformulation for the reduction of free sugars in yogurts is warranted.
Keywords: children; obesity; sugar; yogurts.
© Author(s) (or their employer(s)) 2018. Re-use permitted under CC BY-NC. No commercial re-use. See rights and permissions. Published by BMJ.
Conflict of interest statement
Competing interests: None declared.
Figures

Similar articles
-
Sugar Reduction in Yogurt Products Sold in the UK between 2016 and 2019.Nutrients. 2020 Jan 8;12(1):171. doi: 10.3390/nu12010171. Nutrients. 2020. PMID: 31936185 Free PMC article.
-
Variations in Sugar Content of Flavored Milks and Yogurts: A Cross-Sectional Study across 3 Countries.Curr Dev Nutr. 2019 May 8;3(6):nzz060. doi: 10.1093/cdn/nzz060. eCollection 2019 Jun. Curr Dev Nutr. 2019. PMID: 31187086 Free PMC article.
-
Yoghurt and dairy snacks presented for sale to an Australian consumer: are they becoming less healthy?Public Health Nutr. 2010 Jul;13(7):1036-41. doi: 10.1017/S1368980009992965. Epub 2009 Dec 22. Public Health Nutr. 2010. PMID: 20025831
-
Reformulation of Processed Yogurt and Breakfast Cereals over Time: A Scoping Review.Int J Environ Res Public Health. 2023 Feb 14;20(4):3322. doi: 10.3390/ijerph20043322. Int J Environ Res Public Health. 2023. PMID: 36834017 Free PMC article.
-
[Simple obesity in children. A study on the role of nutritional factors].Med Wieku Rozwoj. 2006 Jan-Mar;10(1):3-191. Med Wieku Rozwoj. 2006. PMID: 16733288 Review. Polish.
Cited by
-
Carbohydrate Restriction in Type 1 Diabetes: A Realistic Therapy for Improved Glycaemic Control and Athletic Performance?Nutrients. 2019 May 7;11(5):1022. doi: 10.3390/nu11051022. Nutrients. 2019. PMID: 31067747 Free PMC article. Review.
-
Knowledge, Attitudes, and Practices Associated with the Selection of Sweetened Ultra-Processed Foods and Their Importance in Oral Health.Dent J (Basel). 2024 Aug 20;12(8):268. doi: 10.3390/dj12080268. Dent J (Basel). 2024. PMID: 39195112 Free PMC article.
-
Inulin-type fructans and short-chain fructooligosaccharides-their role within the food industry as fat and sugar replacers and texture modifiers-what needs to be considered!Food Sci Nutr. 2022 Sep 15;11(1):17-38. doi: 10.1002/fsn3.3040. eCollection 2023 Jan. Food Sci Nutr. 2022. PMID: 36655109 Free PMC article. Review.
-
Ultra-processed foods: Processing versus formulation.Obes Sci Pract. 2023 Jan 26;9(4):435-439. doi: 10.1002/osp4.657. eCollection 2023 Aug. Obes Sci Pract. 2023. PMID: 37546281 Free PMC article.
-
Industrially Produced Plant-Based Food Products: Nutritional Value and Degree of Processing.Foods. 2024 Jun 3;13(11):1752. doi: 10.3390/foods13111752. Foods. 2024. PMID: 38890980 Free PMC article.
References
-
- European Parliament Council of the European Union. Regulation (EC) No 1924/2006 of the European Parliament and of the Council of 20 December 2006 on nutrition and health claims made on foods. Official Journal of the European Union 2006:L 404/9.
-
- European Food Safety Authority. Scientific Opinion on the substantiation of health claims related to live yoghurt cultures and improved lactose digestion. EFSA Journal 2010;8:1763.
MeSH terms
Substances
LinkOut - more resources
Full Text Sources
Other Literature Sources