. 2018 Dec 3;217(12):4267-4283.
doi: 10.1083/jcb.201804048. Epub 2018 Sep 18.

Occluding junctions as novel regulators of tissue mechanics during wound repair

Affiliations

Occluding junctions as novel regulators of tissue mechanics during wound repair

Lara Carvalho et al. J Cell Biol. .

Abstract

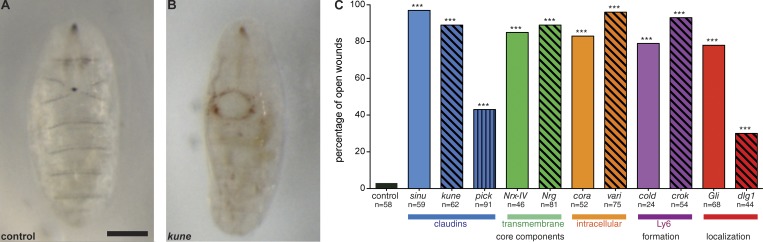
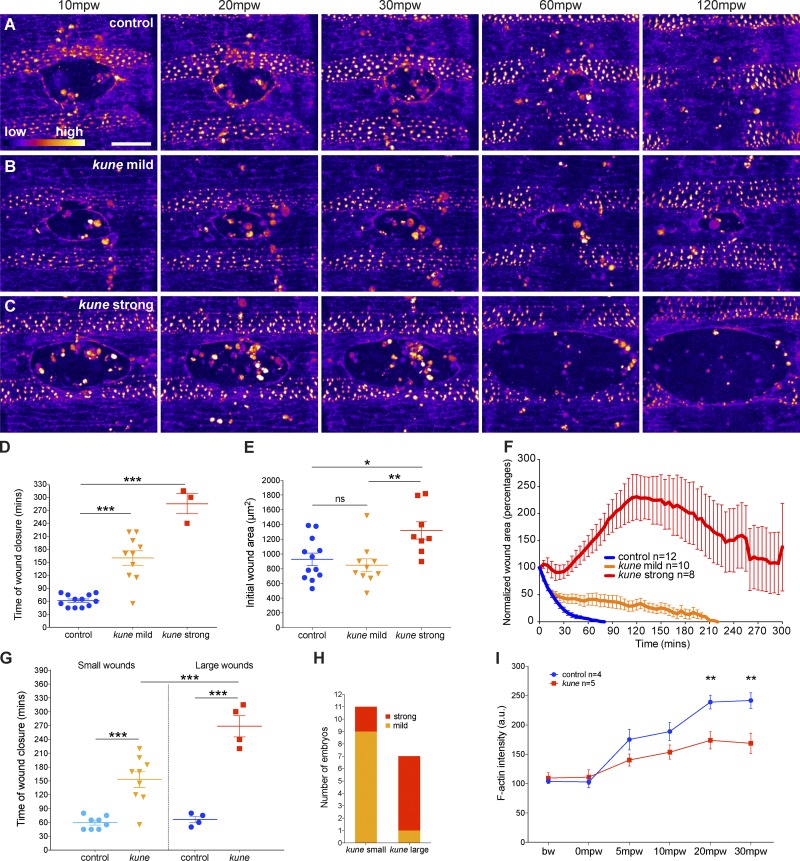
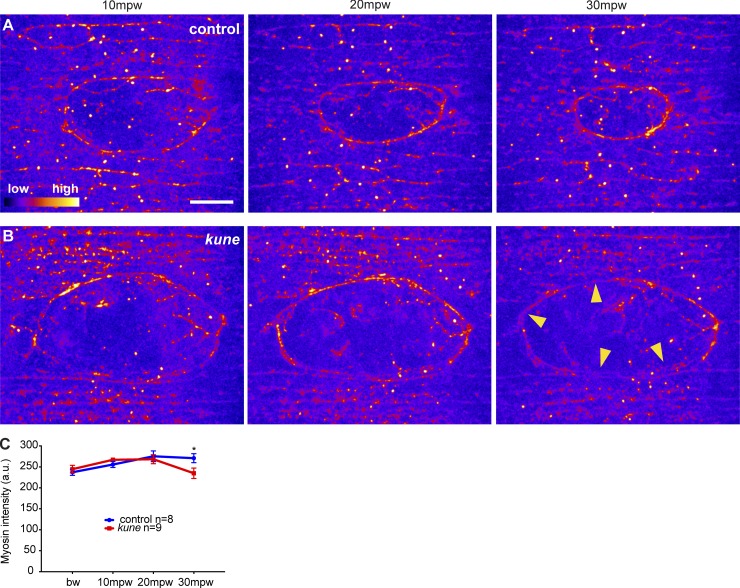
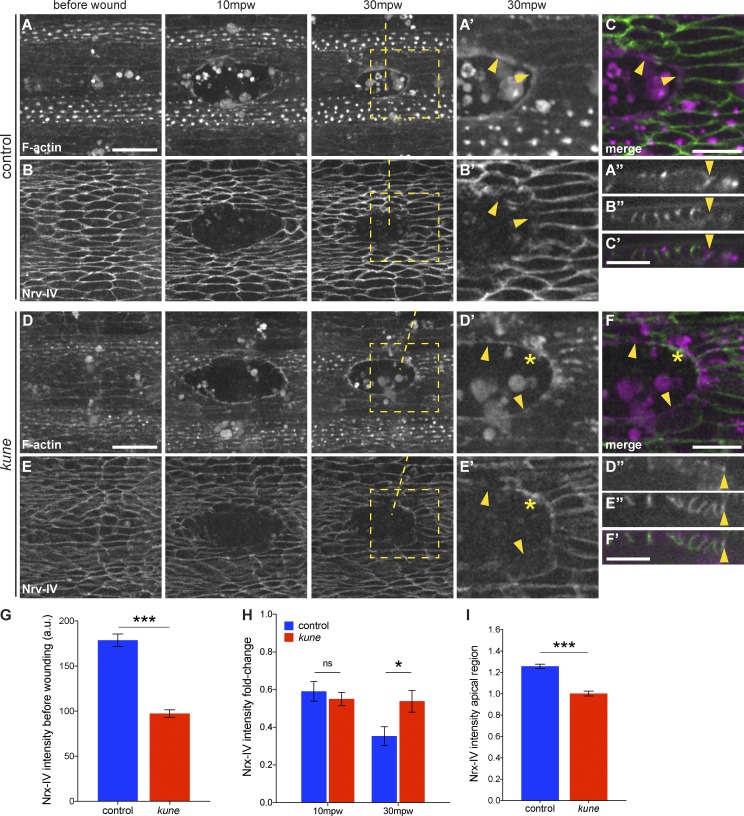
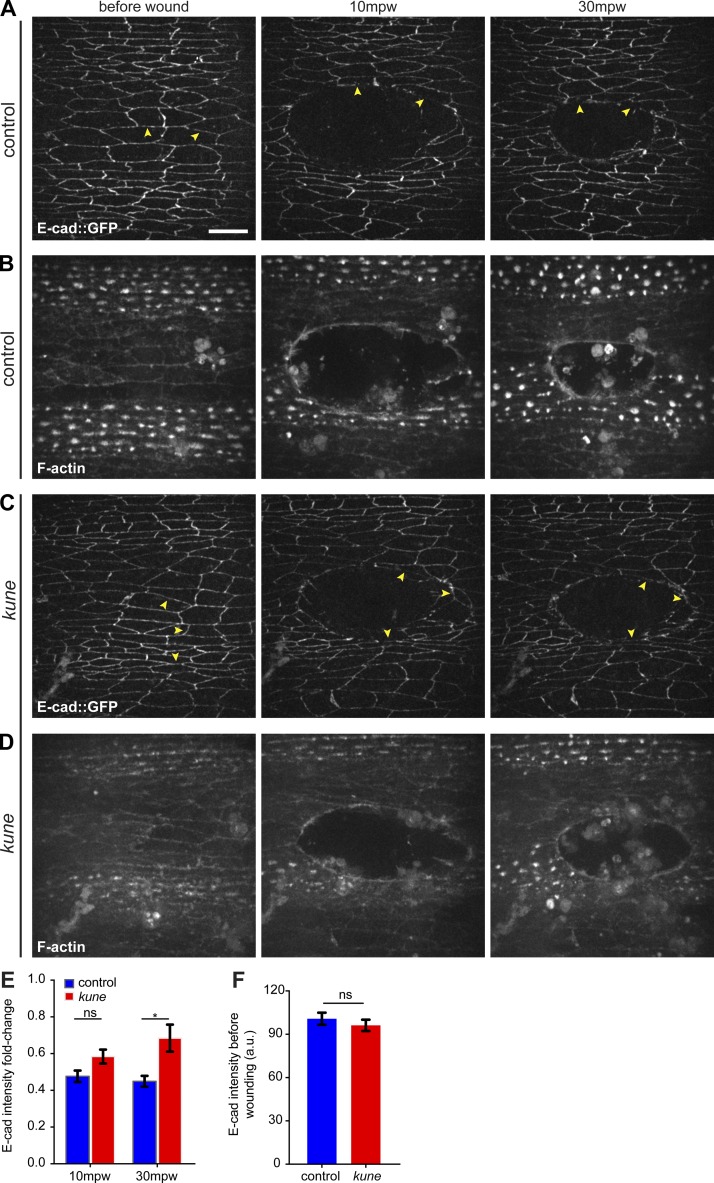
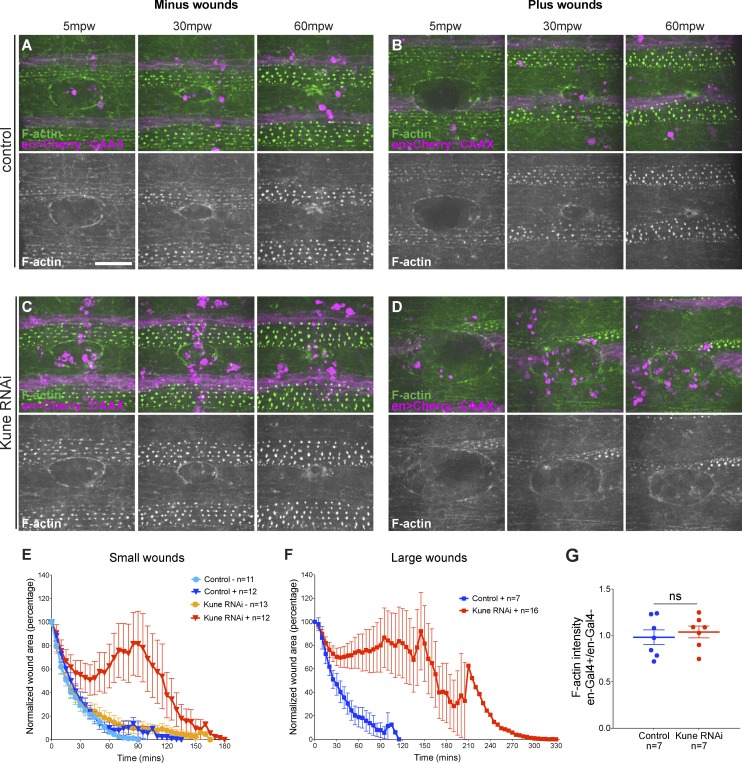
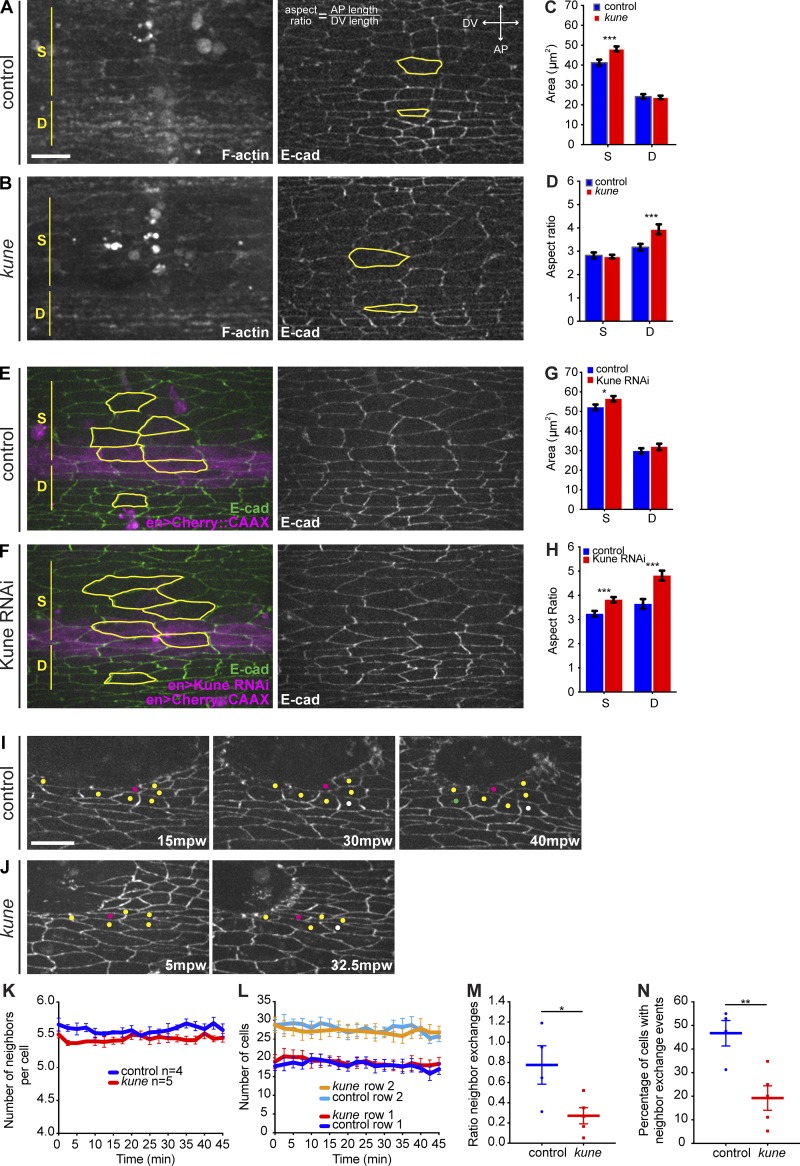
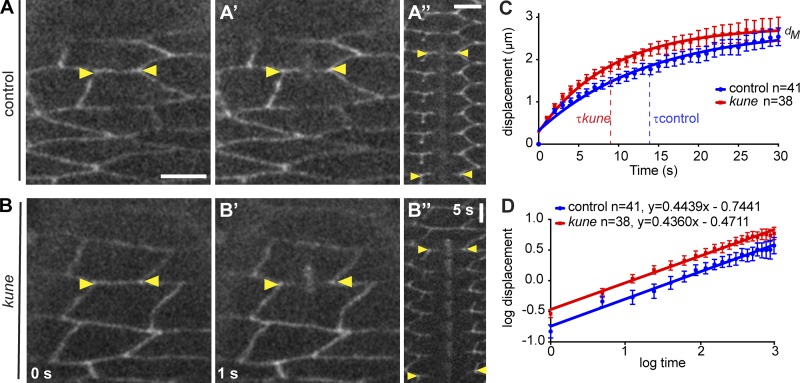
In epithelial tissues, cells tightly connect to each other through cell-cell junctions, but they also present the remarkable capacity of reorganizing themselves without compromising tissue integrity. Upon injury, simple epithelia efficiently resolve small lesions through the action of actin cytoskeleton contractile structures at the wound edge and cellular rearrangements. However, the underlying mechanisms and how they cooperate are still poorly understood. In this study, we combine live imaging and theoretical modeling to reveal a novel and indispensable role for occluding junctions (OJs) in this process. We demonstrate that OJ loss of function leads to defects in wound-closure dynamics: instead of contracting, wounds dramatically increase their area. OJ mutants exhibit phenotypes in cell shape, cellular rearrangements, and mechanical properties as well as in actin cytoskeleton dynamics at the wound edge. We propose that OJs are essential for wound closure by impacting on epithelial mechanics at the tissue level, which in turn is crucial for correct regulation of the cellular events occurring at the wound edge.


Figures

Figure 1.
Figure 1.
Mutants for SJ-related proteins show wound-closure defects. (A and B) WT embryo (A) and kune mutant embryo (B) 16 h after wounding. Bar, 100 µm. (C) Graph shows the percentage of open wounds 16 h after wounding in WT and SJ mutant embryos. Mutants for different types of SJ components were tested: claudin transmembrane proteins (blue), other transmembrane adhesion proteins (green), intracellular scaffolding proteins (orange), Ly6 family proteins that regulate SJ complex assembly (magenta), and proteins that regulate SJ localization (red). Fisher’s exact test shows that all these SJ mutants have significantly higher percentages of open wounds when compared with controls. ***, P < 0.0001. See figure for the number of embryos for each genotype.
Figure 2.
Figure 2.
kune mutants show altered wound-closure dynamics and actomyosin cable defects. (A–C) Confocal images of the epidermis in control (A), kune mild mutant (B), and kune strong mutant embryos (C) expressing Cherry::Moesin labeling F-actin after laser wounding. Images are maximum Z projections of 49 slices (17-µm-thick stack) and pseudocolored in a color gradient (from lower intensities in blue to higher intensities in yellow). In all genotypes, F-actin accumulates at the wound edge at 10 mpw, and at 20 mpw, the wound starts contracting. At 120 mpw, the wound has closed in control embryo, whereas in the kune mild embryo, the wound has not closed, and in kune strong embryo, the wound size has increased. Bar, 20 µm. (D) Graph of average time of wound closure in control and kune mild and strong mutants. Note that from the total number of embryos analyzed, five kune strong wounds did not close and thus were not considered in this analysis. (E) Graph of average initial wound area in control and kune mild and strong mutants. (F) Graph of average wound area over time shows that kune mutants have altered wound-closure dynamics when compared with controls. In kune mild mutants, wounds closed slower than in controls. In kune strong mutants, wounds stopped contracting between 20 and 40 mpw, increased their area until ∼120–180 mpw, and then decreased their wound size again. (G) Graph of average time of wound closure in control and kune mutants divided in groups according to initial wound area (small wounds = 468–1,100 µm2; large wounds = 1,101–1,820 µm2). Note that from the total number of embryos analyzed, two kune small wounds and three kune large wounds did not close and were not considered in this analysis. (H) Graph showing the number of kune embryos showing a mild and strong phenotype according to initial wound area. (I) Graph of average F-actin intensity levels in the cortical region of cells before wounding (bw) and at the wound edge in control and kune embryos. F-actin intensity is significantly lower in kune than in controls at 20 and 30 mpw. Unpaired t test corrected for multiple comparisons using the Holm-Sidak method was performed to test for significant differences between groups in D, E, and G. *, P < 0.05; **, P <0.01; ***, P < 0.001. n = 12 embryos (control); n = 10 embryos (kune mild); n = 8 embryos (kune strong); n = 8 embryos (control small); n = 9 embryos (kune small); n = 4 embryos (control large); n = 4 embryos (kune large). A two-way ANOVA and a Sidak multiple comparison test were used to test for significant differences between groups in I. **, P < 0.01. n = 4 embryos (control); n = 5 embryos (kune). Error bars represent SEM.
Figure 3.
Figure 3.
Myosin localization is altered in kune mutant embryos. (A and B) Confocal images of the epidermis in control (A) and kune mutant embryos (B) expressing zip::GFP labeling myosin before and after laser wounding. Images are maximum Z projections of 29 slices (10-µm-thick stack) and pseudocolored in a color gradient (from lower intensities in blue to higher intensities in yellow). Myosin accumulates at the wound edge shortly after injury. Whereas in controls, myosin is maintained during the first 30 mpw, in kune mutant embryos, myosin decreases at 30 mpw (yellow arrowheads in B). Bar, 10 µm. (C) Graph of average zip::GFP intensity levels in the cortical region of cells before wounding (bw) and at the wound edge in control and kune embryos. Myosin intensity is significantly lower in kune than in controls at 30 mpw. A two-way ANOVA and a Sidak multiple comparison test were used to test for significant differences between groups. *, P < 0.05. n = 8 embryos (control); n = 9 embryos (kune). Error bars represent SEM.
Figure 4.
Figure 4.
The SJ component Nrx-IV is mislocalized at the wound edge in kune mutants. (A–F) Confocal images of the epidermis during wound closure in control (A–C) and kune strong mutant embryos (D–F) expressing Cherry::Moesin labeling F-actin (A, A′, A′′, D, D′, and D′′) and Nrx-IV–GFP (B, B′, B′′, E, E′, E′′) before and upon laser wounding. (C, C′, F, F′) Merged images. (A, A′, B, B′, D, D′, E, and E′) Maximum Z projections of 61 slices (22-µm-thick stack). (A′′, B′′, C′, D′′, E′′, and F′) YZ sections marked by dashed lines shown in 30-mpw panels. Arrowheads in A′′, B′′, C′, D′′, E′′, and F′ mark the wound edge. Dashed squares mark zoomed regions shown in A′, B′, D′, and E′. Bars: 20 µm (A, B, D, and E); 10 µm (A′, A′′, B′, B′′, C, and C′). Upon wounding, Nrx-IV decreases at the wound edge compared with cells away from the edge, mostly not colocalizing with the actin cable (arrowheads in A′, B′, C, D′, E′, and F). In kune mutants, Nrx-IV–rich accumulations are visible at the wound edge at 30 mpw, colocalizing with the actin cable (asterisks in D′, E′, and F). (G) Graph of average Nrx-IV–GFP intensity levels before wounding in control (40 junctions from four embryos) and kune mutants (50 junctions from five embryos). (H) Graph of fold change decrease in Nrx-IV–GFP intensity in wound edge junctions at 10 and 30 mpw (compared with before wounding), in control (15 junctions from four embryos), and kune embryos (14 junctions from three embryos). (I) Graph showing Nrx-IV intensity at the apical side of cells before wounding in control (30 junctions from six embryos) and kune embryos (30 junctions from six embryos). An unpaired t test (G and I) and a two-way ANOVA and multiple comparisons Sidak test (H) were performed to test for significant differences between groups. *, P < 0.05; ***, P < 0.0001. Error bars represent SEM.
Figure 5.
Figure 5.
E-cad localization in control and kune mutants. (A–D) Confocal images of the epidermis during wound closure in control (A and B) and kune strong mutants (C and D) expressing ubi–E-cad::GFP (A and C) and Cherry::Moesin labeling F-actin (B and D) before and upon laser wounding. Images are maximum Z projections of 40 slices (14-µm-thick stack). Upon wounding, E-cad intensity decreases at cell boundaries facing the wound edge in controls and kune mutants (arrowheads mark the same junctions before and after wounding in each embryo). Bar, 10 µm. (E) Graph of fold change decrease in E-cad::GFP fluorescence intensity in cell boundaries at the wound edge at 10 and 30 mpw (compared with before wounding), in control (35–39 junctions from six embryos), and kune embryos (36–42 junctions from seven embryos). (F) Graph of average E-cad::GFP fluorescence intensity in cells before wounding in control (56 junctions from six embryos) and kune embryos (59 junctions from seven embryos). A two-way ANOVA with a Sidak multiple comparisons test (E) and an unpaired t test (F) were performed to test for significant differences between groups. *, P < 0.05. Error bars represent SEM.
Figure 6.
Figure 6.
Kune is required for wound closure in cells not directly at the wound edge. (A–D) Confocal images of the epidermis during wound closure in control (A and B) and kune RNAi embryos (C and D) expressing GFP::Moesin labeling F-actin and Cherry::CAAX under control of the en-Gal4 promotor labeling cell membranes upon laser wounding. Top: Merged images (green, F-actin; magenta, en-Gal4). Bottom: F-actin. Images are maximum Z projections of 50 slices (17.6-µm-thick stack). (A and C) Embryos with wounds located between two en-Gal4–expressing stripes (minus). (B and D) Embryos with wound spanning one en-Gal4–expressing stripe (plus). Bar, 20 µm. (E and F) Graphs of average wound area over time in small (initial wound area <1,100 µm2) and large wounds (initial wound area >1,100 µm2) in en-Gal4–minus and –plus embryos. kune RNAi–plus embryos show a stronger phenotype than kune RNAi–minus embryos. (G) Graph of F-actin ratio at the wound edge in en-Gal4–positive versus en-Gal4–negative regions in control and kune RNAi–plus embryos at 30 mpw. An unpaired t test was used to test for significant differences between groups. ns, P > 0.05. n = 7 embryos (control); n = 7 embryos (kune RNAi). Error bars represent SEM.
Figure 7.
Figure 7.
Kune loss of function modifies cellular shapes. (A and B) Confocal images of the epidermis in control (A) and kune embryos (B) expressing Cherry::Moesin labeling F-actin (left) and ubi-E-cad::GFP labeling E-cad (right). (C and D) Average area (C) and average aspect ratio (D) of smooth and denticle cells in control (48 smooth cells and 24 denticle cells from three embryos) and kune embryos (64 smooth cells and 32 denticle cells from four embryos). (E and F) Confocal images of the epidermis in control (E) and kune RNAi embryos (F) expressing ubi-E-cad::GFP labeling E-cad and Cherry::CAAX under control of the en-Gal4 promotor labeling cell membranes. Left: Merged images. Right: E-cad. (G and H) Average area (G) and average aspect ratio (H) of smooth and denticle cells in control (48 smooth cells and 24 denticle cells from three embryos) and kune RNAi embryos (96 smooth cells and 48 denticle cells from six embryos). (I and J) Confocal images of the epidermis in control (I) and kune embryos (J) expressing E-cad::GFP at different time points of wound closure depicting neighbor exchange events. Magenta dots mark the cell analyzed, yellow dots mark neighbors, white dots mark cells that lose contact with the cell analyzed, and the green dot marks a cell establishing a new connection. Bars, 10 µm. (K and L) Number of neighbors in cells at the row adjacent to the wound edge (K) and number of cells in the first two rows closer to the wound edge (L) in control (n = 4) and kune (n = 5) embryos. (M and N) Ratio of neighbor exchange events (M) and percentage of cells undergoing neighbor exchange events (N) in control (n = 4) and kune (n = 5) embryos. An unpaired t test was performed to test for significant differences between groups. *, P < 0.05; **, P < 0.01; ***, P < 0.001. Error bars represent SEM. Images are maximum Z projections of 49 slices (17-µm-thick stack). Representative cells are outlined. S, smooth cells; D, denticle cells; DV, dorsal–ventral axis; AP, anterior–posterior axis.
Figure 8.
Figure 8.
Mutants for the claudin Kune show altered mechanical responses to laser ablation. (A and B) Confocal slices of control (A) and kune (B) ventral epidermis expressing ubi-E-cad::GFP before (A and B) and 1 s after a laser cut (A′ and B′). (A′′ and B′′) Corresponding kymographs showing vertex displacement over time (every 5 s). Arrowheads mark the vertices attached to the cut edge. Bars: 5 µm (A, A′, B, and B′); 2 µm (A′′ and B′′). (C) Graph shows the displacement of cell vertices over time upon laser cutting in control (n = 41 cells, blue line, circles) and kune (n = 38 cells, red line, squares). Note that in kune cells, vertices retract faster than in controls as evidenced by their different retardation times τ (controls = 13.9 s; kune = 9.0 s; P = 0.0466). Maximum displacements dM (control = 2.74 µm; kune = 2.77 µm; P = 0.8508) were similar between both genotypes. (D) Graph of displacement over time after a logarithmic transformation of the values presented in graph (C) for the initial time window (t < 20 s) shows a power law behavior. The slopes of the regression lines obtained for controls and kune are approximately the same (0.44; P = 0.8338), whereas the intercept value is significantly different (control = −0.74; kune = −0.47; P < 0.0014). Error bars represent SEM. Extra sum of squares F test was applied to test for significant differences between genotypes.

Similar articles

Cited by

References

    1. Abreu-Blanco M.T., Verboon J.M., Liu R., Watts J.J., and Parkhurst S.M.. 2012. Drosophila embryos close epithelial wounds using a combination of cellular protrusions and an actomyosin purse string. J. Cell Sci. 125:5984–5997. 10.1242/jcs.109066 - DOI - PMC - PubMed
    1. Balda M.S., and Matter K.. 2016. Tight junctions as regulators of tissue remodelling. Curr. Opin. Cell Biol. 42:94–101. 10.1016/j.ceb.2016.05.006 - DOI - PubMed
    1. Banerjee S., Sousa A.D., and Bhat M.A.. 2006. Organization and function of septate junctions: an evolutionary perspective. Cell Biochem. Biophys. 46:65–77. 10.1385/CBB:46:1:65 - DOI - PubMed
    1. Behrndt M., Salbreux G., Campinho P., Hauschild R., Oswald F., Roensch J., Grill S.W., and Heisenberg C.-P.. 2012. Forces driving epithelial spreading in zebrafish gastrulation. Science. 338:257–260. 10.1126/science.1224143 - DOI - PubMed
    1. Brand A.H., and Perrimon N.. 1993. Targeted gene expression as a means of altering cell fates and generating dominant phenotypes. Development. 118:401–415. - PubMed

Publication types

LinkOut - more resources