. 2018 Oct 31;38(44):9600-9613.
doi: 10.1523/JNEUROSCI.0433-18.2018. Epub 2018 Sep 18.

Neogenin in Amygdala for Neuronal Activity and Information Processing

Affiliations

Neogenin in Amygdala for Neuronal Activity and Information Processing

Xiang-Dong Sun et al. J Neurosci. .

Abstract

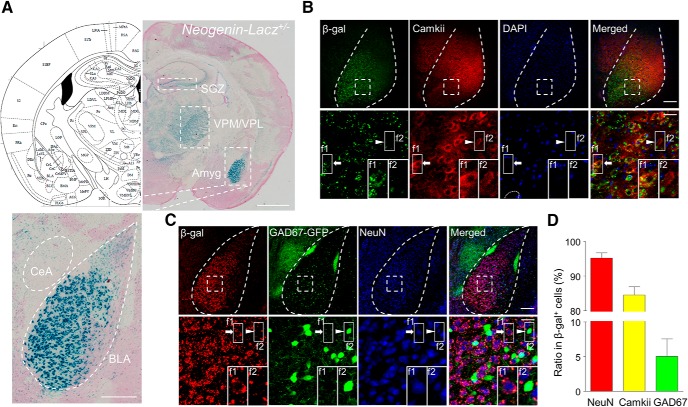
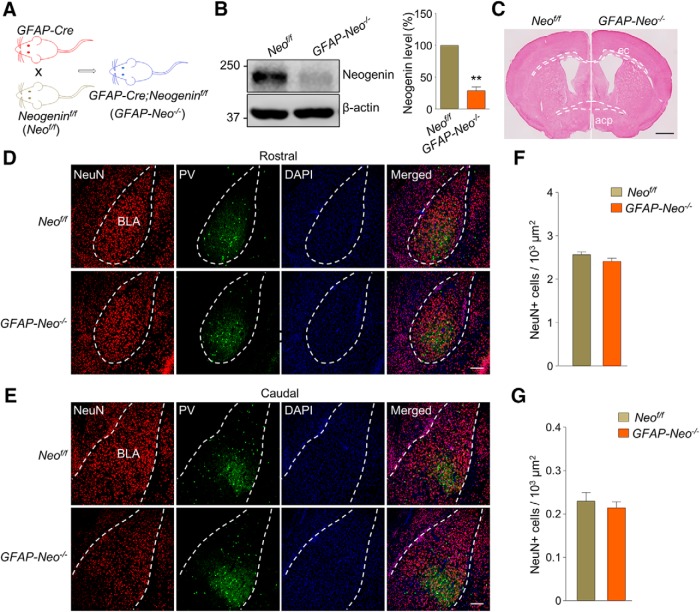
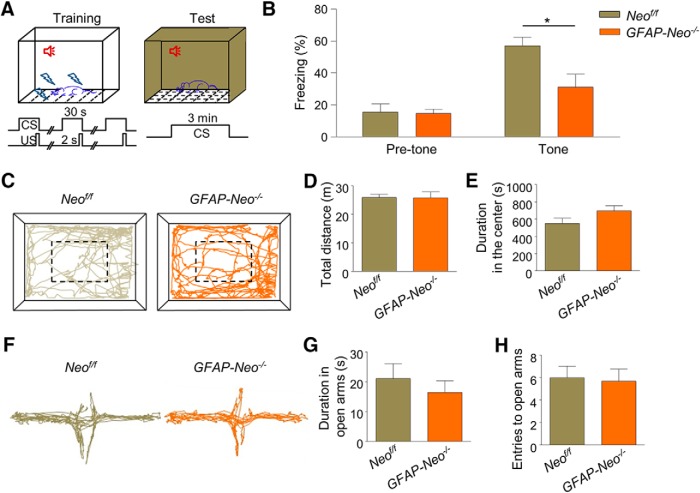
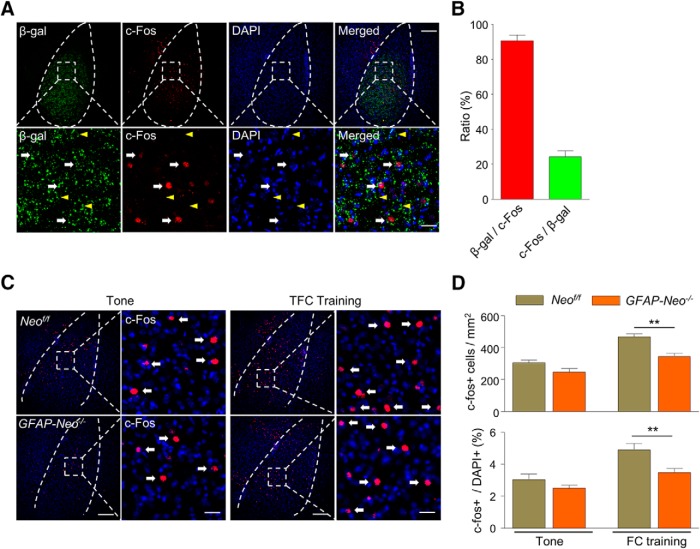
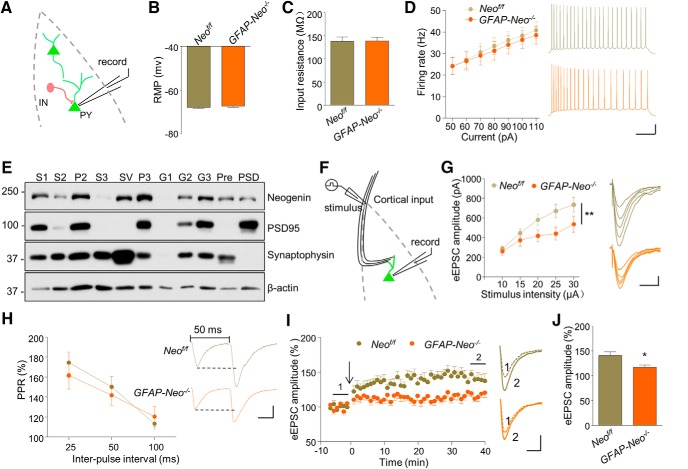
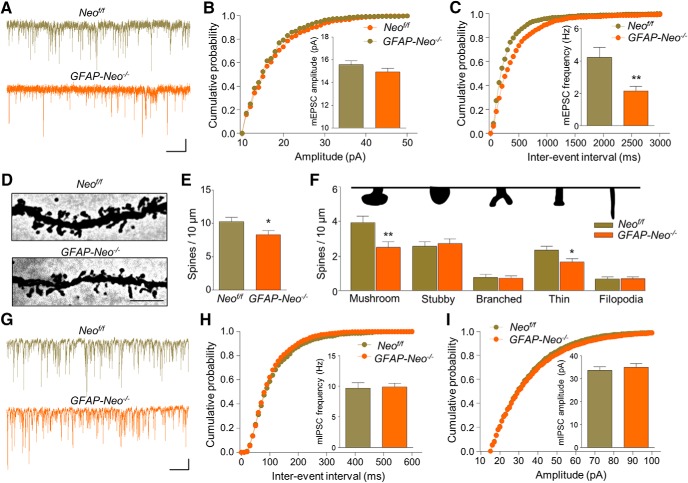
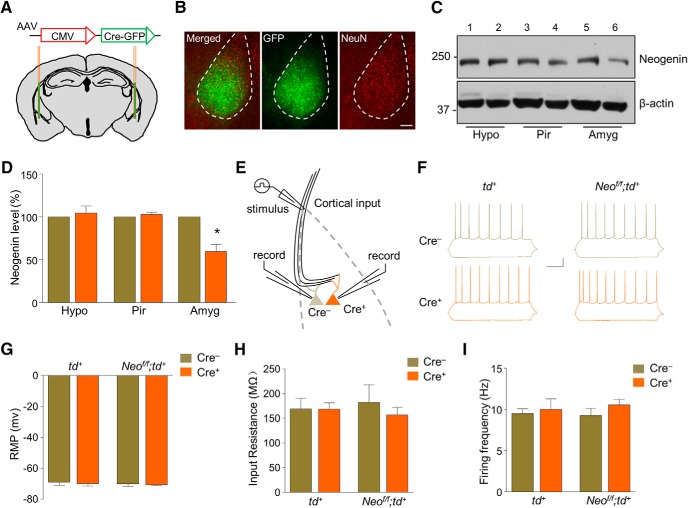
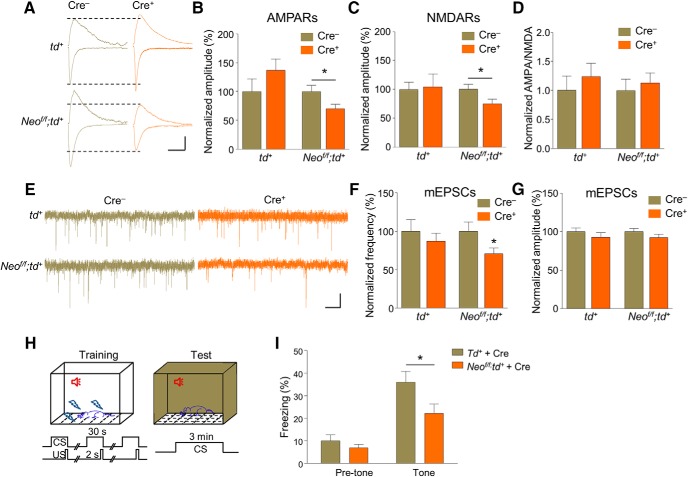
Fear learning and memory are vital for livings to survive, dysfunctions in which have been implicated in various neuropsychiatric disorders. Appropriate neuronal activation in amygdala is critical for fear memory. However, the underlying regulatory mechanisms are not well understood. Here we report that Neogenin, a DCC (deleted in colorectal cancer) family receptor, which plays important roles in axon navigation and adult neurogenesis, is enriched in excitatory neurons in BLA (Basolateral amygdala). Fear memory is impaired in male Neogenin mutant mice. The number of cFos+ neurons in response to tone-cued fear training was reduced in mutant mice, indicating aberrant neuronal activation in the absence of Neogenin. Electrophysiological studies show that Neogenin mutation reduced the cortical afferent input to BLA pyramidal neurons and compromised both induction and maintenance of Long-Term Potentiation evoked by stimulating cortical afferent, suggesting a role of Neogenin in synaptic plasticity. Concomitantly, there was a reduction in spine density and in frequency of miniature excitatory postsynaptic currents (mEPSCs), but not miniature inhibitory postsynaptic currents, suggesting a role of Neogenin in forming excitatory synapses. Finally, ablating Neogenin in the BLA in adult male mice impaired fear memory likely by reducing mEPSC frequency in BLA excitatory neurons. These results reveal an unrecognized function of Neogenin in amygdala for information processing by promoting and maintaining neurotransmission and synaptic plasticity and provide insight into molecular mechanisms of neuronal activation in amygdala.SIGNIFICANCE STATEMENT Appropriate neuronal activation in amygdala is critical for information processing. However, the underlying regulatory mechanisms are not well understood. Neogenin is known to regulate axon navigation and adult neurogenesis. Here we show that it is critical for neurotransmission and synaptic plasticity in the amygdala and thus fear memory by using a combination of genetic, electrophysiological, behavioral techniques. Our studies identify a novel function of Neogenin and provide insight into molecular mechanisms of neuronal activation in amygdala for fear processing.

Keywords: Neogenin; amygdala; fear memory; synaptic transmission.


Figures

Figure 1.
Figure 1.
Enriched expression of Neogenin in excitatory neurons in BLA. A, Enriched β-gal activity in BLA, SGZ, and VPM/VPL, but not in CeA. Top left, Diagram of coronal section. Top right, X-gal staining of brain slice of Neogenin-Lacz heterozygous mice. Bottom, Enlarged image of amygdala (amyg). Scale bars: Top, 1 mm; Bottom, 200 μm. B, Colocalization of β-gal with excitatory neuron marker Camkii. Sections were stained with antibodies against β-gal and Camkii. Bottom, Enlarged images of areas in dotted square. Arrow indicates f1, Camkii+β-gal+. Arrowhead indicates f2, Camkii+ only. Empty arrowhead indicates f3, Camkii+ cells with β-gal dots. Scale bars: Top, 120 μm; Bottom, 20 μm. C, Fewer interneurons were labeled by β-gal. Brain sections of Neogenin-Lacz;GAD67-GFP mice were stained with antibodies against β-gal and NeuN. Bottom, Enlarged images of areas in dotted square. Arrow indicates f1, GFP+β-gal+. Arrowhead indicates f2, GFP+ only. Scale bars: Top, 120 μm; Bottom, 20 μm. D, Quantitative analysis of data in B, C. Only cells whose entire soma were labeled by Camkii or GFP were scored. n = 8 slices from 3 mice.
Figure 2.
Figure 2.
Morphological characterization of GFAP-Neo−/− amygdala. A, Breeding diagram: Neogeninf/f (Neof/f) mice were crossed with GFAP-Cre mice to generate GFAP-Cre;Neogeninf/f (GFAP-Neo−/−) mice. B, Neogenin expression was dramatically decreased in amygdala of GFAP-Neo−/− mice. β-actin serves as loading control. Left, Representative blots. Right, Quantitative data. n = 3 pairs of Neof/f and GFAP-Neo−/− mice. Paired Student's t test: **p < 0.01. C, Similar axon projections in Neogenin mutant brain. acp, Posterior part of anterior commissure; ec, external capsule Scale bar, 1 mm. D, Rostral sections of Neof/f (top) and GFAP-Neo−/− (bottom) amygdala were stained for neuron marker NeuN and interneuron marker PV. Scale bar, 100 μm. E, Caudal sections of Neof/f (top) and GFAP-Neo−/− (bottom) amygdala were stained for neuron marker NeuN and interneuron marker PV. Scale bar, 100 μm. F, Quantification of NeuN+ cells in the BLA regions. n = 13 slices from 3 Neof/f mice; n = 17 slices from 3 GFAP-Neo−/− mice. Student's t test: p > 0.05. G, Quantification of PV+ cells in the BLA regions. n = 13 slices from 3 Neof/f mice; n = 17 slices from 3 GFAP-Neo−/− mice. Student's t test: p > 0.05.
Figure 3.
Figure 3.
Fear memory deficit in Neogenin mutant mice. A, Diagram of tone-cued fear conditioning. Footshocks were delivered 3 times (US, 0.5 mA, 2 s) at the end of CS (tone, 30 s) during training. One day later, freezing test was conducted by placing mice in a chamber with altered environment for 3 min with CS. B, Reduced freezing time in the presence of tone in GFAP-Neo−/− mice. n = 12 mice for each genotype. Student's t test, for pretone group: p > 0.05; for tone group: *p < 0.05. C, Representative traces of first 5 min in the open field test. D, E, Similar travel distance (D) and duration spent in the center (E) of mutant mice in 30 min. n = 12 mice for each genotype. Student's t test: p > 0.05. F, Representative traces of EPM test. G, H, No difference in duration in the open arms (G) and number of entries to open arms (H). n = 12 mice for each genotype. Student's t test: p > 0.05.
Figure 4.
Figure 4.
Impaired neuronal activation in the BLA of Neogenin knock-out mice. A, Colocalization of β-gal with neuronal activation marker c-Fos. Neogenin-Lacz heterozygous mice were subject to fear conditioning (FC) training. At 1.5 h later, brains were collected and cut into coronal slices. Sections were stained with antibodies against β-gal and c-Fos. Bottom, Enlarged images of areas in dotted square. Arrows indicate cells positive for β-gal and c-Fos. Arrowheads indicate cells positive for β-gal, but not c-Fos. Scale bars: Top, 120 μm; Bottom, 20 μm. B, Quantitative analysis of data in A. A total of 90.7% of c-Fos+ cells were β-gal positive, whereas 24.3% of β-gal positive cells were c-Fos+. n = 7 slices from 3 Neof/f mice. C, c-Fos expression in Neof/f and GFAP-Neo−/− amygdala in response to tone and TFC. At 1.5 h after tone presence or TFC, mouse brains were fixed for immunostaining with c-Fos antibodies. Right, Enlarged images of areas in dotted square. Arrows indicate cells positive for c-Fos. Scale bars: Left, 100 μm; Right, 20 μm. D, Quantitative analysis of data in C. n = 9 slices from 3 mice for each group. Student's t test: p > 0.05 for CS; **p < 0.01 for TFC.
Figure 5.
Figure 5.
Compromised excitatory synaptic transmission and synaptic plasticity in the BLA of Neogenin knock-out mice. A, Recording diagrams. Pyramidal neurons in the BLA were recorded in whole-cell configuration. B, Similar resting membrane potential (RMP) of pyramidal neurons in GFAP-Neo−/− amygdalae. n = 12 neurons from 3 mice for each genotype. Student's t test: p > 0.05. C, Unaltered membrane input resistance (Rin) of pyramidal neurons in GFAP-Neo−/− amygdala. n = 12 neurons from 3 mice for each genotype. Student's t test: p > 0.05. D, Firing rate plotted against increasing injected currents. n = 9 neurons from 3 mice for each genotype. Two-way ANOVA: F(1,112) = 0.4788, p > 0.05. Right, Representative traces of spikes in BLA pyramidal neurons evoked by injecting depolarizing currents of 50 pA. Scale bars, 200 ms, 20 mV. E, Subcellular fractions of amygdala were probed for Neogenin, the postsynaptic marker PSD95, the presynaptic marker synaptophysin, and β-actin (loading control). S1, Supernatant 1; S2, supernatant 2; P2, crude synaptosome-enriched pellet; S3, crude synaptic vesicle fraction; SV, synaptic vesicle fraction; P3, synaptosomal membrane fraction; G1, myelin fraction; G2, light membrane fraction; G3, synaptosomal plasma membrane fraction; Pre, presynaptic fraction; PSD, postsynaptic density fraction. F, Recording diagram. Pyramidal neurons in the BLA were recorded in whole-cell configuration. Cortical input pathway was stimulated. G, Downward shifted I/O curve in GFAP-Neo−/− slice. eEPSCs were recorded in BLA pyramidal neurons in response to stimulation of the cortical pathway with increasing intensities. n = 9 neurons from 3 mice for each genotype. Two-way ANOVA: **p < 0.01. Right, Representative eEPSC traces. Scale bars, 20 ms, 150 pA. H, PPRs plotted against interstimulus intervals. n = 12 neurons from 3 Neof/f mice; n = 13 neurons from 3 GFAP-Neo−/− mice. Two-way ANOVA: p > 0.05. Right, Representatives sweeps with interstimulus interval of pair-pulse stimulations at 50 ms. Scale bars, 20 ms, 50 pA. I, Suppressed LTP expression in GFAP-Neo−/− BLA. Whole-cell LTP was recorded in BLA excitatory neurons in response to stimulation of the cortical pathway. Arrow indicates the time of LTP induction. Representative eEPSC traces of pre (1) and post (2) induction. Scale bars, 20 ms, 50 pA. J, Quantitative analysis of data in I. n = 7 neurons from 3 Neof/f mice; n = 9 neurons from GFAP-Neo−/− mice. Student's t test: *p < 0.05.
Figure 6.
Figure 6.
Reduced mEPSC frequency and spine density in the BLA of Neogenin mutant mice. A, Representative traces of mEPSCs in BLA pyramidal neurons from Neof/f and GFAP-Neo−/− mice. Scale bars, 2 s, 10 pA. B, Cumulative probability plots and histograms of mEPSC amplitude. n = 18 neurons from 4 mice for each genotype. Student's t test: p > 0.05. C, Cumulative probability plots of mEPSC interevent intervals and histograms of mEPSC frequency. n = 18 neurons from 4 mice for each genotype. Student's t test: **p < 0.01. D, Representative images in Golgi staining. Scale bars, 5 μm. E, Decreased spine density in BLA pyramidal neurons of GFAP-Neo−/− mice. n = 13 neurons from 3 Neof/f mice; n = 15 neurons from 4 GFAP-Neo−/− mice. Student's t test: *p < 0.05. F, Decreased densities of mushroom and thin spines in BLA pyramidal neurons of GFAP-Neo−/− mice. n = 13 neurons from 3 Neof/f mice and n = 15 neurons from 4 GFAP-Neo−/− mice. Student's t test: for mushroom, **p < 0.01; for thin, *p < 0.05; for the rest, p > 0.05. Top, Diagram of spine shape. G, Representative traces of mIPSCs in BLA pyramidal neurons from Neof/f and GFAP-Neo−/− mice. Scale bars, 2 s, 20 pA. H, I, Cumulative probability plots of mIPSC interevent intervals and histograms of mIPSC frequency (H) and amplitude (I). n = 16 neurons from 4 Neof/f mice; n = 17 neurons from 4 GFAP-Neo−/− mice. Student's t test: p > 0.05.
Figure 7.
Figure 7.
Unaffected neuronal intrinsic property by Cre virus infection and Neogenin mutation. A, A schematic of virus injection. CMV promoter-driven Cre virus was injected bilaterally into BLA region. B, Expression of GFP in virus-injected mice. Amygdala sections were stained with GFP and NeuN antibodies 3 weeks after stereotaxic microinjection of AAV-Cre-GFP virus. Scale bar, 100 μm. C, Reduced Neogenin expression in amygdala of Neof/f;td+ mice injected with AAV-Cre-GFP virus, compared with that from td+ mice. β-actin serves as loading control. Shown are representative blots. 1, 3, 5: samples from td+ mice; 2, 4, 6: samples from Neof/f;td+ mice. Hypo, Hypothalamus; Pir, piriform cortex; Amyg, amygdala. D, Quantitative analysis of data in C. n = 3 pairs of td+ and Neof/f;td+ mice for Hypo and Pir groups; n = 4 pairs for Amyg group. Paired Student's t test: Hypo and Pir groups, p > 0.05; Amyg group, *p < 0.05. E, Diagram of the paired-recording configuration. Dark orange represents a Cre+ pyramidal neuron. Cortical input pathway was stimulated. F, Representative traces in BLA pyramidal neurons in response to current injection of −50 pA and 50 pA, respectively. Scale bars, 40 ms, 50 pA. G, Characterization of resting membrane potential (RMP) of pyramidal neurons. n = 6 neuron pairs from 3 td+ mice; n = 7 neuron pairs from 3 Neof/f;td+ mice. Paired t test: p > 0.05. H, Characterization of membrane input resistance (Rin) of pyramidal neurons. n = 6 neuron pairs from 3 td+ mice; n = 7 neuron pairs from 3 Neof/f;td+ mice. Student's t test: p > 0.05. I, Firing frequency was not altered by injecting 50 pA current. n = 6 neuron pairs from 3 td+ mice; n = 7 neuron pairs from 3 Neof/f;td+ mice. Student's t test: p > 0.05.
Figure 8.
Figure 8.
Neogenin in BLA neurons regulates excitatory synaptic transmission in a cell-autonomous manner. A, Representative AMPARs (down) and NMDARs (up)-mediated EPSC traces recorded from Cre/Cre+ neuronal pairs in the BLA in td+ and Neof/f;td+ mice injected with AAV-Cre-GFP virus. Scale bars, 40 ms, 50 pA. B, Quantification of AMPAR-mediated EPSC amplitude, which was normalized to the mean EPSC amplitude of Cre neurons. n = 11 pairs from 4 td+ mice; n = 16 pairs from 5 Neof/f;td+ mice. Paired Student's t test: *p < 0.05. C, Quantification of NMDAR-mediated EPSC amplitude, which was normalized to the mean EPSC amplitude of Cre neurons. n = 11 pairs from 4 td+ mice; n = 15 pairs from 5 Neof/f;td+ mice. Paired Student's t test: *p < 0.05. D, Similar AMPA/NMDA ratios between Cre and Cre+ neurons in td+ and Neof/f;td+ mice. n = 9 pairs from 4 td+ mice; n = 10 pairs from 4 Neof/f;td+ mice. Paired Student's t test: p > 0.05. E, Representative mEPSC traces. Scale bars, 1 s, 10 pA. F, Reduced mEPSC frequency in mutant mice. n = 9 pairs from 4 td+ mice; n = 10 pairs from 4 Neof/f;td+ mice. Paired Student's t test: for td+ group, p > 0.05; for Neof/f;td+ group, *p < 0.05. G, Similar mEPSC amplitudes. n = 9 pairs from 4 td+ mice; n = 10 pairs from 4 Neof/f;td+ mice. Paired Student's t test: p > 0.05. H, Diagram of tone-cued fear conditioning, as described above. I, Reduced freezing time in the presence of tone in Neof/f;td+ mice with Cre virus. n = 12 mice for each group. Student's t test: *p < 0.05.

Similar articles

Cited by

References

    1. Bolton MM, Heaney CF, Sabbagh JJ, Murtishaw AS, Magcalas CM, Kinney JW (2012) Deficits in emotional learning and memory in an animal model of schizophrenia. Behav Brain Res 233:35–44. 10.1016/j.bbr.2012.04.049 - DOI - PMC - PubMed
    1. Bradford D, Faull RL, Curtis MA, Cooper HM (2010) Characterization of the netrin/RGMa receptor neogenin in neurogenic regions of the mouse and human adult forebrain. J Comp Neurol 518:3237–3253. 10.1002/cne.22397 - DOI - PubMed
    1. Chen Y, Rex CS, Rice CJ, Dubé CM, Gall CM, Lynch G, Baram TZ (2010) Correlated memory defects and hippocampal dendritic spine loss after acute stress involve corticotropin-releasing hormone signaling. Proc Natl Acad Sci U S A 107:13123–13128. 10.1073/pnas.1003825107 - DOI - PMC - PubMed
    1. De Vries M, Cooper HM (2008) Emerging roles for neogenin and its ligands in CNS development. J Neurochem 106:1483–1492. 10.1111/j.1471-4159.2008.05485.x - DOI - PubMed
    1. Dong ZF, Tang LJ, Deng GF, Zeng T, Liu SJ, Wan RP, Liu T, Zhao QH, Yi YH, Liao WP, Long YS (2014) Transcription of the human sodium channel SCN1A gene is repressed by a scaffolding protein RACK1. Mol Neurobiol 50:438–448. 10.1007/s12035-014-8633-9 - DOI - PubMed

Publication types

LinkOut - more resources