. 2018 Sep 18;9(1):3797.
doi: 10.1038/s41467-018-06085-5.

Alpha kinase 1 controls intestinal inflammation by suppressing the IL-12/Th1 axis

Affiliations

Alpha kinase 1 controls intestinal inflammation by suppressing the IL-12/Th1 axis

Grigory Ryzhakov et al. Nat Commun. .

Abstract

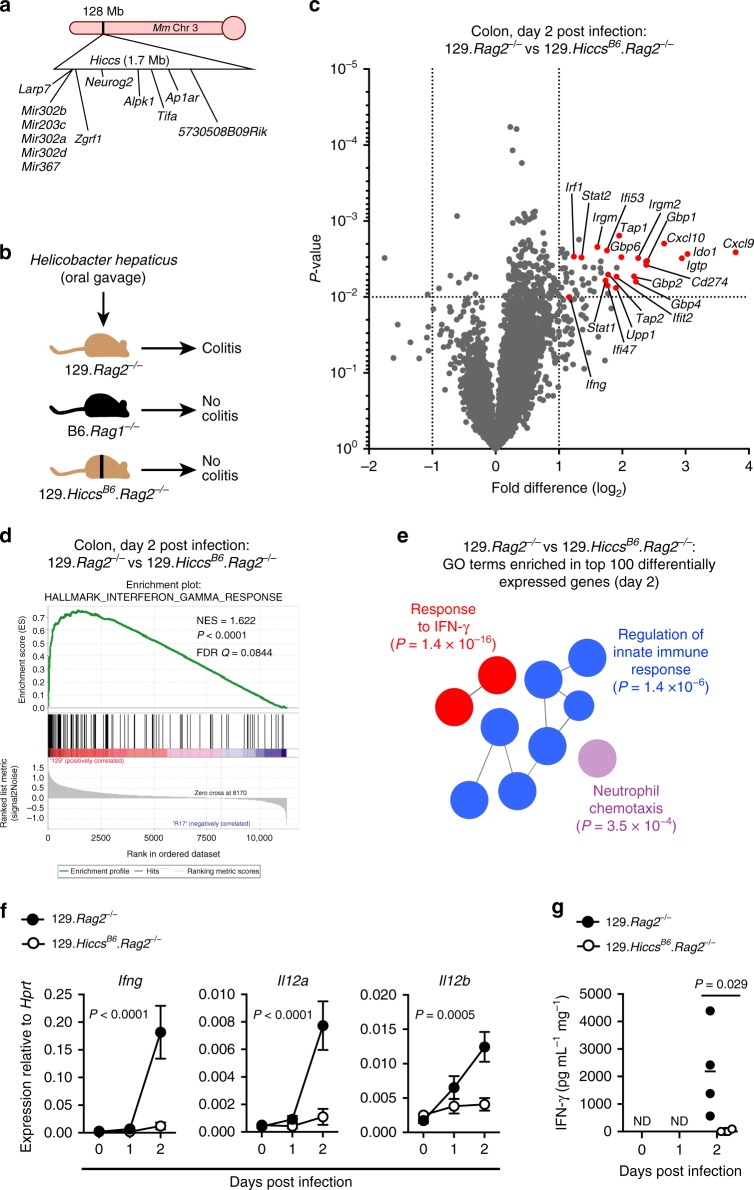
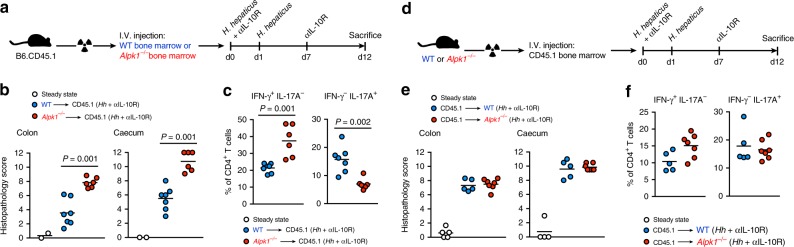
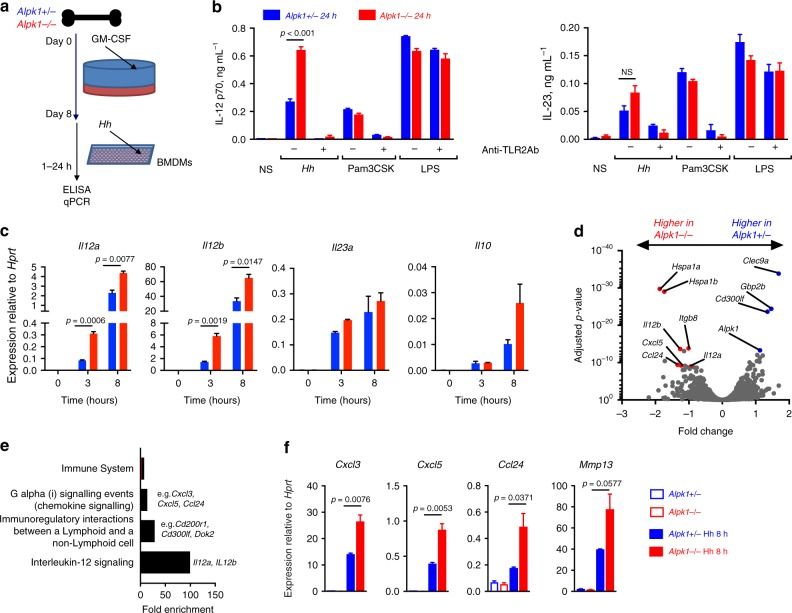
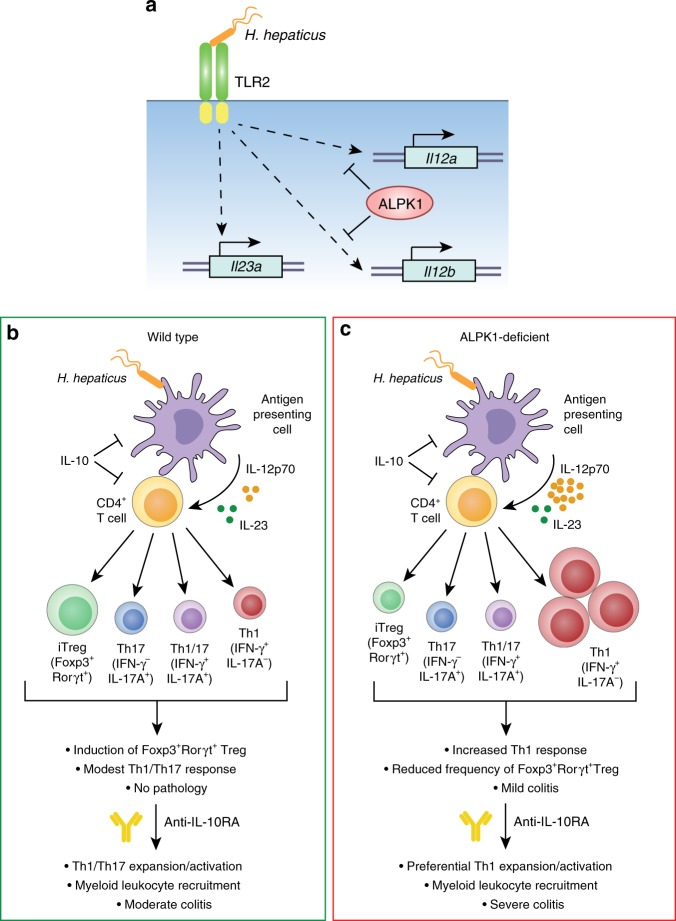
Inflammatory bowel disease (IBD) are heterogenous disorders of the gastrointestinal tract caused by a spectrum of genetic and environmental factors. In mice, overlapping regions of chromosome 3 have been associated with susceptibility to IBD-like pathology, including a locus called Hiccs. However, the specific gene that controls disease susceptibility remains unknown. Here we identify a Hiccs locus gene, Alpk1 (encoding alpha kinase 1), as a potent regulator of intestinal inflammation. In response to infection with the commensal pathobiont Helicobacter hepaticus (Hh), Alpk1-deficient mice display exacerbated interleukin (IL)-12/IL-23 dependent colitis characterized by an enhanced Th1/interferon(IFN)-γ response. Alpk1 controls intestinal immunity via the hematopoietic system and is highly expressed by mononuclear phagocytes. In response to Hh, Alpk1-/- macrophages produce abnormally high amounts of IL-12, but not IL-23. This study demonstrates that Alpk1 promotes intestinal homoeostasis by regulating the balance of type 1/type 17 immunity following microbial challenge.


Conflict of interest statement

The authors declare no competing interests.

Figures

Fig. 1
Fig. 1
129.Rag2−/− mice rapidly activate interferon-gamma signaling following infection with Hh. a Schematic of the Hiccs locus, which regulates sensitivity to Hh-driven innate colitis. b Colitis phenotypes after Hh infection of B6.Rag1−/−, 129.Rag2−/−, or congenic 129.Rag2−/− mice bearing a Hiccs locus that matches the B6 genotype (129.HiccsB6.Rag2−/−). ce Transcriptomic profiling of whole-colon tissue from 129.Rag2−/− and 129.HiccsB6.Rag2−/− mice 2 days after oral Hh infection (n = 4 per group). c Tornado plot displaying log2 fold differences in 129.Rag2−/− versus 129.HiccsB6.Rag2−/− mice. IFN-γ-regulated genes are indicated in red. d Gene set enrichment analysis (GSEA), showing enrichment of the “interferon-gamma response” hallmark gene set in colon tissue from 129.Rag2−/− mice. e The top 100 differentially expressed genes (high in 129.Rag2−/− mice) were analyzed for gene ontology (GO) term enrichment using ClueGO. The most highly enriched GO terms are shown, with lead terms and associated p-values indicated. f RT-qPCR analysis of whole-colon gene expression after Hh infection. Data analyzed by two-way ANOVA (n = 4 per group per time point). P-values indicate day 2 comparisons corrected with Sidak’s multiple comparisons tests (DF = 17 for each comparison). g IFN-γ secretion by colon explant tissue cultured overnight ex vivo at steady state or following Hh infection. ND no IFN-γ detected in culture supernatant. Data (Hh day 2) analyzed by Mann–Whitney test (n = 4 per group/timepoint). Data in cg are from one experiment
Fig. 2
Fig. 2
Alpk1-deficient mice are highly susceptible to Hh-induced innate colitis. a Experimental schematic of Hh infection using B6.Rag1−/−Alpk1−/− mice or B6.Rag1−/−Alpk1+/– littermate controls. b Representative H&E stained mid-colon cross-sections at steady state and after 12 days of Hh infection. Scale bars = 100 μm. cd Overall colon histopathology scores (c) and histopathology scores along the length of the large intestine, from caecum to distal colon (d). Steady state (n = 5), B6.Rag1−/−Alpk1−/− + Hh (n = 5) and B6.Rag1−/−Alpk1+/– + Hh (n = 6). Data shown are from one of three representative experiments and only the Hh-treated groups were analyzed by Mann–Whitney test (c) or by two-way ANOVA (genotypes of the Hh infected groups compared, corrected with Sidak’s multiple comparisons test, DF = 52) (d). ef Flow cytometry analysis of cytokine expression by colon lymphocyte and myeloid populations after PMA/ionomycin restimulation. Frequency of IFN-γ expression among ILCs, geometric mean fluorescence intensity (gMFI) of IFN-γ+ cells, and frequency of TNF expression among myeloid cells are shown in f. Only the Hh-treated groups were taken into analysis by Mann–Whitney test. g Whole-colon expression of Ifng, IFN-γ-regulated genes, and selected inflammatory cytokines analyzed by RT-qPCR. Only the Hh-treated groups were analyzed by Mann–Whitney test. eg Data summarize two independent experiments: steady state (n = 4), B6.Rag1−/−Alpk1−/− + Hh (n = 6) and B6.Rag1−/−Alpk1+/– + Hh (n = 7). h Colon histopathology scores from steady-state mice (n = 6), Hh-infected B6.Rag1−/−Alpk1+/– mice (n = 15), and B6.Rag1−/−Alpk1−/− animals infected with Hh and treated with IgG isotype control antibodies (n = 12), IL-12p40 neutralizing antibodies (n = 6), or IL-23R neutralizing antibodies (n = 6). Data were pooled from two independent experiments and analyzed by two-way ANOVA. P-values indicate treatment comparisons (B6.Rag1−/−Alpk1−/− + Hh IgG vs anti-p40 or IgG vs anti-IL23R) corrected with Sidak’s multiple comparisons tests (DF = 159 for each comparison)
Fig. 3
Fig. 3
Alpk1 deficiency in haematopoietic cells drives exacerbated colitis and intestinal Th1 responses in Hh-infected lymphocyte-replete mice. a Experimental schematic of colitis induced by oral infection with Hh and systemic blockade of the IL-10 receptor (legend applies to bg). For panels c, e, and g, data shown summarize two independent experiments: steady state (n = 9), Hh/αIL-10R-treated Alpk1+/+ and Alpk1+/− (n = 11), and Alpk1−/− (n = 6). b Representative H&E stained mid-colon cross-sections at steady state and following 12 days of Hh infection and αIL-10R treatment. Scale bars = 100 μm. c Colon histopathology scores. Only Hh-treated groups analyzed by Mann–Whitney test. d Colonoscopy-based colitis scores from one of two experiments, the Hh-treated groups were analyzed by Mann–Whitney test. Steady state (n = 6); Hh/αIL-10R-treated Alpk1+/− (n = 4); Hh/αIL-10R-treated Alpk1−/− (n = 4). e Total live CD45+ colon lamina propria leucocytes in steady state and colitic mice. Hh-treated groups were analyzed by Mann–Whitney test. fg Flow cytometry analysis of cytokine expression by colon lamina propria CD4+ T cells stimulated with PMA and ionomycin in the presence of brefeldin A. f Representative plots of IFN-γ and IL-17A expression. g Frequencies of IFN-γ+ IL-17A and IFN-γ IL-17A+ cells among total CD4+ T cells, two Hh-treated groups were analyzed by Mann–Whitney test. hk Analysis of Alpk1+/− and Alpk1−/− mice at steady state (n = 6), or after 2 weeks of treatment with IL-10R neutralizing antibody (Alpk1+/− n = 6; Alpk1−/− n = 4), infection with Hh (Alpk1+/− n = 7; Alpk1−/− n = 6), or treatment with anti-IL-10R antibody and infection with Hh (Alpk1+/− n = 4; Alpk1−/− n = 4). Data represent two independent experiments. Bar charts indicate means ± SEM, compared using multiple t-tests with Holm-Sidak multiple testing correction. h Colonoscopy-based colitis scores. i Whole-colon gene expression analysis by RT-qPCR. j Representative flow cytometry analysis of colonic CD4+ T cells at steady state or after Hh infection without anti-IL-10R treatment. Top panels depict IFN-γ and IL-17A expression after stimulation with PMA/ionomycin and brefeldin-A; bottom panels depict RORγt and FOXP3 expression in unstimulated cells. k Frequencies and absolute numbers of CD4+ IFN-γ+ T cells (left two panels). Frequencies of CD4+ FOXP3+ and CD4+ FOXP3+RORγt+ T cells are shown in the right two panels
Fig. 4
Fig. 4
Control of colitis by Alpk1 depends on its expression in the hematopoietic compartment. af Reciprocal bone marrow chimaera experiments in which B6.CD45.1 mice are irradiated and reconstituted with wild type or Alpk1−/− bone marrow ac, or wild type and Alpk1−/− mice are irradiated and reconstituted with wild-type B6.CD45.1 bone marrow df. After reconstitution, mice are subjected to Hh + αIL-10R colitis. The Hh-treated groups were compared using Mann–Whitney tests. ac Colon and caecal histopathology scores (b) and frequencies of IFN-γ+ IL-17A and IFN-γ IL-17A+ cells among total colonic CD4+ T cells (c). n = 7 recipients of WT bone marrow, n = 6 recipients of Alpk1−/− bone marrow, and n = 2 steady state. One experiment was performed. df Colon and caecal histopathology scores (e) and frequencies of IFN-γ+ IL-17A and IFN-γ IL-17A+ cells among total colonic CD4+ T cells (f). n = 5 WT recipients, n = 7 Alpk1−/− recipients, and n = 5 steady state. One experiment was performed
Fig. 5
Fig. 5
Alpk1 controls Hh-induced immune gene expression by in vitro differentiated macrophages. a Mouse bone marrow-derived macrophages (BMDMs) were differentiated for 8 days in the presence of GM-CSF for subsequent stimulation with Hh and TLR agonists. b Analysis of IL-12 and IL-23 expression by ELISA. Alpk+/− or Alpk1−/− BMDMs were stimulated with Hh (0.5 O.D. mL1), Pam3CSK (100 ng mL1) or LPS (100 ng mL1) in the presence or absence of a neutralizing anti-TLR2 (0.3 μg mL1) antibody. Data shown are from pooled bone marrows (n = 3) from one of two independent experiments, data from the Hh-treated group were analyzed by two-tailed unpaired t-test (t = 12.99; df = 4). Bars indicate mean of three replicates ± SEM. c Analysis of gene expression by qRT-PCR of BMDMs stimulated with Hh (0.5 O.D. mL1) for 3 or 8 h. Data are from pooled bone marrows (n = 3) from one of three independent experiments. P-values corrected using the Holm-Sidak method are shown. Bars indicate mean of three replicates ± SEM. d Volcano plot depicting global gene expression in Hh-treated Alpk1+/− vs Alpk1−/− BMDMs. Differences in gene expression between genotypes are expressed as log2 fold change (x-axis) with adjusted p-values (y-axis). e Enriched pathways in Alpk1−/− cells based on top differentially expressed genes in Hh-treated Alpk1+/− vs Alpk1−/− BMDMs. The overrepresentation analysis was carried out using the Reactome pathways and the Panther database. f qRT-PCR validation of top differentially expressed genes revealed by RNA-Seq analysis in Alpk1+/− and Alpk1−/− BMDMs. Data shown are from pooled bone marrows (n = 3) from one of two independent experiments, analysed by unpaired t-test. Bars indicate mean of three replicates ± SEM
Fig. 6
Fig. 6
Alpk1 expression is elevated in inflamed mucosa of IBD patients and correlates with expression of Th1 signature genes. a ALPK1 mRNA expression in intestinal biopsies of healthy controls or IBD patients from three independent publicly available cohorts described in Materials and Methods (Cohort A, GSE4183; Cohort B, GSE16879; Cohort C, GSE57945). Groups were compared by Mann–Whitney test (cohorts A and B) or Kruskal–Wallis test with Dunn’s multiple comparisons tests (cohort C). Bars indicate mean z-scores ± SEM. b RNA-seq gene expression analysis of ileal biopsies from healthy control (n = 42) and ileal CD patients (Cohort C). CD samples were stratified by relative ALPK1 expression into three equally sized groups (n = 54 per group) and compared using the Kruskal–Wallis test. Bars indicate mean log2 RPKM values ± 95% CI, normalized to the control mean
Fig. 7
Fig. 7
Working model for the role of Alpk1 in controlling gut immune homoeostasis. a TLR2 signaling in response to Helicobacter hepaticus induces expression of Il12a, Il12b, and Il23a in antigen presenting cells (APCs). Alpk1 selectively inhibits expression of Il12a and Il12b, but does not significantly restrain Il23a expression. b In wild-type APCs, control of Il12a and Il12b expression by Alpk1 results in balanced and modest secretion of IL-12p70 and IL-23 in response to H. hepaticus. IL-10 acts independently to further control release of pro-inflammatory cytokines. This results in activation of FOXP3+RORγt+ inducible Tregs and modest induction of Th1 and Th17 effector CD4+ T cells, which does not cause detectable pathology or significant alterations in effector cytokine production in the gut. Additional blockade of IL-10 signaling using an anti-IL10R antibody results in robust activation of a mixed population of Th17 and Th1 effector T cells, recruitment and activation of myeloid cells, and moderate colitis. c In Alpk1-deficient mice, H. hepaticus stimulates potent production of IL-12, which promotes polarized activation of pro-inflammatory Th1 effector T cells at the expense of Tregs and Th17 cells, and mild but detectable inflammation. Following blockade of IL-10R, Th1 cells expand dramatically, inflammatory myeloid populations are recruited to the intestine, and severe colitis ensues. This demonstrates that Alpk1 controls the quality of T cell responses following Helicobacter challenge by restraining IL-12 production and Th1 differentiation, thus promoting a balanced Treg/Th17/Th1 response that maintains homoeostasis. In an Alpk1-deficient setting, Th1 differentiation dominates the Helicobacter-induced T cell response, but IL-10 acts in parallel to restrain Th1 cell expansion and innate inflammation. Removal of both homoeostatic control mechanisms (Alpk1 and IL-10) allows the rapid onset of Th1-driven colitis and ensuing tissue destruction

References

    1. Mahler M, et al. Differential susceptibility of inbred mouse strains to dextran sulfate sodium-induced colitis. Am. J. Physiol. 1998;274:G544–G551. - PubMed
    1. Buettner M, Bleich A. Mapping colitis susceptibility in mouse models: distal chromosome 3 contains major loci related to Cdcs1. Physiol. Genom. 2013;45:925–930. doi: 10.1152/physiolgenomics.00084.2013. - DOI - PubMed
    1. Boulard O, Kirchberger S, Royston DJ, Maloy KJ, Powrie FM. Identification of a genetic locus controlling bacteria-driven colitis and associated cancer through effects on innate inflammation. J. Exp. Med. 2012;209:1309–1324. doi: 10.1084/jem.20120239. - DOI - PMC - PubMed
    1. Snapper SB, et al. Wiskott-Aldrich syndrome protein-deficient mice reveal a role for WASP in T but not B cell activation. Immunity. 1998;9:81–91. doi: 10.1016/S1074-7613(00)80590-7. - DOI - PubMed
    1. Beckwith J, Cong Y, Sundberg JP, Elson CO, Leiter EH. Cdcs1, a major colitogenic locus in mice, regulates innate and adaptive immune response to enteric bacterial antigens. Gastroenterology. 2005;129:1473–1484. doi: 10.1053/j.gastro.2005.07.057. - DOI - PubMed

Publication types

MeSH terms