

The added value of online user-generated content in traditional methods for influenza surveillance
- PMID: 30228285
- PMCID: PMC6143510
- DOI: 10.1038/s41598-018-32029-6
The added value of online user-generated content in traditional methods for influenza surveillance
Abstract
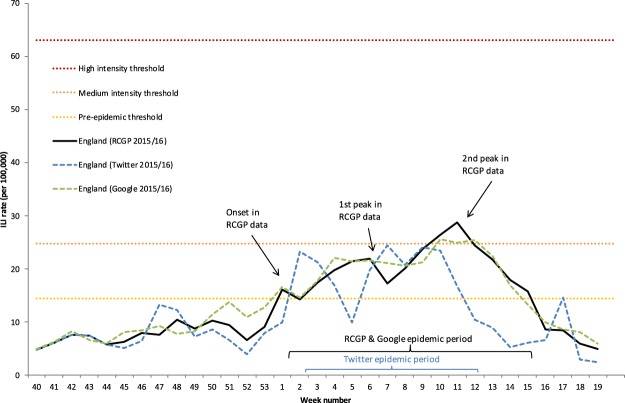
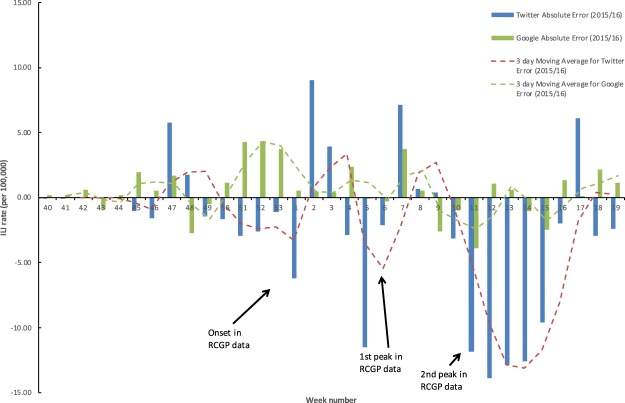
There has been considerable work in evaluating the efficacy of using online data for health surveillance. Often comparisons with baseline data involve various squared error and correlation metrics. While useful, these overlook a variety of other factors important to public health bodies considering the adoption of such methods. In this paper, a proposed surveillance system that incorporates models based on recent research efforts is evaluated in terms of its added value for influenza surveillance at Public Health England. The system comprises of two supervised learning approaches trained on influenza-like illness (ILI) rates provided by the Royal College of General Practitioners (RCGP) and produces ILI estimates using Twitter posts or Google search queries. RCGP ILI rates for different age groups and laboratory confirmed cases by influenza type are used to evaluate the models with a particular focus on predicting the onset, overall intensity, peak activity and duration of the 2015/16 influenza season. We show that the Twitter-based models perform poorly and hypothesise that this is mostly due to the sparsity of the data available and a limited training period. Conversely, the Google-based model provides accurate estimates with timeliness of approximately one week and has the potential to complement current surveillance systems.
Conflict of interest statement
The authors declare no competing interests.
Figures
References
-
- Culotta, A. Towards detecting influenza epidemics by analyzing Twitter messages. In Proceedings of the First Workshop on Social Media Analytics, 10.1145/1964858.1964874 (ACM, 2010).
Publication types
MeSH terms
LinkOut - more resources
Full Text Sources
Other Literature Sources
Medical
