. 2018 Sep 18;8(1):14012.
doi: 10.1038/s41598-018-32356-8.

Knock-down of AHCY and depletion of adenosine induces DNA damage and cell cycle arrest

Affiliations

Knock-down of AHCY and depletion of adenosine induces DNA damage and cell cycle arrest

Lucija Belužić et al. Sci Rep. .

Abstract

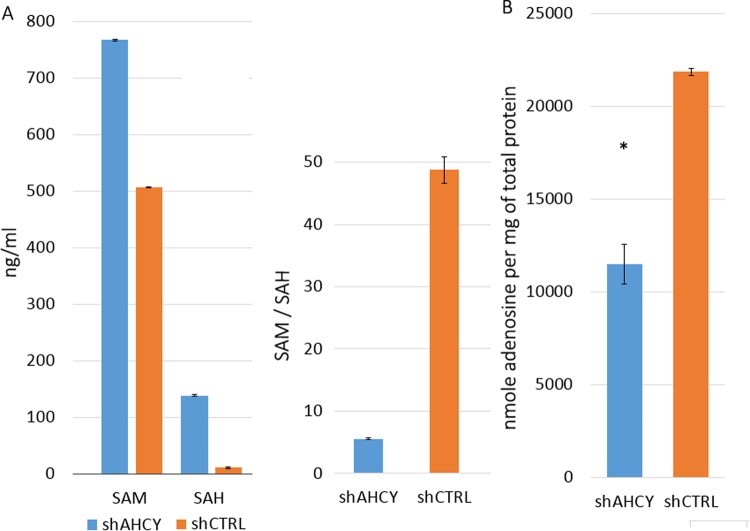
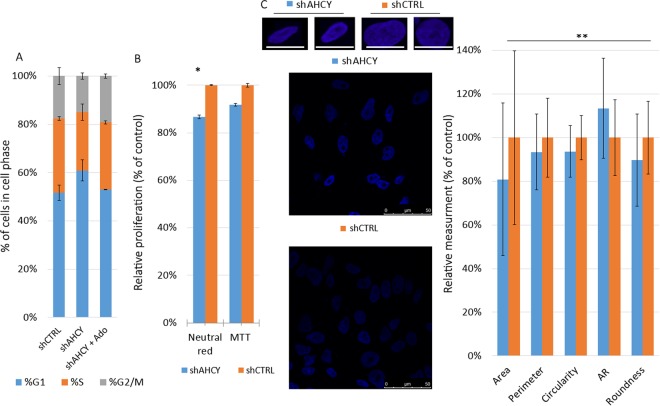
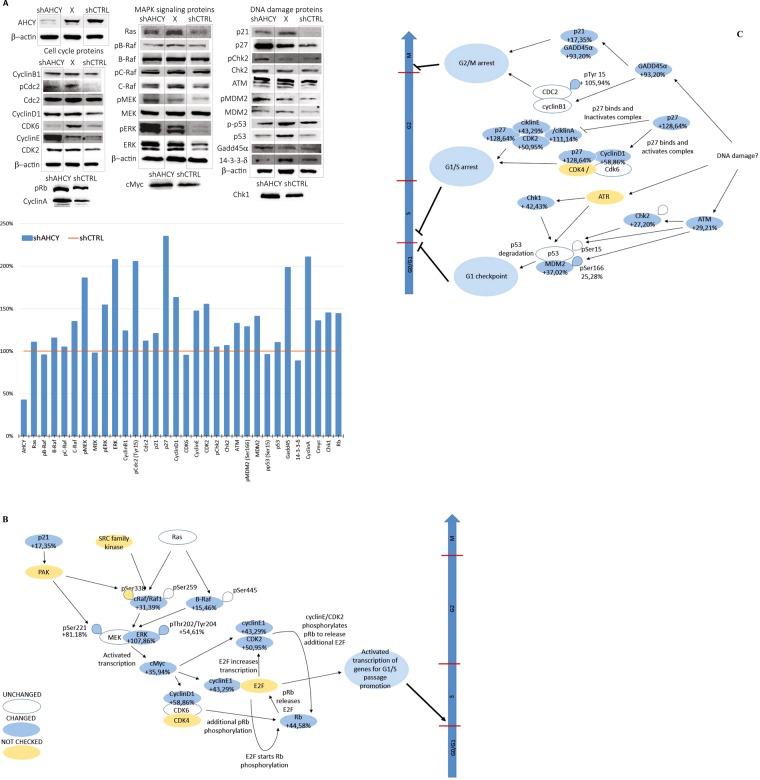
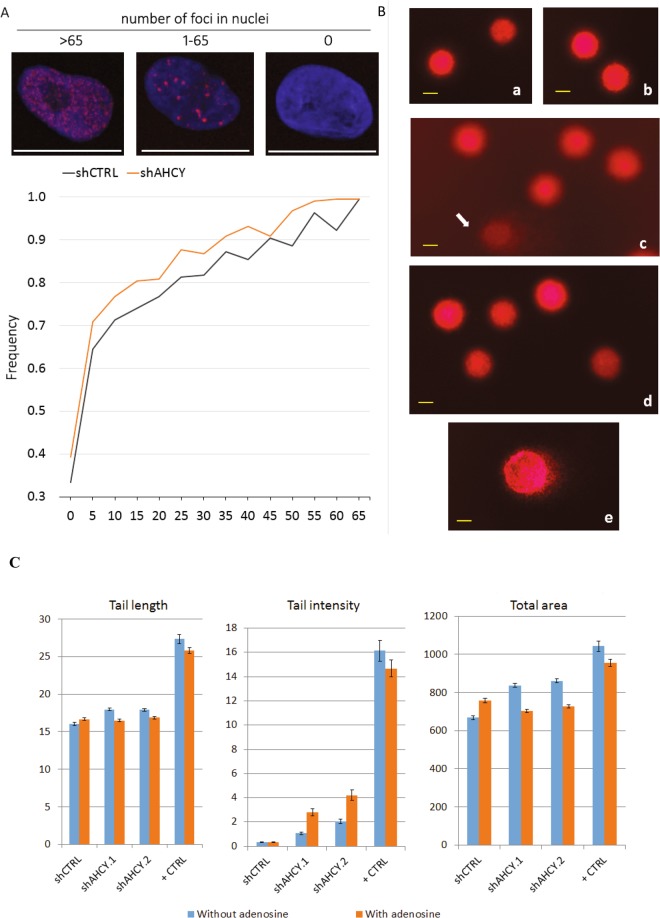
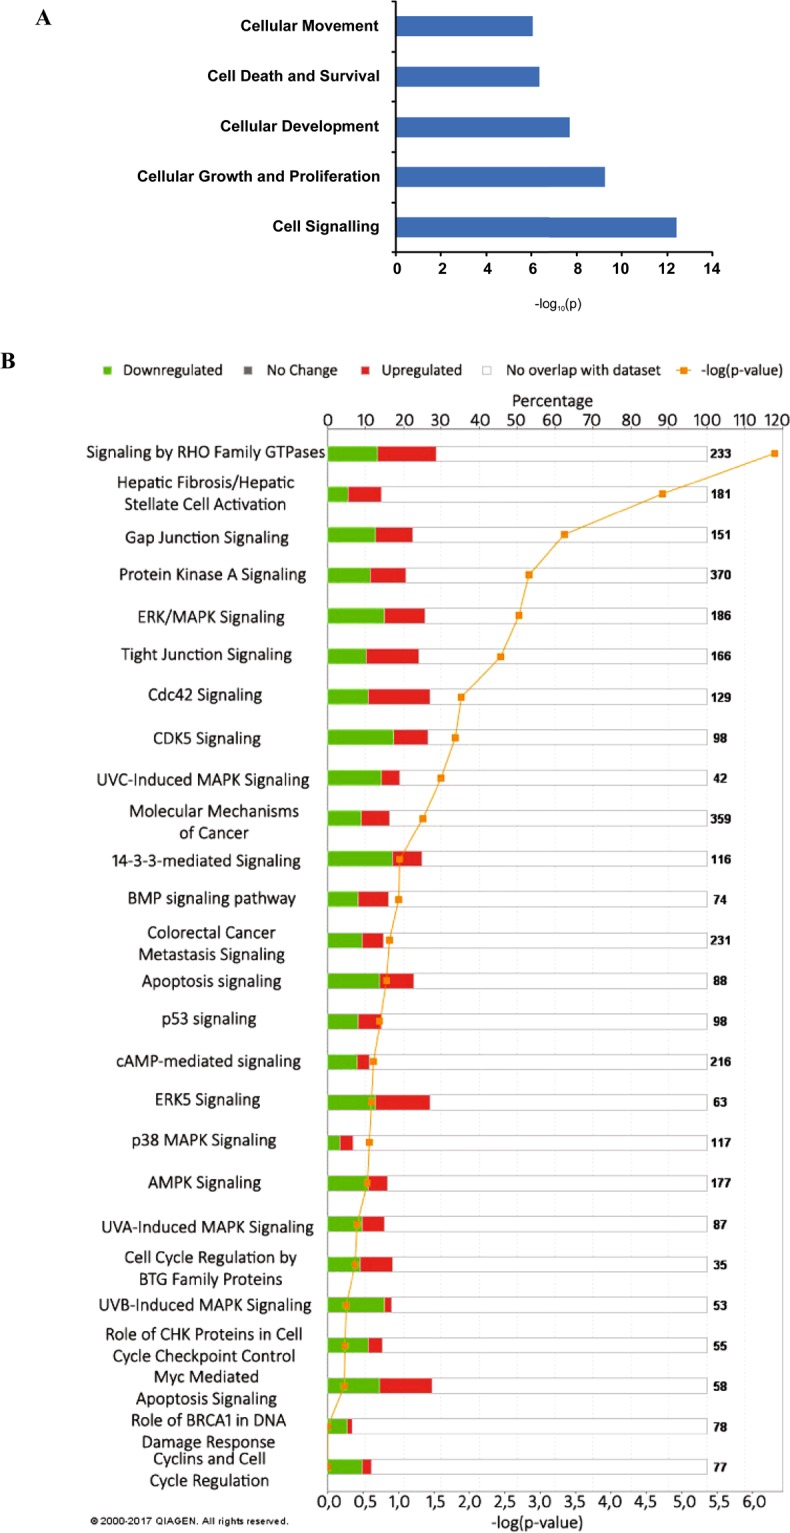
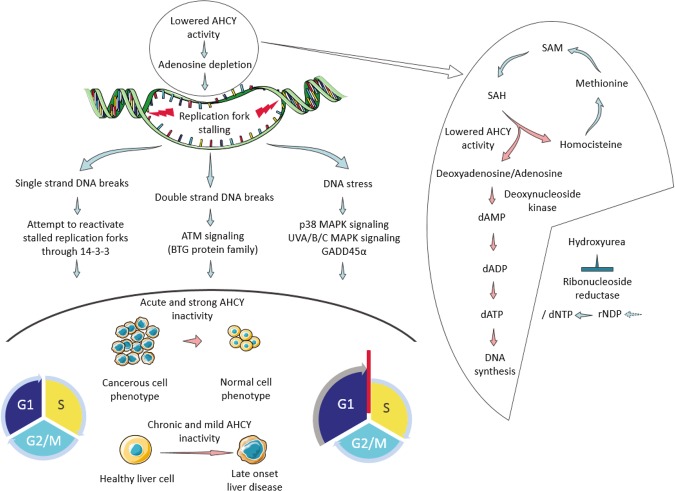
Recently, functional connections between S-adenosylhomocysteine hydrolase (AHCY) activity and cancer have been reported. As the properties of AHCY include the hydrolysis of S-adenosylhomocysteine and maintenance of the cellular methylation potential, the connection between AHCY and cancer is not obvious. The mechanisms by which AHCY influences the cell cycle or cell proliferation have not yet been confirmed. To elucidate AHCY-driven cancer-specific mechanisms, we pursued a multi-omics approach to investigate the effect of AHCY-knockdown on hepatocellular carcinoma cells. Here, we show that reduced AHCY activity causes adenosine depletion with activation of the DNA damage response (DDR), leading to cell cycle arrest, a decreased proliferation rate and DNA damage. The underlying mechanism behind these effects might be applicable to cancer types that have either significant levels of endogenous AHCY and/or are dependent on high concentrations of adenosine in their microenvironments. Thus, adenosine monitoring might be used as a preventive measure in liver disease, whereas induced adenosine depletion might be the desired approach for provoking the DDR in diagnosed cancer, thus opening new avenues for targeted therapy. Additionally, including AHCY in mutational screens as a potential risk factor may be a beneficial preventive measure.


Conflict of interest statement

The authors declare no competing interests.

Figures

Figure 1
Figure 1
SAM/SAH and adenosine measurements. (A) Levels of SAM and SAH (ng/ml) and their ratio (SAM/SAH) in the lysates of AHCY-silenced and control cells, as measured by LC-MS/MS. ± SD is represented as vertical line and is based on three independent measurements. (B) Adenosine was determined in the deproteinised cell lysates of AHCY-knockdown and control cells using an Adenosine Assay kit (BioVision) and represented as nmole adenosine per mg of total protein in the cell lysate. Vertical lines represent ± SD of two 2 individual measurements performed in triplicates for each sample (*means P < 0.05; determined by two tailed t-test).
Figure 2
Figure 2
Morphometric and cell cycle analysis. (A) Effects of AHCY silencing on the cell cycle distribution determined by flow cytometry after staining with propidium iodide. G1, S and G2/M indicate the cell phase in question. The graphs show the mean ± SD of three independent experiments performed in triplicate for each tested sample. (B) Changes in the cell proliferation rates of AHCY-silenced cells compared to control cells, as determined by NRA and MTT tests. The graphs show the mean ± SD of three independent experiments performed in at least 10 wells/cell line (* means P < 0.0.05; determined by two tailed t-test). (C) Upper panel: representative nuclei images (blue: DAPI). Centered is a field of view containing >10 cells for each condition. Graph: changes in the main nuclear morphometric features in % when compared with shCTRL set as 100% (mean of more than 100 nuclei; ** means p < 0.01 determined by two tailed t-test). Imaged with a Leica SP8 X FLIM confocal microscope (HC PL APO CS2 63 ×/1.40 OIL objective); scale bar, 50 µm.
Figure 3
Figure 3
Proposed effects of AHCY silencing on cell cycle regulating proteins and checkpoints based on Western blotting results. (A) Upper panel: Protein expression levels (names listed in Table 2) analysed by Western blotting (30–80 μg of whole cell proteins loaded per well). Bands in lane marked with “X” were not analysed. Lower panel: Signal densitometry was performed using ImageJ software. Each band was normalized using β-actin as the loading control. The shAHCY signal for each protein was expressed as the % change versus shCRTL, which was set to 100% (orange line). (B and C) Schematic diagrams of the Western blot results, for which changes in the signal for each analysed protein in AHCY-silenced cell lysates are represented as the % change versus control cells (set as 100%). Signal densitometry was performed in ImageJ software, and each band was normalized using β-actin as the loading control. Maximum change between β-actin signals for the same sample on 10 membranes exposed at the same time is +/− 11.2% and was used to verify the degree of reproducibility of the method as well as to designate all the proteins with expression changes lower than +/− 11.2% as unchanged. “p” signifies the phosphorylated form of the protein. Arrows indicate the positive impact on the downstream molecule (activation), while bars represent the negative impact on the downstream molecule (repression). The large arrow indicates the cell cycle where the cell phases are marked with G1, S, G2 and M, while horizontal bars represent cell cycle checkpoints marked red if impacted by the proposed pathways.
Figure 4
Figure 4
yH2AX spread analysis. (A) Upper panel: example of three types of cell nuclei after yH2AX immunocytochemistry regarding the number of foci (red: Alexa 594 γ-H2AX foci; blue: DAPI cell nucleus). Graph: frequency distribution of nuclei with 0 to 65 foci in increments of five (calculated from 220 nuclei per cell line; p = 0.00001 determined by two tailed t-test). Imaged with Leica SP8 X FLIM confocal microscopes (HC PL APO CS2 63 × /1.40 OIL objective). (B) Primary DNA damage in HepG2 cells estimated by the alkaline comet assay. Photomicrographs of the nuclei of HepG2 cells observed after the alkaline comet assay procedure. (a) control shCTRL cells; (b) control shCTRL cells cultivated with the addition of adenosine; (c) HepG2 cells with silenced ACHY (shAHCY), where an arrow indicates the damaged DNA that resembles comet-style features; (d) HepG2 cells with silenced ACHY (shAHCY) cultivated with the addition of adenosine. Agarose microgels were stained with ethidium bromide (20 µg/mL) and analysed under epifluorescence microscope (Olympus BX51), under 200× magnification. Photomicrographs acquired by the image analysis system Comet Assay IVTM (Perceptive Instruments Ltd., UK). (C) indicators for DNA damage were (a) tail length, (b) tail intensity, and (c) total area. For each sample, three replicates were prepared, with 100 independent comet measurements per slide, with 300 measurements performed per sample. The image analysis system ‘Comet Assay IVTM’ (Perceptive Instruments Ltd., UK), in combination with an epifluorescence microscope (Olympus BX50, Japan) equipped with appropriate filters, under 200x magnification, was used for the analysis. The results are shown as the median/mean value, and the range of the measured values (min-max); scale bar, 20 µm. Statistical significance of the data was evaluated using descriptive statistics, ANOVA with post hoc Scheffé’s test (intra-group comparisons) and the Mann-Whitney U-test (inter-group comparisons). The level of statistical significance was set at P < 0.0.05. The abbreviations above the whiskers indicate which samples differ with statistical significance. For ANOVA, the abbreviations are as follows: nc – vs. corresponding negative control; # – vs. all other samples. A sign * designates the samples that showed a statistically significant increase of the studied comet parameter compared to the related clone with regard to the addition of adenosine. shAHCY.1 – cells with silenced AHCY, replica 1; shAHCY.2 – cells with silenced AHCY, replica 2., Positive control – shCTRL cells exposed ex vivo to 50 µM hydrogen peroxide for 10 minutes on ice. For each sample, three replicate slides were prepared.
Figure 5
Figure 5
Functional analysis of the omics data performed by IPA software. For both the SILAC and RNA-Seq data, candidates that were imported into the IPA software occurred in all replicates and showed significant up- or down-regulation in AHCY silenced cells compared to the controls. (A) The upper section is a rough overview to display common changes in the datasets and the most prominent molecular and cellular functions based on the significance range (p-value). (B) The lower section is a graphical representation of the functional categories selected based on the categories that are of the highest relevance to cancer signalling, control of the cell cycle and DNA damage. The p-value is calculated using the right-tailed Fisher’s exact test and was set to less than 0.05 for the upper panel to indicate a statistically significant, non-random association but lowered to 0.00 for graphical representation to evaluate pathways probably associated with the data based on the portion/percentage of the up- and down-regulated or not present molecules involved in the pathway and represented on the bar in red, green or white colour. For each bar, the number of identified up- or down-regulated molecules is shown.
Figure 6
Figure 6
The proposed model that connects AHCY activity, DNA damage and the regulation of the cell cycle through adenosine levels in hepatocellular carcinoma cells. Left: General schematic representation of proposed model: lowered AHCY activity causes adenosine depletion, stalling of replication forks and subsequent DNA damage, which activates various signalling pathways and causes cell cycle arrest in the G1/S checkpoint. Strong and sudden lowering of the AHCY activity causes immediate proliferation changes in cancer cells; however, mild inactivation of AHCY would cause chronic stress for liver cells and thus contribute to adult onset liver disease, such as hepatocellular carcinoma as observed in the latest case of AHCY deficiency. Right: A detailed overview of how adenosine depletion could cause replication fork stalling through misbalance of the dNTP pool due to lower dATP levels, and subsequent impairment of adequate rates of DNA synthesis and progression of the replication forks. Treatment with hydroxyurea, although following another pathway, facilitates a similar and well-described effect through the disturbance of the balance of the total dNTP pool.

Similar articles

Cited by

References

    1. Haba DL, Cantoni G. G.L. The enzymatic synthesis of S-adenosyl-L-homocysteine from adenosine and homocysteine. J. Biol. Chem. 1959;234:603–608. - PubMed
    1. Borchardt RT, Huber JA, Wu YS. Potential inhibitors of S-adenosylmethionine-dependent methyltransferases. 4. Further modifications of the amino acid and base portions of S-adenosyl-L-homocysteine. Journal of Medicinal Chemistry. 1976;19(9):1094–1099. doi: 10.1021/jm00231a003. - DOI - PubMed
    1. Loehrer FM, Angst CP, Brunner FP, Haefeli WE, Fowler B. Evidence for disturbed S-adenosylmethionine: S-adenosylhomocysteine ratio in patients with end-stage renal failure: a cause for disturbed methylation reactions? Nephrol Dial Transplant. 1998;13:656–661. doi: 10.1093/ndt/13.3.656. - DOI - PubMed
    1. Caudill MA, et al. Intracellular S-adenosylhomocysteine concentrations predict global DNA hypomethylation in tissues of methyl-deficient cystathionine beta-synthase heterozygous mice. The Journal of Nutrition. 2001;131(11):2811–8. doi: 10.1093/jn/131.11.2811. - DOI - PubMed
    1. Barić I, et al. S-adenosylhomocysteine hydrolase deficiency in a human: A genetic disorder of methionine metabolism. Proceedings of the National Academy of Sciences. 2004;101(12):4234–4239. doi: 10.1073/pnas.0400658101. - DOI - PMC - PubMed

Publication types

MeSH terms