. 2018 Sep 18;8(1):13995.
doi: 10.1038/s41598-018-32275-8.

The clinical importance of a cytokine network in the acute phase of sepsis

Affiliations

The clinical importance of a cytokine network in the acute phase of sepsis

Hisatake Matsumoto et al. Sci Rep. .

Abstract

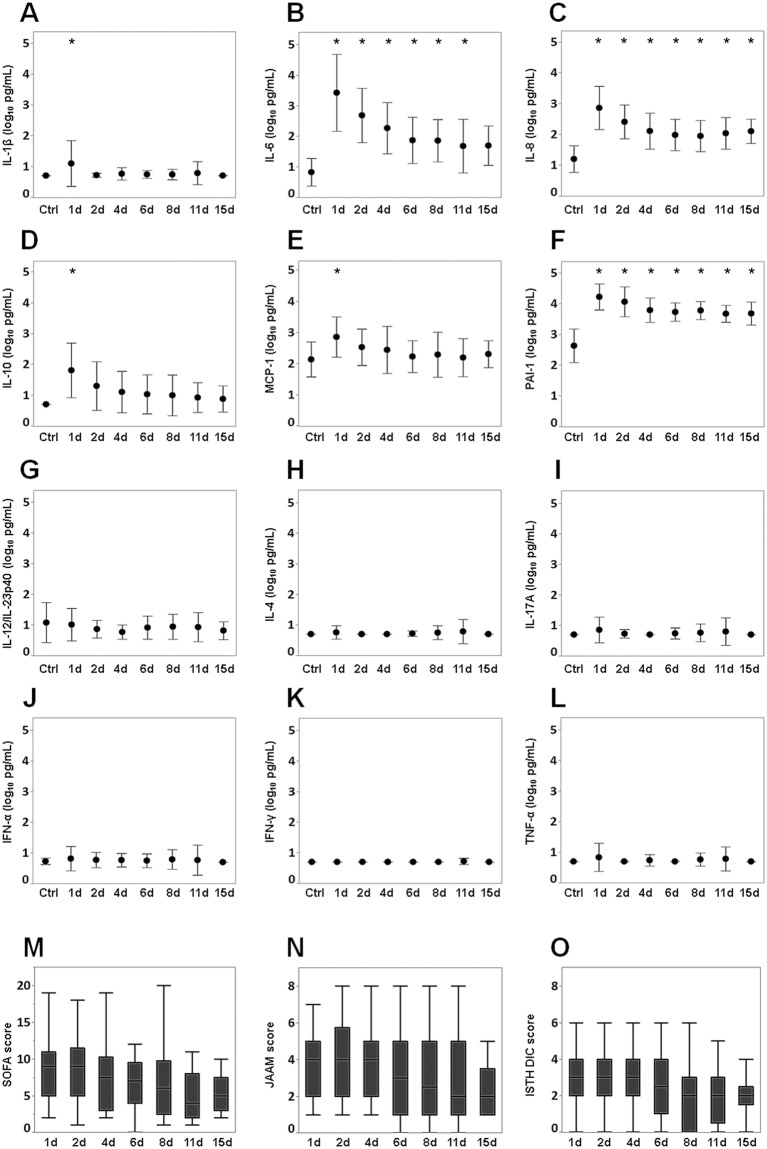
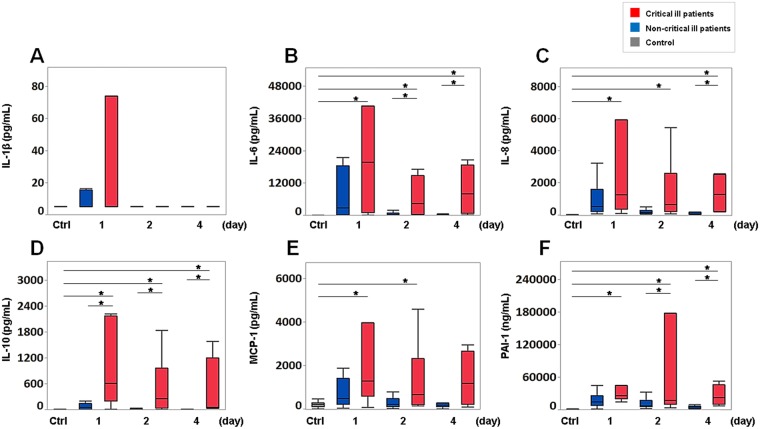
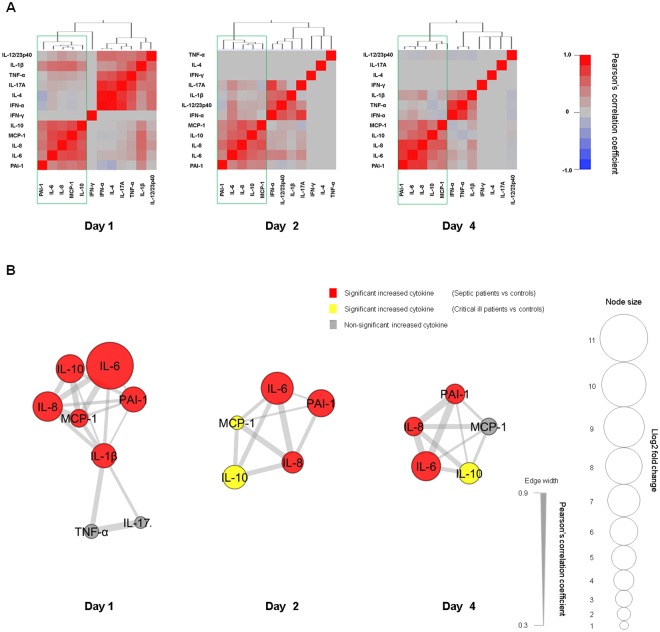
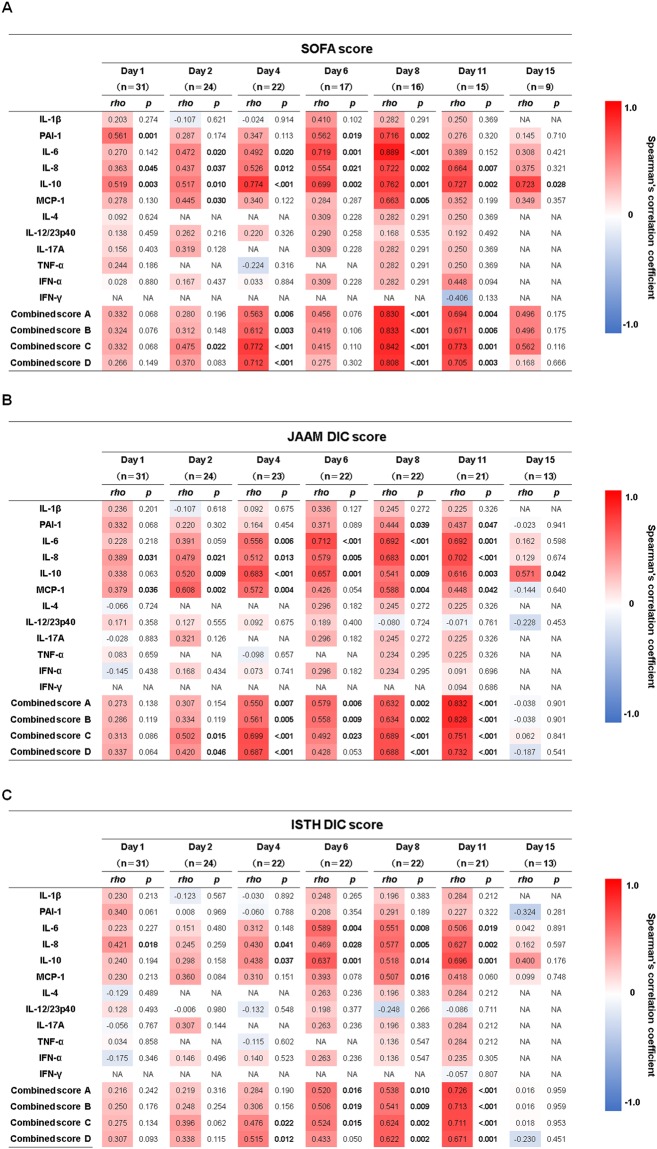
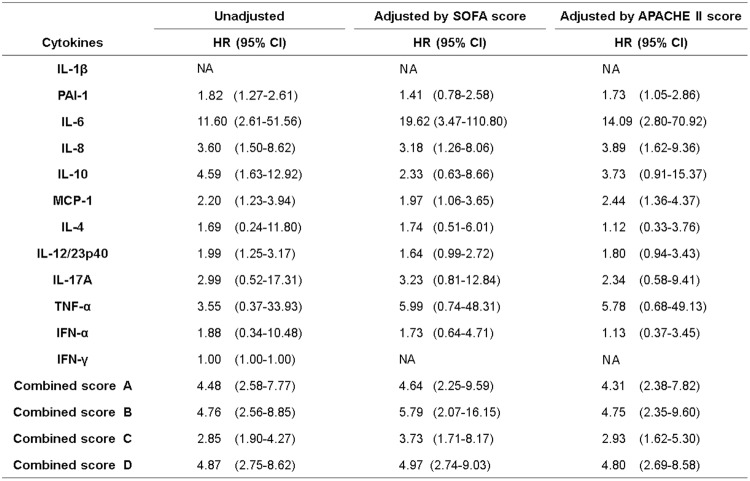
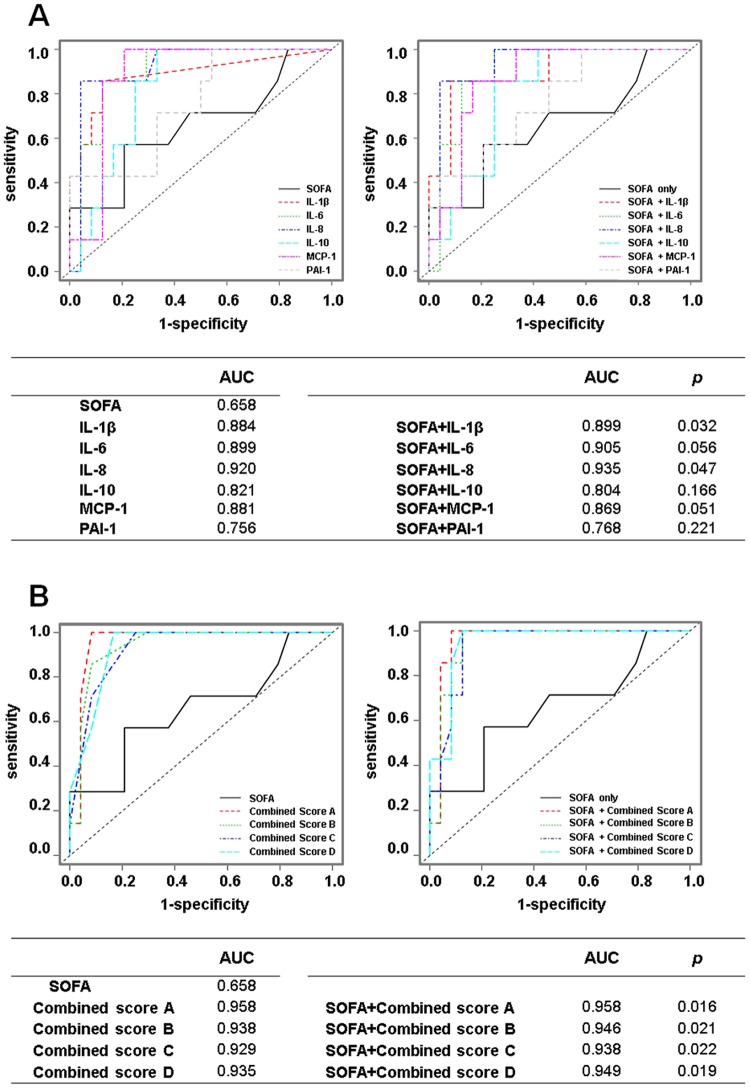
Sepsis remains a major cause of death. Cytokines interact closely with each other and play a crucial role in the progression of sepsis. We focussed on the associations of a cytokine network with prognosis and disease severities in sepsis. This retrospective study included 31 patients with sepsis and 13 healthy controls. Blood samples were collected from patients on days 1, 2, 4, 6, 8, 11 and 15 and from healthy controls. Levels of PAI-1, IFN-α, IFN-γ, IL-1β, IL-6, IL-8, IL-12/IL-23p40, IL-17A, TNF-α, MCP-1, IL-4 and IL-10 were measured. SOFA, JAAM DIC and ISTH DIC scores were evaluated at the same times blood samples were taken. Network analysis revealed a network formed by PAI-1, IL-6, IL-8, MCP-1 and IL-10 on days 1, 2 and 4 throughout the acute phase of sepsis. There were positive correlations of each cytokine and the combined score (IL-6 + IL-8 + IL-10 + MCP-1) with the SOFA, JAAM DIC and ISTH DIC scores throughout the acute phase. A Cox proportional hazards model focussed on the acute phase showed that the above combined score was significantly related with patient prognosis, suggesting that the cytokine network of IL-6, IL-8, MCP-1 and IL-10 could play a pivotal role in the acute phase of sepsis.


Conflict of interest statement

The authors declare no competing interests.

Figures

Figure 1
Figure 1
Changes in the levels of 11 cytokines and PAI-1 and in SOFA and DIC scores. (a) (A) Interleukin-1 beta (IL-1β), (B) interleukin-6 (IL-6), (C) interleukin-8 (IL-8), (D) interleukin-10 (IL-10), (E) monocyte chemotactic protein-1 (MCP-1), (F) plasminogen activator inhibitor-1 (PAI-1), (G) interleukin-12/23p40 (IL-12/IL-23p40), (H) interleukin-4 (IL-4), (I) interleukin-17A (IL-17A), (J) interferon-α (IFN-α), (K) interferon-γ (IFN-γ), and (L) tumour necrosis factor-α (TNF-α). The cytokine and PAI-1 values were transformed to common logarithm values to normalise the distribution of the data. All data are expressed as mean ± SD. Asterisks indicate a significant difference in cytokine and PAI-1 levels between control and septic patients on each day (P < 0.05). (b) Changes of (M) SOFA score, (N) JAAM score (O) and ISTH DIC score. The boxes indicate the lower and upper quartiles, the central line is the median, and the ends of the whiskers represent the maximum and minimum values. SOFA: Sequential Organ Failure Assessment; JAAM: Japanese Association for Acute Medicine; ISTH: International Society of Thrombosis and Haemostasis.
Figure 2
Figure 2
Levels of cytokines and PAI-1 in critical ill patients and non-critical ill patients. (A) Interleukin-1 beta (IL-1β), (B) interleukin-6 (IL-6), (C) interleukin-8 (IL-8), (D) interleukin-10 (IL-10), (E) monocyte chemotactic protein-1 (MCP-1), and (F) plasminogen activator inhibitor-1 (PAI-1) levels on day 1 (critically ill patients and non-critically ill patients: n = 7 and n = 24), day 2 (n = 6 and n = 18) and day 4 (n = 4 and n = 18), respectively. The boxes indicate the lower and upper quartiles, the central line is the median, and the ends of the whiskers represent the maximum and minimum values. Asterisks indicate a significant difference between critically ill patients, non-critically ill patients and controls (P < 0.05).
Figure 3
Figure 3
Hierarchical clustering and network visualisation. The cytokine and PAI-1 values were transformed to common logarithm values to normalise the distribution of the data. (A) Hierarchical clustering of Pearson’s correlations between cytokines and PAI-1. The outlined boxes show the common cytokine network in the acute phase of sepsis (days 1–4). (B) This network visualises the significant correlations of (A). The cytokines and PAI-1 with log2 fold change (i.e. average cytokine levels in sepsis patients/average cytokine levels in controls) > 1.5 were included. The size of each node was determined based on the log2 fold change. Red, yellow, and grey colours indicate a significant increase in the cytokines and PAI-1 levels between septic patients and controls, between critically ill patients and controls, and no difference between septic or critically ill patients and controls, respectively. Increased cytokines compared to those of the controls and the connections are shown to represent networks with major impact. IFN-α: interferon-α; IFN-γ: interferon-γ; IL-1β: interleukin-1 beta; IL-6: interleukin-6; IL-8: interleukin-8; IL-12/IL-23p40: interleukin-12/23p40; IL-17A: interleukin-17A; TNF-α: tumour necrosis factor-α; MCP-1: monocyte chemotactic protein-1; IL-4: interleukin-4; IL-10: interleukin-10; PAI-1: plasminogen activator inhibitor-1.
Figure 4
Figure 4
Correlations between cytokines and PAI-1 and the combined scores and disease severities in the patients with sepsis. Correlations with (A) SOFA score, (B) JAAM score and (C) ISTH score. The red colour indicates a positive correlation, and the blue colour indicates a negative correlation. The P values in bold font indicate statistical significance. The levels of the 11 cytokines and PAI-1, which were transformed to common logarithm values, and the combined scores were used for analysis. SOFA: Sequential Organ Failure Assessment; JAAM: Japanese Association for Acute Medicine; ISTH: International Society of Thrombosis and Haemostasis; PAI-1: plasminogen activator inhibitor-1; IL-1β: interleukin-1 beta; IL-6: interleukin-6; IL-8: interleukin-8; IL-10: interleukin-10; MCP-1: monocyte chemotactic protein-1; IL-4: interleukin-4; IL-12/IL-23p40: interleukin-12/23p40; IL-17A: interleukin-17A; TNF-α: tumour necrosis factor-α; IFN-α: interferon-α; IFN-γ: interferon-γ; NA: not available. Combined scores A, B, C and D: combined scores of (IL-1β, IL-6, IL-8, IL-10, MCP-1, PAI-1), (IL-6, IL-8, IL-10, MCP-1, PAI-1), (IL-6, IL-8, IL-10, MCP-1) and (IL-6, IL-8, MCP-1), respectively.
Figure 5
Figure 5
Cox proportional-hazards analysis with time-dependent covariates for survival in the patients with sepsis. The cytokine and PAI-1 values and the combined scores were measured during the acute phase (day 1, day 2 and day 4). The cytokine and PAI-1 values were transformed to common logarithm values to normalise the distribution of the data. The maximum values from day 1; those from day 2, i.e. the maximum values from day 1 or day 2; and those from day 4, i.e. the maximum values measured on day 1, day 2 or day 4, were used as time-dependent covariates. The hazard ratio is provided as Q1 to Q3. The values were adjusted by APACHE II score and SOFA score. APACHE: Acute Physiology and Chronic Health Evaluation; SOFA: Sequential Organ Failure Assessment; PAI-1: plasminogen activator inhibitor-1; IL-1β: interleukin-1 beta; IL-6: interleukin-6; IL-8: interleukin-8; IL-10: interleukin-10; MCP-1: monocyte chemotactic protein-1; IL-4: interleukin-4; IL-12/IL-23p40: interleukin-12/23p40; IL-17A: interleukin-17A; TNF-α: tumour necrosis factor-α; IFN-α: interferon-α; IFN-γ: interferon-γ; NA: not available. Combined scores A, B, C and D: combined scores of (IL-1β, IL-6, IL-8, IL-10, MCP-1, PAI-1), (IL-6, IL-8, IL-10, MCP-1, PAI-1), (IL-6, IL-8, IL-10, MCP-1) and (IL-6, IL-8, MCP-1), respectively.
Figure 6
Figure 6
ROC analysis using the cytokines and PAI-1 and the SOFA score in the patients with sepsis. The levels of the 11 cytokines and PAI-1, which were transformed to common logarithm values, and the combined scores were used for analysis. The AUC was calculated to evaluate the prognostic accuracy of each marker on day 1 (A,B). The AUC analysed by the SOFA score with each cytokine was compared to the AUC analysed by the SOFA score only. The P values indicate statistical significance. AUC: area under the ROC curve; ROC: receiver operating characteristic; SOFA: Sequential Organ Failure Assessment; IL-1β: Interleukin-1 beta; IL-6: interleukin-6; IL-8: interleukin-8; IL-10: interleukin-10; MCP-1: monocyte chemotactic protein-1; PAI-1: plasminogen activator inhibitor-1. Combined scores A, B, C and D: combined scores of (IL-1β, IL-6, IL-8, IL-10, MCP-1, PAI-1), (IL-6, IL-8, IL-10, MCP-1, PAI-1), (IL-6, IL-8, IL-10, MCP-1) and (IL-6, IL-8, MCP-1), respectively.

References

    1. Rhodes A, et al. Surviving Sepsis Campaign. International Guidelines for Management of Sepsis and Septic Shock: 2016. Crit. Care Med. 2017;45:486–552. doi: 10.1097/CCM.0000000000002255. - DOI - PubMed
    1. Levi M, van der Poll T. Coagulation and sepsis. Thromb. Res. 2017;149:38–44. doi: 10.1016/j.thromres.2016.11.007. - DOI - PubMed
    1. Amarasekara DS, Yu J, Rho J. Bone loss triggered by the cytokine network in inflammatory autoimmune diseases. J. Immunol. Res. 2015;2015:832127. doi: 10.1155/2015/832127. - DOI - PMC - PubMed
    1. Chen S-J, et al. Current status of the immunomodulation and immunomediated therapeutic strategies for multiple sclerosis. Clin. Dev. Immunol. 2012;2012:970789. - PMC - PubMed
    1. Barnes PJ. The cytokine network in chronic obstructive pulmonary disease. Am. J. Respir. Cell Mol. Biol. 2009;41:631–8. doi: 10.1165/rcmb.2009-0220TR. - DOI - PubMed