Epidemiology of viral hepatitis in Somalia: Systematic review and meta-analysis study
- PMID: 30228786
- PMCID: PMC6141335
- DOI: 10.3748/wjg.v24.i34.3927
Epidemiology of viral hepatitis in Somalia: Systematic review and meta-analysis study
Abstract
Aim: To provide a clear understanding of viral hepatitis epidemiology and their clinical burdens in Somalia.
Methods: A systematic review and meta-analysis was conducted as Preferred Reporting Items for Systematic Reviews and Meta-Analyses guidelines. A comprehensive literature search of published studies on viral hepatitis was performed from 1977-2016 in PubMed, Google Scholar, Science Direct, World Health Organization African Index Medicus and the Africa Journals Online databases, as well as on the Ministry of Health website. We also captured unpublished articles that were not available on online systems.
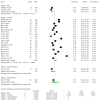
Results: Twenty-nine studies from Somalia and Somali immigrants (United Kingdom, United States, Italy, Libya) with a combined sample size for each type of viral hepatitis [hepatitis A virus (HAV): 1564, hepatitis B virus (HBV): 8756, hepatitis C virus (HCV): 6257, hepatitis D virus (HDV): 375 and hepatitis E virus (HEV): 278] were analyzed. The overall pooled prevalence rate of HAV was 90.2% (95%CI: 77.8% to 96%). The HAV prevalence among different age groups was as follows: < 1 year old, 61.54% (95%CI: 40.14% to 79.24%); 1-10 years old, 91.91% (95%CI: 87.76% to 94.73%); 11-19 years old, 96.31% (95%CI: 92.84% to 98.14%); 20-39 years old, 91.3% (95%CI: 83.07% to 95.73%); and > 40 years old, 86.96% (95%CI: 75.68% to 93.47%). The overall pooled prevalence of HBV was 18.9% (95%CI: 14% to 29%). The overall pooled prevalence among subgroups of HBV was 20.5% (95%CI: 5.1% to 55.4%) in pregnant women; 5.7% (95%CI: 2.7% to 11.5%) in children; 39.2% (95%CI: 33.4% to 45.4%) in patients with chronic liver disease, including hepatocellular carcinoma (HCC); 7.7% (95%CI: 4.2% to 13.6%), 12.4% (95%CI: 6.3% to 23.0%) and 11.8% (95%CI: 5.3% to 24.5%) in age groups < 20 years old, 20-39 years old and > 40 years old, respectively. The HBV prevalence among risk groups was 20% (95%CI: 7.19% to 44.64%) in female prostitutes, 21.28% (95%CI: 7.15% to 48.69%) in hospitalized adults, 5.56% (95%CI: 0.99% to 25.62%) in hospitalized children, 60% (95%CI: 31.66% to 82.92%) in patients with acute hepatitis, 33.55% (95%CI: 14.44% to 60.16%) in patients with ancylostomiasis, 12.34% (95%CI: 7.24% to 20.26%) in patients with leprosy and 20.19% (95%CI: 11.28% to 33.49%) in schistosomiasis patients. The overall pooled prevalence of HCV was estimated as 4.84% (95%CI: 3.02% to 7.67%). The prevalence rates among blood donors, risk groups, children and patients chronic liver disease (including HCC) was 0.87% (95%CI: 0.33% to 2.30%), 2.43% (95%CI: 1.21% to 4.8%), 1.37% (95%CI: 0.76% to 2.46%) and 29.82% (95%CI: 15.84% to 48.98%), respectively. The prevalence among genotypes of HCV was 21.9% (95%CI: 15.36% to 30.23%) in genotype 1, 0.87% (95%CI: 0.12% to 5.9%) in genotype 2, 25.21% (95%CI: 18.23% to 33.77%) in genotype 3, 46.24% (95%CI: 37.48% to 55.25%) in genotype 4, 2.52% (95%CI: 0.82% to 7.53%) in genotype 5, and 1.19% (95%CI: 0.07% to 16.38%) in genotype 6. The overall pooled prevalence of HDV was 28.99% (95%CI: 16.38% to 45.96%). The HDV prevalence rate among patients with chronic liver disease, including HCC, was 43.77% (95%CI: 35.09% to 52.84%). The overall pooled prevalence of HEV was 46.86% (95%CI: 5.31% to 93.28%).
Conclusion: Our study demonstrates a high prevalence of all forms of viral hepatitis in Somalia and it also indicates that chronic HBV was the commonest cause of chronic liver disease. This highlights needs for urgent public health interventions and strategic policy directions to controlling the burden of the disease.
Keywords: Hepatitis A virus; Hepatitis B virus; Hepatitis C virus; Hepatitis D virus; Hepatitis E virus; Meta-analysis, Somalia; Systematic review; Viral hepatitis.
Conflict of interest statement
Conflict-of-interest statement: The authors deny any conflict of interest.
Figures


References
-
- World Health Organization. Global Hepatitis Report 2017 Accessed March 16, 2018. Available from: apps.who.int/iris/bitstream/10665/255016/1/9789241565455-eng.pdf.
-
- Jacobsen KH, Wiersma ST. Hepatitis A virus seroprevalence by age and world region, 1990 and 2005. Vaccine. 2010;28:6653–6657. - PubMed
-
- Hassan-Kadle MA. The Diagnostic Challenges, Possible Etiologies and Lack of Researches of Hepatocellular Carcinoma in Somalia. Open J Gastroenterol. 2017;7:115.
-
- World Health Organization. 2018. Global policy report on the prevention and control of viral hepatitis, 2013. Accessed March 16. Available from: apps.who.int/iris/bitstream/10665/85397/1/9789241564632_eng.pdf.
Publication types
MeSH terms
LinkOut - more resources
Full Text Sources
Other Literature Sources

