. 2018 Aug 30:2018:6985698.
doi: 10.1155/2018/6985698. eCollection 2018.

Design and Simulation Study of a CNT-Based Multisource Cubical CT System for Dynamic Objects

Affiliations

Design and Simulation Study of a CNT-Based Multisource Cubical CT System for Dynamic Objects

Changcheng Gong et al. Scanning. .

Abstract

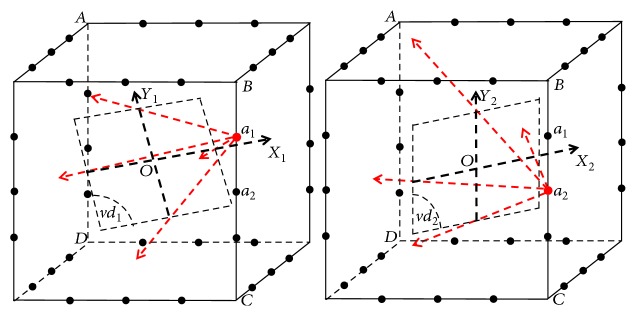
The purpose of this paper is to design and simulate a new computed tomography (CT) system with a high temporal resolution for dynamic objects. We propose a multisource cubical CT (MCCT) system with X-ray tubes and detectors installed on a cube. Carbon nanotube- (CNT-) based X-ray focal spots are distributed on the twelve edges of the cube. The distribution of X-ray focal spots and detectors completely avoids mechanical movements to scan an object under inspection. CNTs are excellent electron field emitters because the use of a "cold" cathode makes it possible to fabricate a cathode with multiple electron emission points, and the CNT-based X-ray focal spots possess little response time and programmable emission. The proposed rotation-free MCCT system can acquire a high scanning speed when using a high frame rate detector. A three-dimensional (3D) reconstruction algorithm with tensor framelet-based L0-norm (TF-L0) minimization is developed for the simulation study of the MCCT. Simulation experiment results demonstrate the feasibility of the MCCT system.


Figures

Figure 1
Figure 1
Illustration of a MCCT configuration. The illustration is cut open for display. The green components represent the detectors, the red points represent the focal spots in the CNT-based X-ray tube, and the white component is the objective table.
Figure 2
Figure 2
(a) Diagrammatic sketch of the MCCT with multiple X-ray focal spots. (b, c) The shapes of the collimated X-ray cone beam emitted from some different focal spots are different.
Figure 3
Figure 3
Graphical representation of the parameters for the MCCT.
Figure 4
Figure 4
Two typical virtual detectors (vd) and diagrams of two imaging geometries for different focal spots.
Figure 5
Figure 5
Two typical projection images for different focal spot.
Figure 6
Figure 6
(a) The original buckwheat seed image; (b and c) initial and final state, the modified buckwheat seed image with two changing spheres each of which changes smoothly in size.
Figure 7
Figure 7
CT images of the modified buckwheat seed in experiment 1: (a) SART, (b) TV, and (c) TF-L0. The second row images are the close-ups of ROIs. The places pointed out by red arrows are examples where TF-L0 acquires the best results.
Figure 8
Figure 8
CT images of the modified buckwheat seed in experiment 2: (a) SART, (b) TV, and (c) TF-L0. The second row images are the close-ups of ROIs. The places pointed out by red arrows are examples where TF-L0 acquires the best results.
Figure 9
Figure 9
CT images of the modified buckwheat seed in experiment 3: (a) SART, (b) TV, and (c) TF-L0. The second row images are the close-ups of ROIs.
Figure 10
Figure 10
Data analyses of experiments 1, 2, and 3 are performed to show the influence of the motions. Smaller average radius error represents higher image quality.
Figure 11
Figure 11
Three typical types of projection data loss: (a, b, c) the second images are the images showing the differences between the ideal projection and the interpolated projection.
Figure 12
Figure 12
CT images from SART (a, d, g), TV (b, e, h), and TF-L0 (c, f, i). Images (a), (b), and (c) are reconstructed from the ideal projections. Images (d), (e), and (f) are reconstructed from the interpolated projections. The third row images are the images showing the differences between images in the first and the second rows.
Figure 13
Figure 13
(a) The original bee image. (b, c) Initial and final state; the modified bee image with two spheres each of which changes smoothly in size.
Figure 14
Figure 14
CT images of the modified bee reconstructed from inconsistent projections: (a) the reference image; (b) SART; (c) TV; (d) TF-L0. The second row images are the close-ups of ROIs. The places pointed out by red arrows are examples where TV and TF-L0 acquire different results.
Figure 15
Figure 15
CT images of the modified bee reconstructed from consistent projections: (a) the reference image; (b) SART; (c) TV; (d) TF-L0. The second row images are the close-ups of ROIs. The places pointed out by red arrows are examples where TV and TF-L0 acquire different results.

References

    1. Badea C. T., Drangova M., Holdsworth D. W., Johnson G. A. In vivo small-animal imaging using micro-CT and digital subtraction angiography. Physics in Medicine & Biology. 2008;53(19):319–350. - PMC - PubMed
    1. Yu W., Zeng L. Iterative image reconstruction for limited-angle inverse helical cone-beam computed tomography. Scanning. 2016;38(1):13. doi: 10.1002/sca.21235. - DOI - PubMed
    1. Helvacioglu-Yigit D., Yilmaz A., Kiziltas-Sendur G., Aslan O. S., Abbott P. V. Efficacy of reciprocating and rotary systems for removing root filling material: a micro-computed tomography study. Scanning. 2014;36(6):581. doi: 10.1002/sca.21157. - DOI - PubMed
    1. Qi S., Zhang B., Teng Y., et al. Transient dynamics simulation of airflow in a CT-scanned human airway tree: more or fewer terminal bronchi? Computational and Mathematical Methods in Medicine. 2017;2017:14. doi: 10.1155/2017/1969023.1969023 - DOI - PMC - PubMed
    1. Song R., Cui M., Liu J., Ranjith P. G., Lei Y. A pore-scale simulation on thermal-hydromechanical coupling mechanism of rock. Geofluids. 2017;2017:12. doi: 10.1155/2017/7510527.7510527 - DOI

LinkOut - more resources