. 2018 Aug 15:7:1297.
doi: 10.12688/f1000research.15809.2. eCollection 2018.

Comparison of clustering tools in R for medium-sized 10x Genomics single-cell RNA-sequencing data

Affiliations

Comparison of clustering tools in R for medium-sized 10x Genomics single-cell RNA-sequencing data

Saskia Freytag et al. F1000Res. .

Abstract

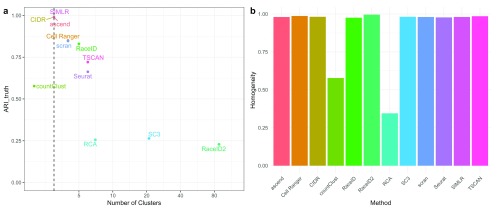
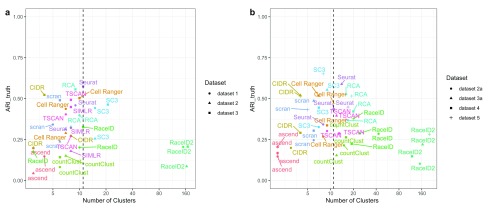
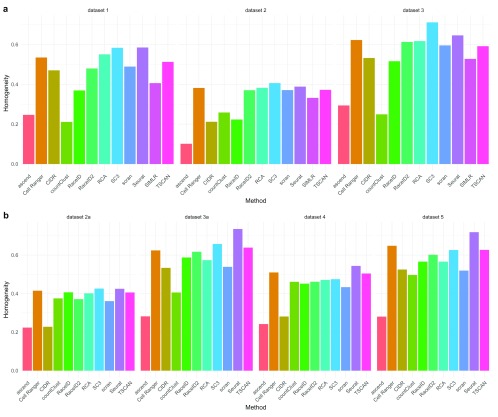
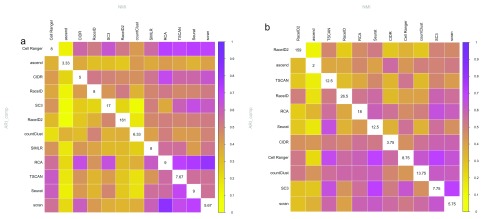
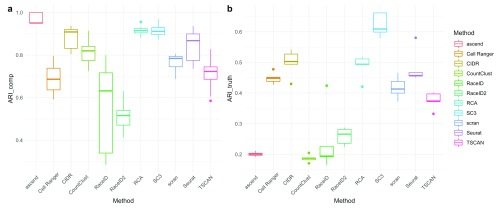
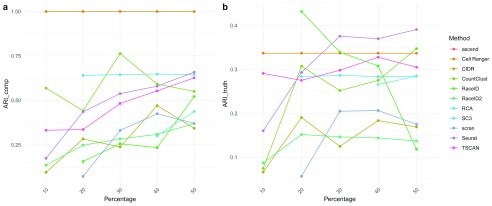
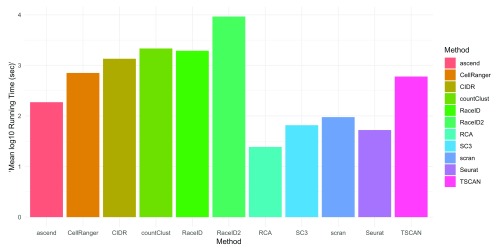
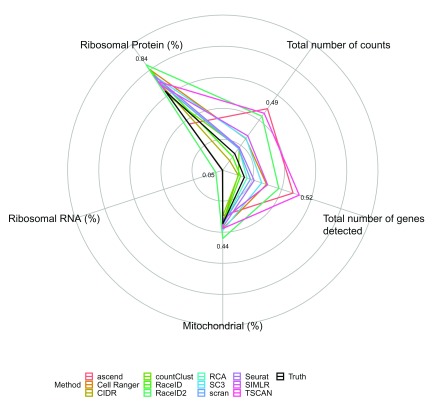
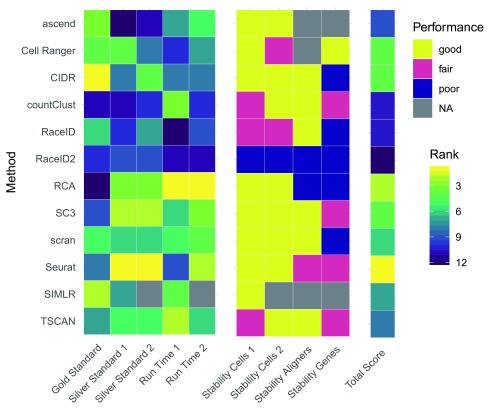
Background: The commercially available 10x Genomics protocol to generate droplet-based single cell RNA-seq (scRNA-seq) data is enjoying growing popularity among researchers. Fundamental to the analysis of such scRNA-seq data is the ability to cluster similar or same cells into non-overlapping groups. Many competing methods have been proposed for this task, but there is currently little guidance with regards to which method to use. Methods: Here we use one gold standard 10x Genomics dataset, generated from the mixture of three cell lines, as well as multiple silver standard 10x Genomics datasets generated from peripheral blood mononuclear cells to examine not only the accuracy but also running time and robustness of a dozen methods. Results: We found that Seurat outperformed other methods, although performance seems to be dependent on many factors, including the complexity of the studied system. Furthermore, we found that solutions produced by different methods have little in common with each other. Conclusions: In light of this we conclude that the choice of clustering tool crucially determines interpretation of scRNA-seq data generated by 10x Genomics. Hence practitioners and consumers should remain vigilant about the outcome of 10x Genomics scRNA-seq analysis.

Keywords: 10x Genomics; Benchmarking; Clustering; Single-Cell RNA-seq.


Conflict of interest statement

No competing interests were disclosed.

Figures

Figure 1.
Figure 1.. Performance on the gold standard dataset.
( a) ARI_truth of each method with regards to the truth versus the number of clusters. The dashed line indicates the true number of clusters. ( b) Homogeneity of clusters of each method, given the truth.
Figure 2.
Figure 2.. ARI_truth of each method in each dataset, as indicated by different shapes, with regards to the supervised cell labeling versus the number of clusters.
The dashed line indicates the number of cell populations estimated by the supervised cell labeling approach. ( a) First evaluation with methods available in R 3.4.3. ( b) Second evaluation with methods available in R 3.5.0.
Figure 3.
Figure 3.. Homogeneity of clusters with regards to the inferred cell labeling for each method and each dataset.
Different datasets are indicated by transparency. ( a) First evaluation with methods available in R 3.4.3. ( b) Second evaluation with methods available in R 3.5.0.
Figure 4.
Figure 4.
Similarity of all combinations of clustering methods as estimated by ARI_comp (lower triangle) and NMI (upper triangle) averaged over all datasets in ( a) evaluation 1 (R version 3.4.3) and ( b) evaluation 2 (R version 3.5.0). The similarity is indicated by the color; yellow indicating no similarity and purple indicating complete overlap. The diagonals give the average number of clusters estimated by each respective method. Note that methods are ordered according to similarity.
Figure 5.
Figure 5.
( a) Tukey boxplots of ARI_comp results from the comparison of clustering solutions of the same method when cell input was varied in Dataset 5. ( b) Tukey boxplots of ARI_truth of clustering solutions of the same method when cell input was varied in Dataset 5. Results shown are for evaluation 2 (R version 3.5.0) for results of evaluation 1 (R version 3.4.3) see Supplementary Figure 4.
Figure 6.
Figure 6.
( a) ARI_comp of clustering solutions on Dataset 4 using 10%, 20%, 30%, 40% and 50% of the most expressed genes with respect to clustering Dataset 4 with all genes with the same method. ( b) ARI_truth of clustering solutions on Dataset 4 using 10%, 20%, 30%, 40% and 50% of the most expressed genes. Note that many methods could not cluster the data when few genes were available. In particular, ascend did not run.
Figure 7.
Figure 7.. The bars indicate the average log10 run time (in seconds) of all 11 methods on Dataset 5 with 3,000 genes over 5 iterations.
Figure 8.
Figure 8.. Radial plots describing the average effect of 5 cell features on the clustering solutions of different methods across the three silver standard datasets in evaluation 1 (R version 3.4.3).
For every method and every feature the adjusted R 2 of the linear model fitting the feature by the clustering solution is presented.
Figure 9.
Figure 9.. Summary of the performance of each method across all evaluations.
Note that 1 refers to evaluation 1 (R version 3.4.3) and 2 refers to evaluation 2 (R version 3.5.0).

References

    1. Tanay A, Regev A: Scaling single-cell genomics from phenomenology to mechanism. Nature. 2017;541(7637):331–338. 10.1038/nature21350 - DOI - PMC - PubMed
    1. Zappia L, Phipson B, Oshlack A: Exploring the single-cell RNA-seq analysis landscape with the scRNA-tools database. PLoS Comput Biol. 2018;14(6):e1006245. 10.1371/journal.pcbi.1006245 - DOI - PMC - PubMed
    1. Ziegenhain C, Vieth B, Parekh S, et al. : Comparative Analysis of Single-Cell RNA Sequencing Methods. Mol Cell. 2017;65(4):631–643.e4. 10.1016/j.molcel.2017.01.023 - DOI - PubMed
    1. Haque A, Engel J, Teichmann SA, et al. : A practical guide to single-cell RNA-sequencing for biomedical research and clinical applications. Genome Med. 2017;9(1):75. 10.1186/s13073-017-0467-4 - DOI - PMC - PubMed
    1. Zheng GX, Terry JM, Belgrader P, et al. : Massively parallel digital transcriptional profiling of single cells. Nat Commun. 2017;8:14049. 10.1038/ncomms14049 - DOI - PMC - PubMed

Publication types