. 2018 Jul 30;7(9):e1479627.
doi: 10.1080/2162402X.2018.1479627. eCollection 2018.

Clinically-Relevant Rapamycin Treatment Regimens Enhance CD8+ Effector Memory T Cell Function In The Skin and Allow their Infiltration into Cutaneous Squamous Cell Carcinoma

Affiliations

Clinically-Relevant Rapamycin Treatment Regimens Enhance CD8+ Effector Memory T Cell Function In The Skin and Allow their Infiltration into Cutaneous Squamous Cell Carcinoma

Ji-Won Jung et al. Oncoimmunology. .

Abstract

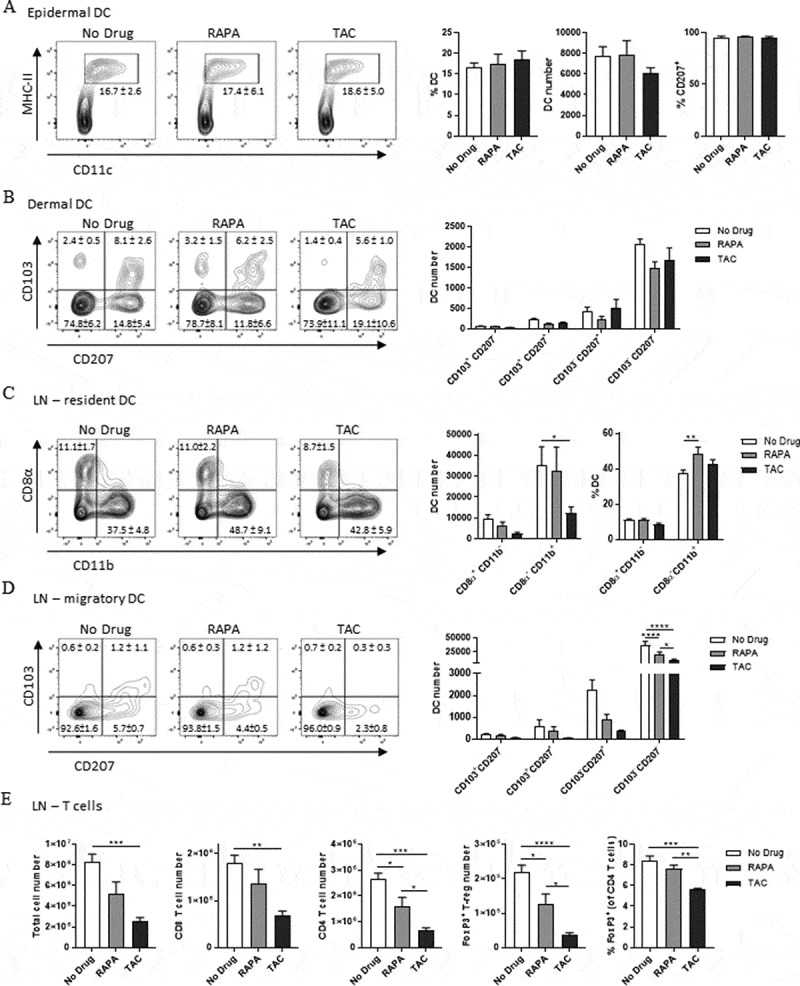
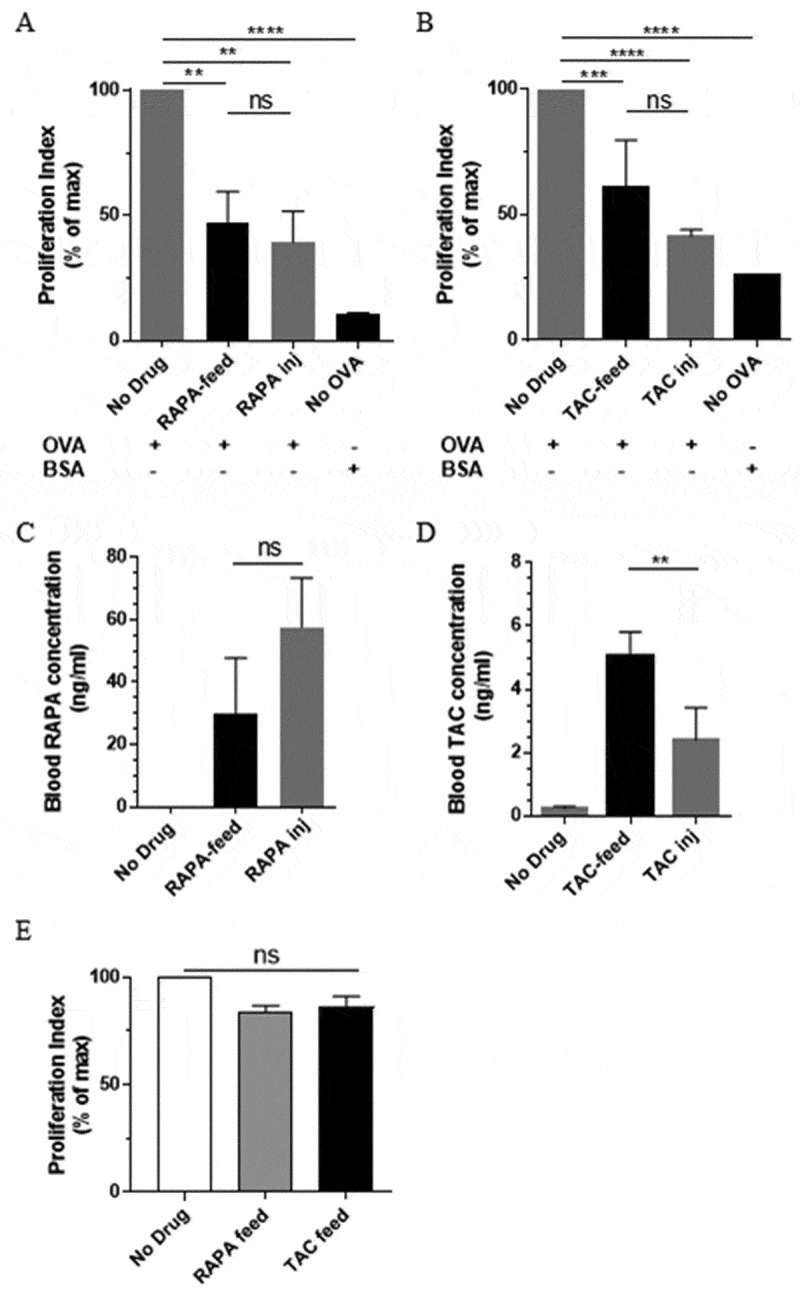
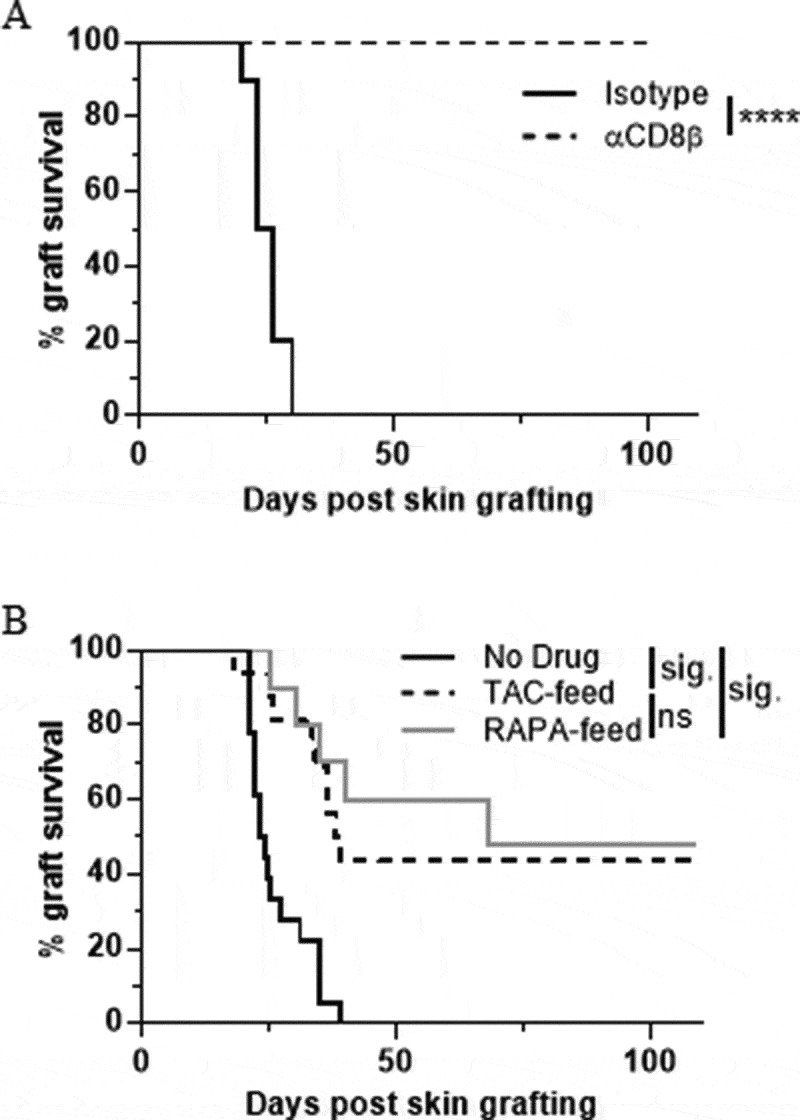
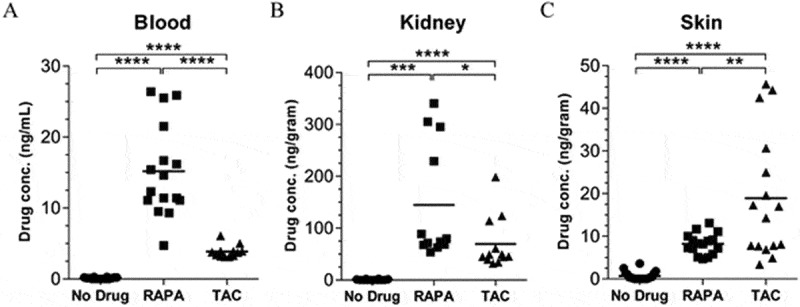
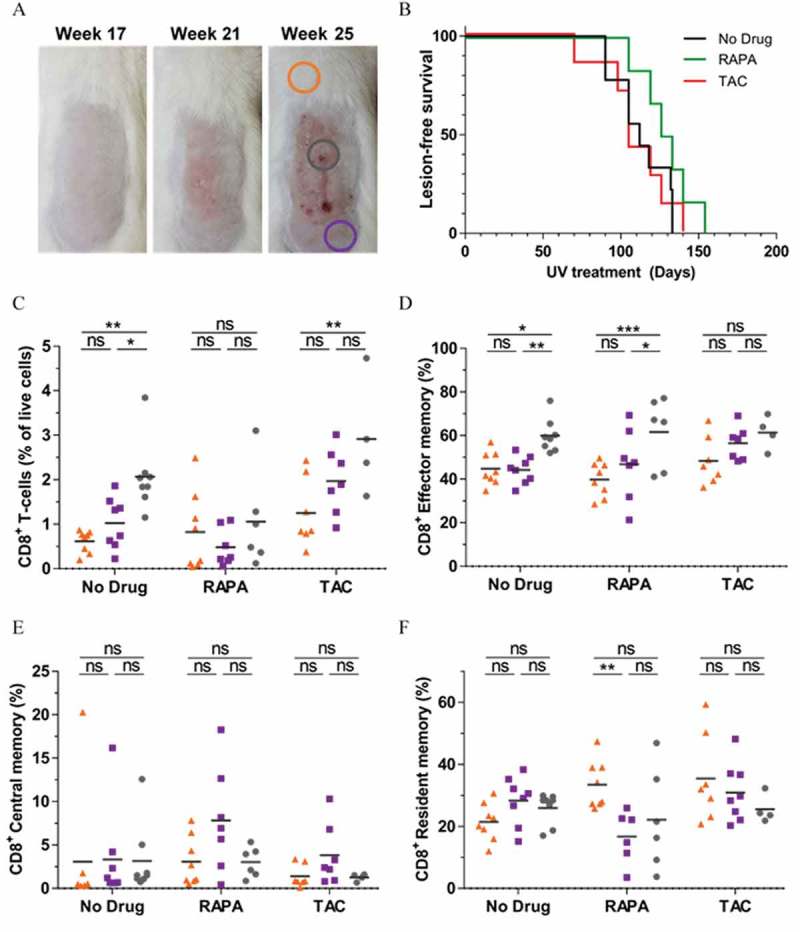
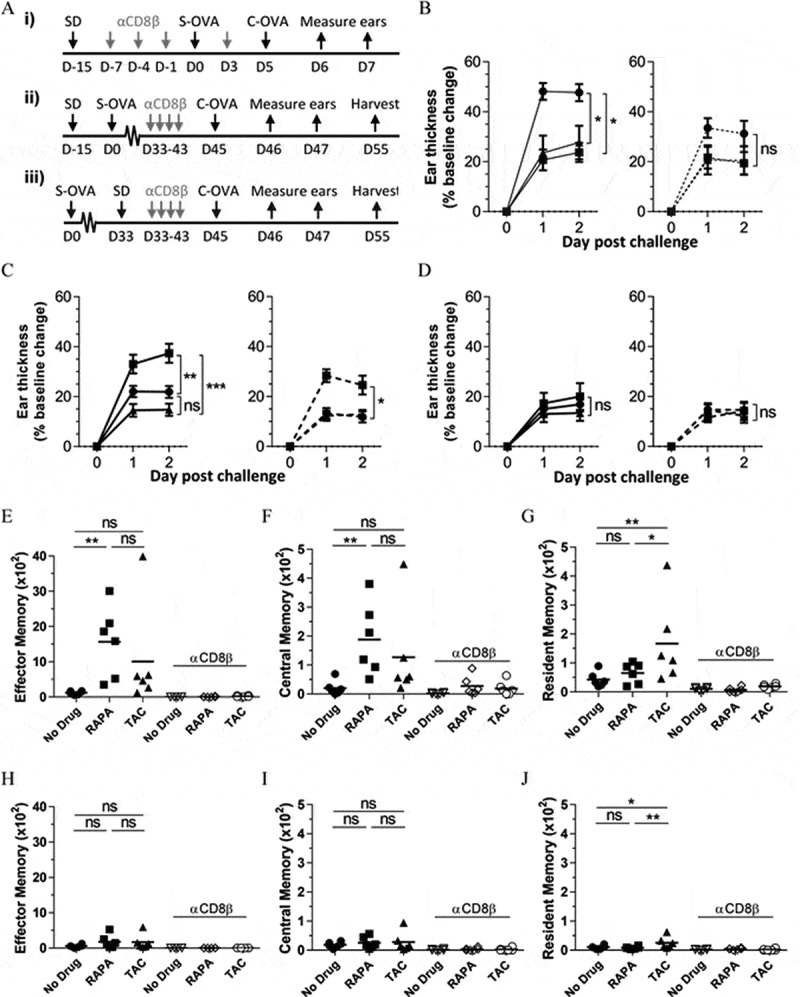
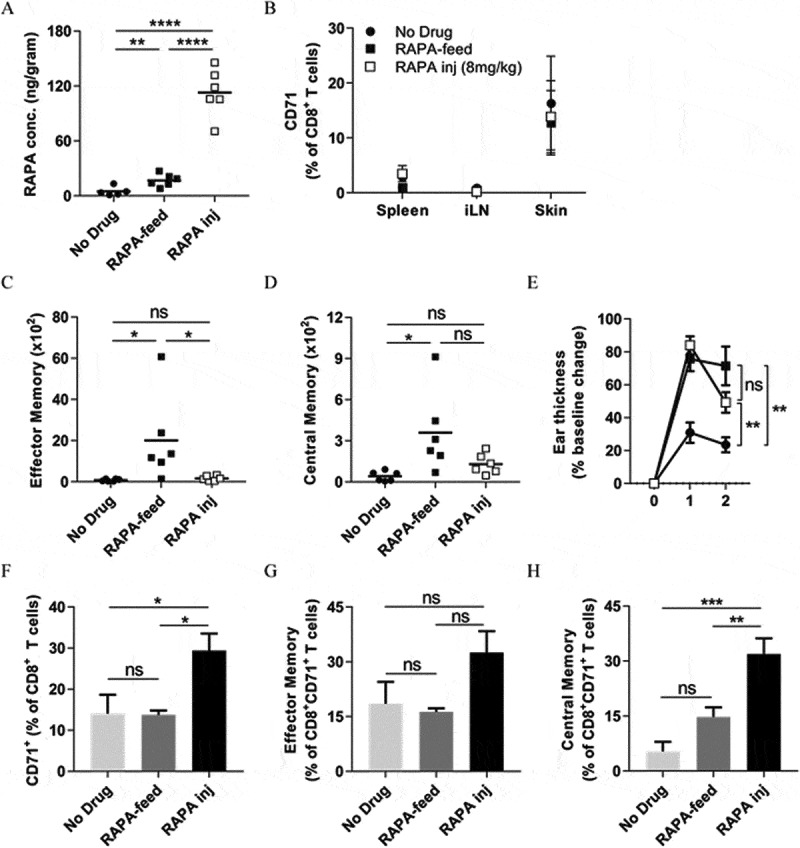
Patients receiving immunosuppressive drugs to prevent organ transplant rejection exhibit a greatly increased risk of developing cutaneous squamous cell carcinoma (SCC). However, not all immunosuppressive drugs confer the same risk. Randomised, controlled trials demonstrate that switching renal transplant recipients receiving calcineurin inhibitor-based therapies to mammalian target of rapamycin (mTOR) inhibitors results in a reduced incidence of de novo SSC formation, and can even result in the regression of pre-existing premalignant lesions. However, the contribution played by residual immune function in this setting is unclear. We examined the hypotheses that mTOR inhibitors promote the enhanced differentiation and function of CD8+ memory T cells in the skin. Here, we demonstrate that the long-term oral administration of rapamycin to achieve clinically-relevant whole blood drug target thresholds, creates a "low rapamycin dose" environment in the skin. While both rapamycin and the calcineurin inhibitor tacrolimus elongated the survival of OVA-expressing skin grafts, and inhibited short-term antigen-specific CD8+ T cell responses, rapamycin but not tacrolimus permitted the statistically significant infiltration of CD8+ effector memory T cells into UV-induced SCC lesions. Furthermore, rapamycin uniquely enhanced the number and function of CD8+ effector and central memory T cells in a model of long-term contact hypersensitivity provided that rapamycin was present during the antigen sensitization phase. Thus, our findings suggest that patients switched to mTOR inhibitor regimens likely experience enhanced CD8+ memory T cell function to new antigen-challenges in their skin, which could contribute to their lower risk of de novo SSC formation and regression of pre-existing premalignant lesions.

Keywords: T cells; memory; skin; transplantation.


Figures

Figure 1.
Figure 1.
Clinically relevant doses of rapamycin do not impact DC numbers in the skin nor CD8+ T cell numbers in skin draining lymph nodes. (A-B) FACS analysis of DC in the epidermis (A) and dermis (B) of enzymatically digested ear skin from naïve mice (No Drug), or mice fed rapamycin-diet (RAPA) or tacrolimus-diet (TAC) for 22 days. Populations in plots are gated on Live CD45+ cells (A) and Live CD45+MHC II+CD11c+ cells (B). Numbers and percentages in bar graphs indicate mean absolute counts within analysed tissues or percentage of cells in the respective gate or quadrant ± SEM. (C-E) FACS analysis of DC (C-D) or Total/T cells (E) in pooled inguinal lymph node pairs from the same mice as A-B. Populations in plots are gated on Live MHC II+CD11c+ cells (C), Live MHC II+CD11c+CD8αCD11b cells (D), and Live TCRβ+ cells ± CD8α, CD4, and/or FoxP3 (E). Numbers and percentages in bar graphs indicate mean absolute counts within paired inguinal lymph nodes or percentage of cells in the respective gate or quadrant ± SEM. Data were combined from 2 independent experiments with similar results. n = 6 mice/group. (A, B, and E) One-way ANOVA with post-hoc Tukey’s multiple comparisons test. (C-D) Two-way ANOVA with post-hoc Tukey’s multiple comparisons test.
Figure 2.
Figure 2.
Drug diets lead to suppression of CD8+ T cell proliferation in skin-draining lymph nodes. CFSE-labelled CD45.1+ OT-I CD8+ T cells were adoptively transferred into C57BL/6 recipients pre-treated with either drug diet or daily drug injection. Treatments were maintained for the duration of the experiment. Inguinal lymph nodes were harvested 72 hours following the injection of OVA or BSA control protein into the skin, and assessed for CD45.1+ CD8+ T cell proliferation. (A) Rapamycin diet vs. daily injection. (B) Tacrolimus diet vs. daily injection. (C) and (D) Respective comparison of rapamycin and tacrolimus concentrations in the blood the day prior to T cell transfer. Graphs show a representative experiment from 3 independent experiments with similar results; Mean ± SEM from 3–4 mice. RAPA-inj; Rapamycin injection (2mg/kg). TAC-inj; Tacrolimus injection (10mg/kg). (E) Assessment of the effects of drug diets on TCRVα2+ OT-II CD4+ T cell proliferation in the inguinal lymph nodes. One experiment, n = 6/group. (A-E) One-way ANOVA with post-hoc Tukey’s multiple comparisons test. ns; not significant; OVA: Ovalbumin; BSA: Bovine Serum Albumin.
Figure 3.
Figure 3.
Suppression of CD8+ T cell-mediated skin graft rejection. (A) Rejection of K5mOVA-expressing skin grafts is prevented in mice depleted of CD8 T cells. Data shown are combined from 3 independent experiments (n = 8–10). Log-rank (Mantel-Cox) test p value = p < 0.0001. (B) K5mOVA ear skin graft rejection in C57BL/6 recipient mice pre-treated with rapamycin- or tacrolimus diet for 7–14 days prior to surgery. Treatments were maintained for the duration of the experiment, and skin graft survival monitored. Data shown are combined from 6 independent experiments (n = 10–18). Log-rank (Mantel-Cox) test p value = p < 0.0001. Results then displayed as significant (sig.) or not significant (ns) after Bonferroni-corrected multiple comparison test. Bonferroni-corrected threshold = 0.016, K = 3.
Figure 4.
Figure 4.
Rapamycin concentration in the skin is low compared to the kidney following the establishment of clinically-relevant blood concentration profiles. C57BL/6 mice were fed with control, rapamycin- or tacrolimus diet for 20 days before harvest of (A) Blood, (B) Kidney, and (C) Skin. Samples were then assayed for drug concentration by LC-MS/MS. Low level drug concentrations seen in the skin of normal diet controls can be attributed to background measurements observed during the HPLC elution process as a consequence of high levels of matrix contaminants. Data shown are combined from 4 independent experiments, n = 12–20, bars represent mean. (A-C) One-way ANOVA with post-hoc Tukey’s multiple comparisons test. RAPA; Rapamycin diet. TAC; Tacrolimus diet. One data point/animal.
Figure 5.
Figure 5.
Rapamycin does not prevent the infiltration of effector memory CD8+ T cells into AK/SCC lesions. (A) 20+ weeks of UV treatment induces AK/SCC lesion formation in HPV38 E6E7 mice. Colored circles indicate sites of tissue harvest analyzed in (C-F). (B) Rate of AK/SCC lesion formation in mice treated with rapamycin or tacrolimus for the duration UV treatment. (C) CD45+CD8β+ Total, (D) CD45+CD8β+CD69CD103CD44+CD62L Effector Memory, (E) CD45+CD8β+CD69CD103CD44+CD62L+ Central Memory, and (F) CD45+CD8β+CD69+CD103+ Resident Memory CD8+ T cell abundance in fur-covered (UV-protected) normal skin (orange triangles), UV-exposed non-lesional skin (purple squares) and lesional skin (AK/SCC, grey circles) as indicated in (A). (B) Data pooled from 3 independent experiments, n = 6–10, differences not significant (Log-rank (Mantel-Cox) test p value = p = 0.1770). (C-F) Data pooled from 3 independent experiments, n = 4–9, two-way ANOVA with post-hoc Tukey’s multiple comparisons test. One data point/animal.
Figure 6.
Figure 6.
A clinically-relevant rapamycin dose promotes memory CD8+ T -cell differentiation and function in response to new antigen-challenges in the skin. (A) Experimental timelines: i) Short-term CHS setup as in B; ii) Memory recall CHS – drugs before sensitisation as in C, E, F, and G; Memory recall CHS – drugs after sensitisation as in D, H, I, and J. (B) Short-term CHS response, (C) Memory CHS response where drug diets are administered 15 days before OVA-sensitisation, and (D) Memory CHS response where drug diets are administered 33 days after OVA-sensitisation. (left panel) Change in ear thickness in OVA-sensitised mice in response to i.d. OVA challenge into the ear skin. (right panel) Effects of systemic CD8+ T cell depletion prior to antigen challenge. (B-D) ●; No drug. ■; Rapamycin. ▲; Tacrolimus. Dashed line in right-hand panels = CD8β depletion. One-way ANOVA with post-hoc Tukey’s multiple comparisons test on Day 2 shown. (B) Data are combined from 2 independent experiments, n = 6. (C) and (D) Data are combined from 2 independent experiments, n = 8, mean ± SEM shown. (E), (F), and (G) Absolute counts of CD45+TCRβ+CD8α+CD69CD103CD44+CD62L effector memory, CD45+TCRβ+CD8α+CD69CD103CD44+CD62L+ central memory, and CD45+TCRβ+CD8α+CD69+CD103+ resident memory CD8+ T cells respectively in the ears of mice on Day 55 as in (C). (H), (I), and (J) Absolute counts of effector memory, central memory, and resident memory CD8+ T cells respectively in the ears of mice on Day 55 as in (D). (E-J) CD8β-depletion groups (open symbols) indicated on graph. (E-G) and (H-J) Data represent one independent experiment from 3 independent experiments with similar results, n = 6, one data point/animal. One-way ANOVA with post-hoc Tukey’s multiple comparisons test. ns; not significant. SD: Start Drugs; S-OVA: Sensitisation with OVA; C-OVA: Challenge with OVA; D: Day. Once initiated, mice remained on drug diets for the duration of these experiments.
Figure 7.
Figure 7.
A high rapamycin dose does not promote memory CD8+ T -cell differentiation but does enhance long-term CHS responses to OVA. (A-B) C57BL/6 mice were fed with control or rapamycin diet, or injected daily with high dose (8mg/kg) rapamycin for 10 days before tissue harvest. (A) Rapamycin concentration in the skin measured by LC-MS/MS. (B) CD71 surface expression on CD8+ T-cells in the spleen, inguinal lymph nodes (iLN), and skin was analysed by FACS. Differences not significant (two-way ANOVA with Dunnett’s multiple comparisons test). (C-H) Memory recall CHS – rapamycin before sensitisation as in Fig. 6Aii. C57BL/6 mice were fed with control or rapamycin diet, or injected daily with high dose (8mg/kg) rapamycin throughout the experiment. (C) Absolute counts of CD45+TCRβ+CD8α+CD69CD103CD44+CD62L effector memory, and (D) CD45+TCRβ+CD8α+CD69CD103CD44+CD62L+ central memory CD8+ T cells in the ears of mice on Day 55. (E) Memory CHS response. ●; No drug. ■; Rapamycin diet. □; Daily rapamycin injection (8mg/kg). One-way ANOVA with post-hoc Tukey’s multiple comparisons test on Day 2 shown. (F-H) CD71 surface expression on (F) total CD8+ T-cells, (G) effector memory CD8+ T-cells, and (H) central memory CD8+ T-cells in the skin on day 55. (G) and (H), markers as in (C) and (D) respectively. (A), (C), (D), (F-H) One-way ANOVA with post-hoc Tukey’s multiple comparisons test. ns; not significant. (A), (C), (D) One data point/animal. Data are derived from one experiment.

Similar articles

Cited by

References

    1. Jung JW, Overgaard NH, Burke MT, Isbel N, Frazer IH, Simpson F et al. Does the nature of residual immune function explain the differential risk of non-melanoma skin cancer development in immunosuppressed organ transplant recipients?. International Journal of Cancer. 2016;138:281–292. doi:10.1002/ijc.29450. - DOI - PubMed
    1. Burke MT, Isbel N, Barraclough KA, Jung JW, Wells JW, Staatz CE.. Genetics and nonmelanoma skin cancer in kidney transplant recipients. Pharmacogenomics. 2015;16:161–172. doi:10.2217/pgs.14.156. - DOI - PubMed
    1. Ramsay HM, Fryer AA, Hawley CM, Smith AG, Harden PN. Non-melanoma skin cancer risk in the Queensland renal transplant population. Br J Dermatol. 2002;147:950–956. doi:10.1046/j.1365-2133.2002.04976.x. - DOI - PubMed
    1. Lindelof B, Sigurgeirsson B, Gabel H, Stern RS. Incidence of skin cancer in 5356 patients following organ transplantation. Br J Dermatol. 2000;143:513–519. - PubMed
    1. McDonald S, Clayton P, Australia HK, Dialysis NZ, Registry T. 2012. Annual report - 35th Edition. Aust New Zealand Dial Transpl Registry. 2012:48–56. http://www.anzdata.org.au/v1/report_2012.html:.

Publication types

LinkOut - more resources