

Conformational exchange of aromatic side chains by 1H CPMG relaxation dispersion
- PMID: 30229369
- PMCID: PMC6209042
- DOI: 10.1007/s10858-018-0210-5
Conformational exchange of aromatic side chains by 1H CPMG relaxation dispersion
Abstract
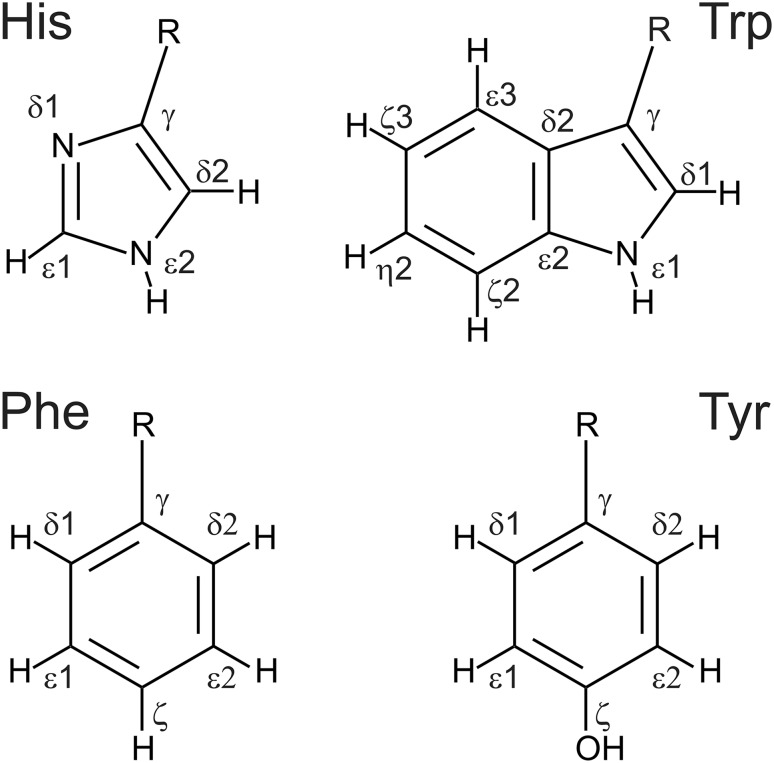
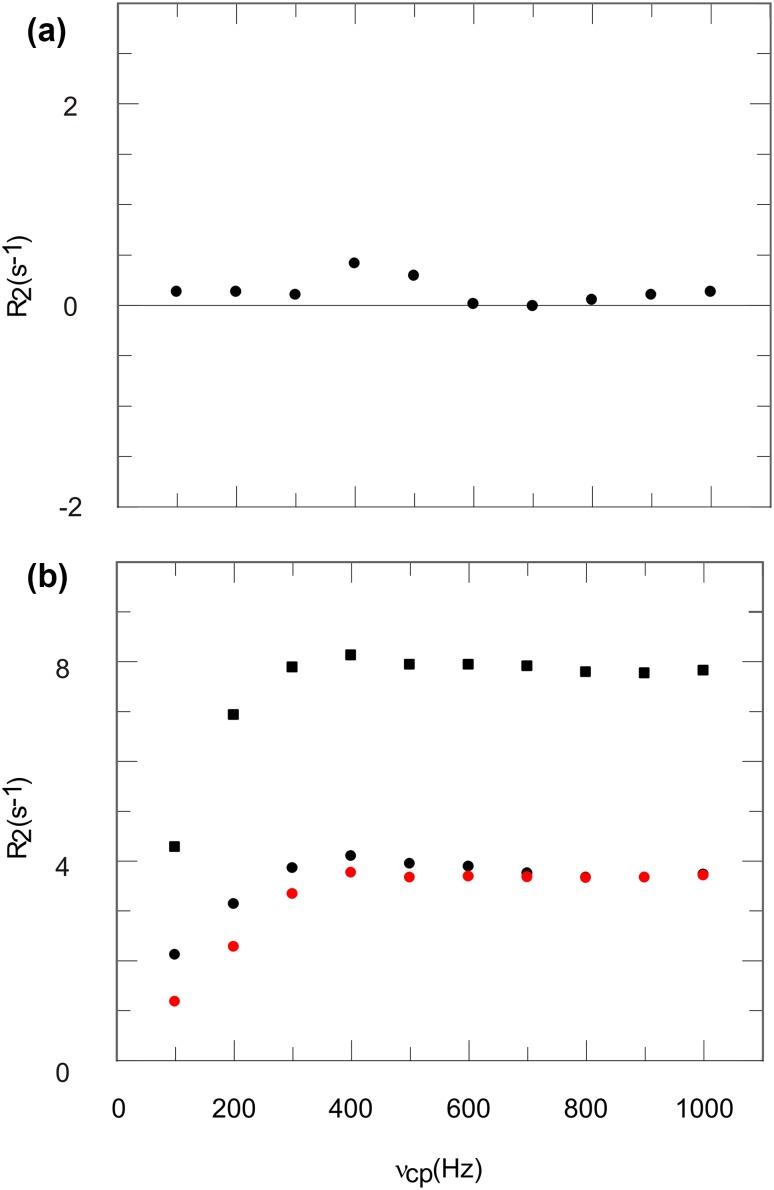
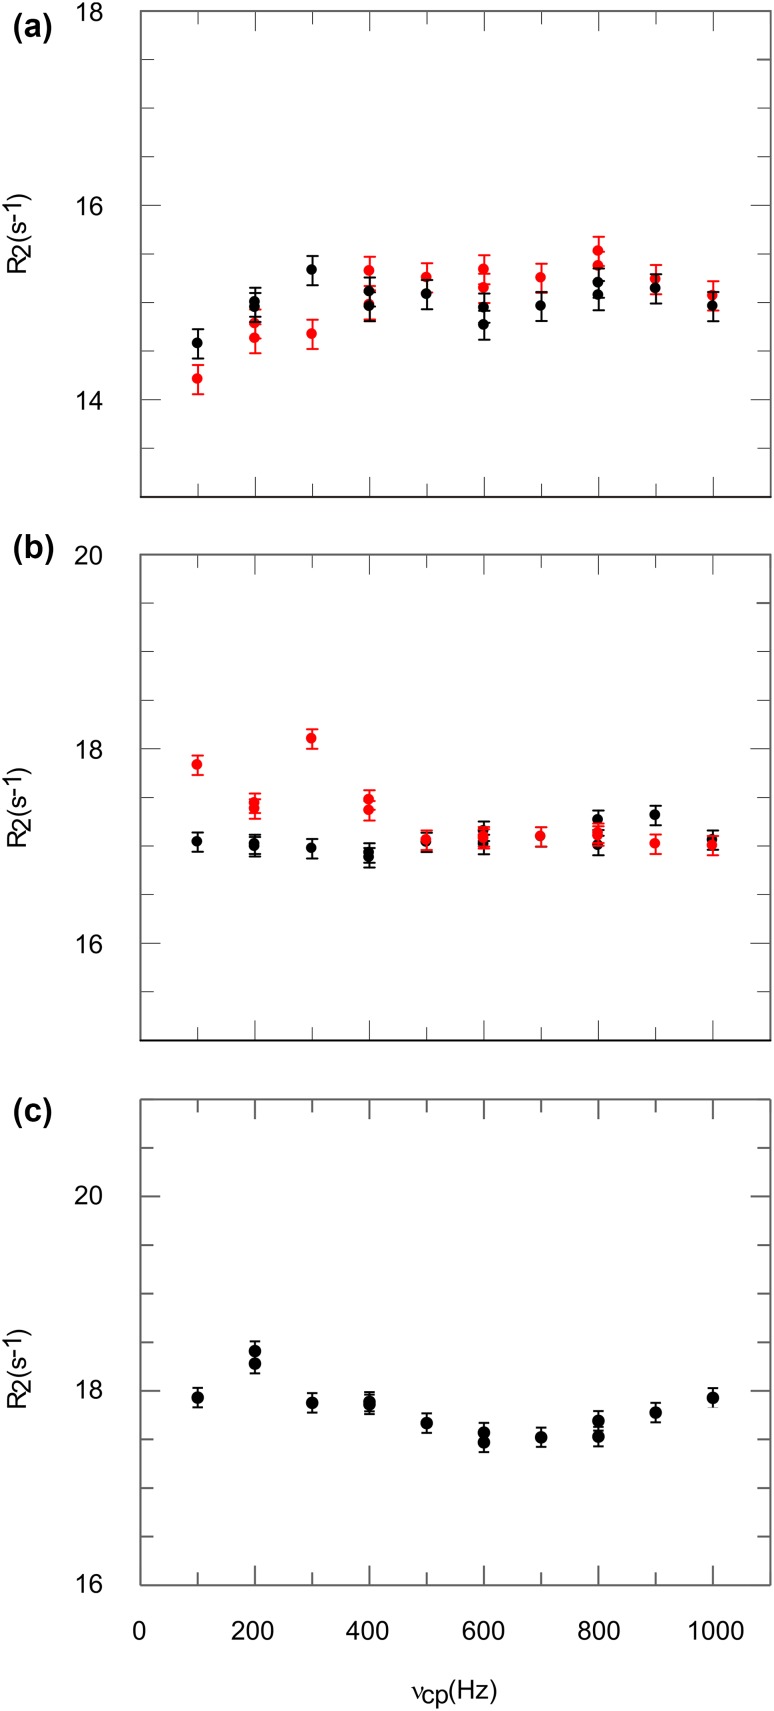
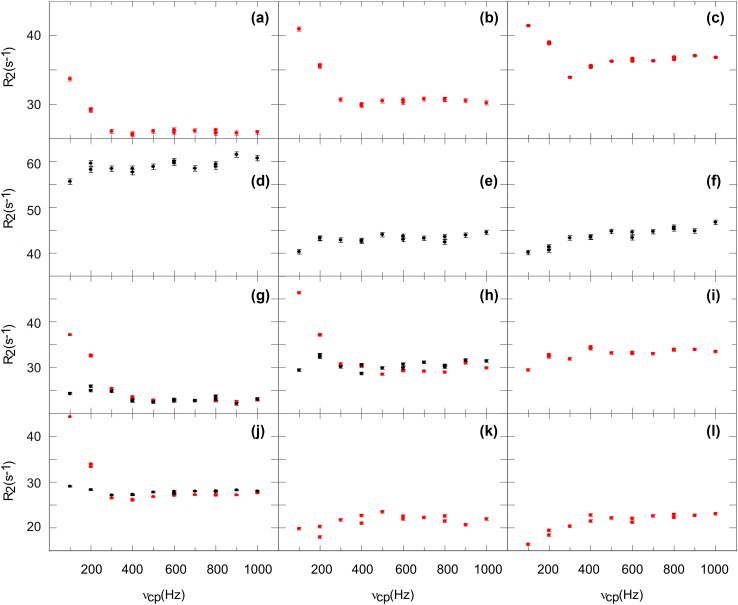
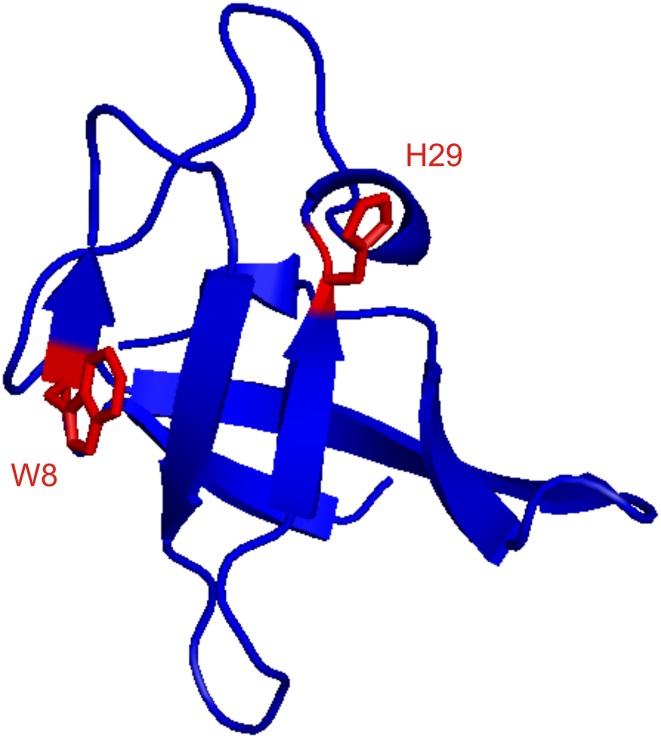
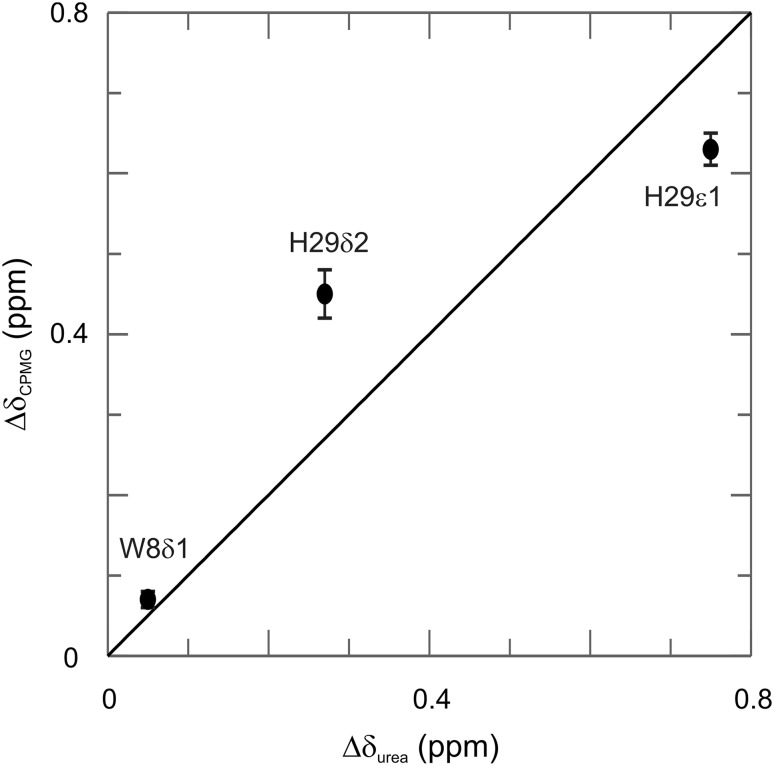
Aromatic side chains are attractive probes of protein dynamics on the millisecond time scale, because they are often key residues in enzyme active sites and protein binding sites. Further they allow to study specific processes, like histidine tautomerization and ring flips. Till now such processes have been studied by aromatic 13C CPMG relaxation dispersion experiments. Here we investigate the possibility of aromatic 1H CPMG relaxation dispersion experiments as a complementary method. Artifact-free dispersions are possible on uniformly 1H and 13C labeled samples for histidine δ2 and ε1, as well as for tryptophan δ1. The method has been validated by measuring fast folding-unfolding kinetics of the small protein CspB under native conditions. The determined rate constants and populations agree well with previous results from 13C CPMG relaxation dispersion experiments. The CPMG-derived chemical shift differences between the folded and unfolded states are in good agreement with those obtained directly from the spectra. In contrast, the 1H relaxation dispersion profiles in phenylalanine, tyrosine and the six-ring moiety of tryptophan, display anomalous behavior caused by 3J 1H-1H couplings and, if present, strong 13C-13C couplings. Therefore they require site-selective 1H/2H and, in case of strong couplings, 13C/12C labeling. In summary, aromatic 1H CPMG relaxation dispersion experiments work on certain positions (His δ2, His ε1 and Trp δ1) in uniformly labeled samples, while other positions require site-selective isotope labeling.
Keywords: Aromatic side chains; Conformational exchange; Protein dynamics; Strong couplings.
Figures


Similar articles
-
Site-selective 1H/2H labeling enables artifact-free 1H CPMG relaxation dispersion experiments in aromatic side chains.J Biomol NMR. 2019 Nov;73(10-11):633-639. doi: 10.1007/s10858-019-00275-z. Epub 2019 Sep 10. J Biomol NMR. 2019. PMID: 31506857 Free PMC article.
-
1H R1ρ relaxation dispersion experiments in aromatic side chains.J Biomol NMR. 2021 Dec;75(10-12):383-392. doi: 10.1007/s10858-021-00382-w. Epub 2021 Sep 12. J Biomol NMR. 2021. PMID: 34510298 Free PMC article.
-
Conformational exchange of aromatic side chains characterized by L-optimized TROSY-selected ¹³C CPMG relaxation dispersion.J Biomol NMR. 2012 Sep;54(1):9-14. doi: 10.1007/s10858-012-9656-z. Epub 2012 Jul 26. J Biomol NMR. 2012. PMID: 22833056 Free PMC article.
-
Probing invisible, low-populated States of protein molecules by relaxation dispersion NMR spectroscopy: an application to protein folding.Acc Chem Res. 2008 Mar;41(3):442-51. doi: 10.1021/ar700189y. Epub 2008 Feb 15. Acc Chem Res. 2008. PMID: 18275162 Review.
-
Late metabolic precursors for selective aromatic residue labeling.J Biomol NMR. 2018 Jul;71(3):129-140. doi: 10.1007/s10858-018-0188-z. Epub 2018 May 28. J Biomol NMR. 2018. PMID: 29808436 Free PMC article. Review.
Cited by
-
Proton Transfer Kinetics in Histidine Side Chains Determined by pH-Dependent Multi-Nuclear NMR Relaxation.J Am Chem Soc. 2024 Aug 14;146(32):22284-22294. doi: 10.1021/jacs.4c04647. Epub 2024 Aug 5. J Am Chem Soc. 2024. PMID: 39103163 Free PMC article.
-
Transition-State Compressibility and Activation Volume of Transient Protein Conformational Fluctuations.JACS Au. 2021 Jun 3;1(6):833-842. doi: 10.1021/jacsau.1c00062. eCollection 2021 Jun 28. JACS Au. 2021. PMID: 34467336 Free PMC article.
-
Site-selective 1H/2H labeling enables artifact-free 1H CPMG relaxation dispersion experiments in aromatic side chains.J Biomol NMR. 2019 Nov;73(10-11):633-639. doi: 10.1007/s10858-019-00275-z. Epub 2019 Sep 10. J Biomol NMR. 2019. PMID: 31506857 Free PMC article.
-
Characterizing Fast Conformational Exchange of Aromatic Rings Using Residual Dipolar Couplings: Distinguishing Jumplike Flips from Other Exchange Mechanisms.J Phys Chem B. 2022 Oct 13;126(40):7950-7956. doi: 10.1021/acs.jpcb.2c05097. Epub 2022 Sep 30. J Phys Chem B. 2022. PMID: 36180044 Free PMC article.
-
1H R1ρ relaxation dispersion experiments in aromatic side chains.J Biomol NMR. 2021 Dec;75(10-12):383-392. doi: 10.1007/s10858-021-00382-w. Epub 2021 Sep 12. J Biomol NMR. 2021. PMID: 34510298 Free PMC article.
References
MeSH terms
Substances
Grants and funding
LinkOut - more resources
Full Text Sources
Other Literature Sources
