. 2018 Nov 2;17(11):3780-3790.
doi: 10.1021/acs.jproteome.8b00455. Epub 2018 Oct 3.

1H NMR Metabolomics Identifies Underlying Inflammatory Pathology in Osteoarthritis and Rheumatoid Arthritis Synovial Joints

Affiliations

1H NMR Metabolomics Identifies Underlying Inflammatory Pathology in Osteoarthritis and Rheumatoid Arthritis Synovial Joints

James R Anderson et al. J Proteome Res. .

Abstract

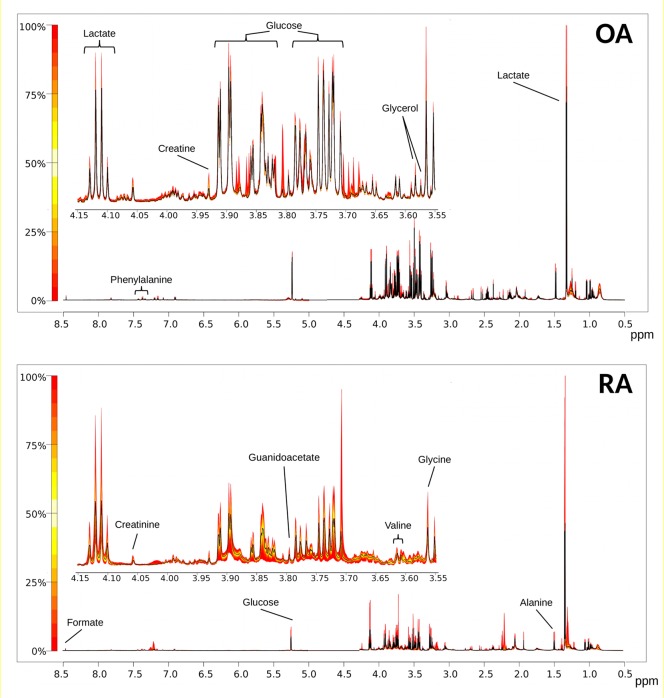
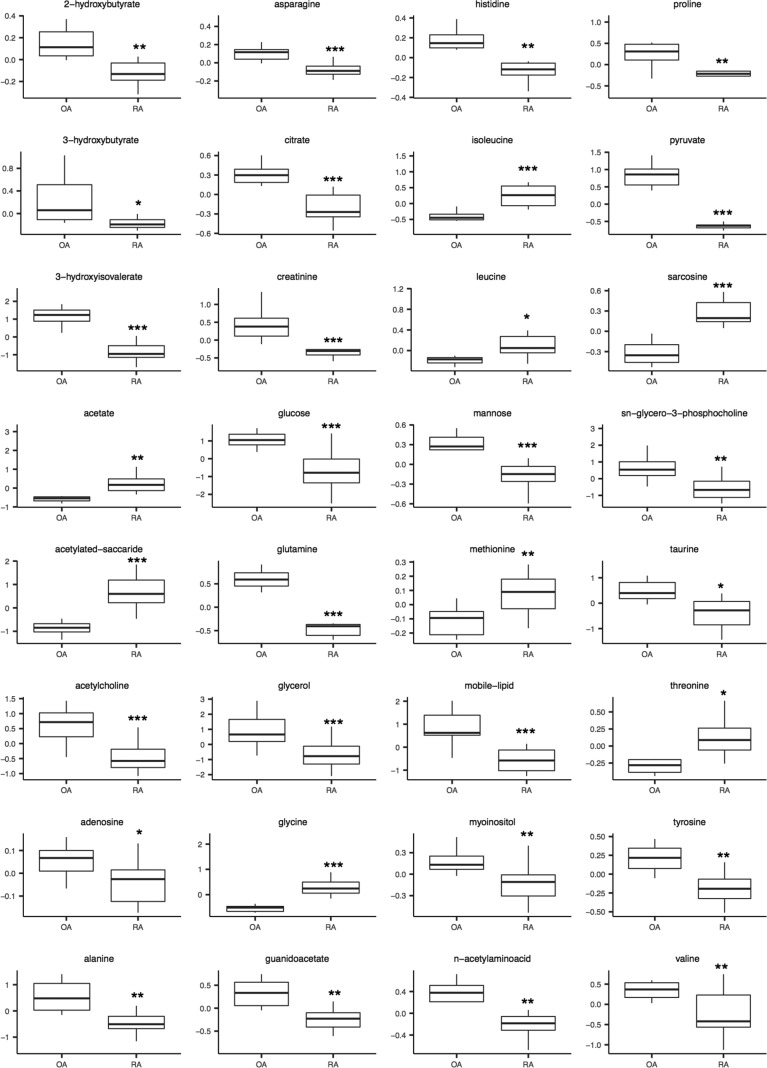
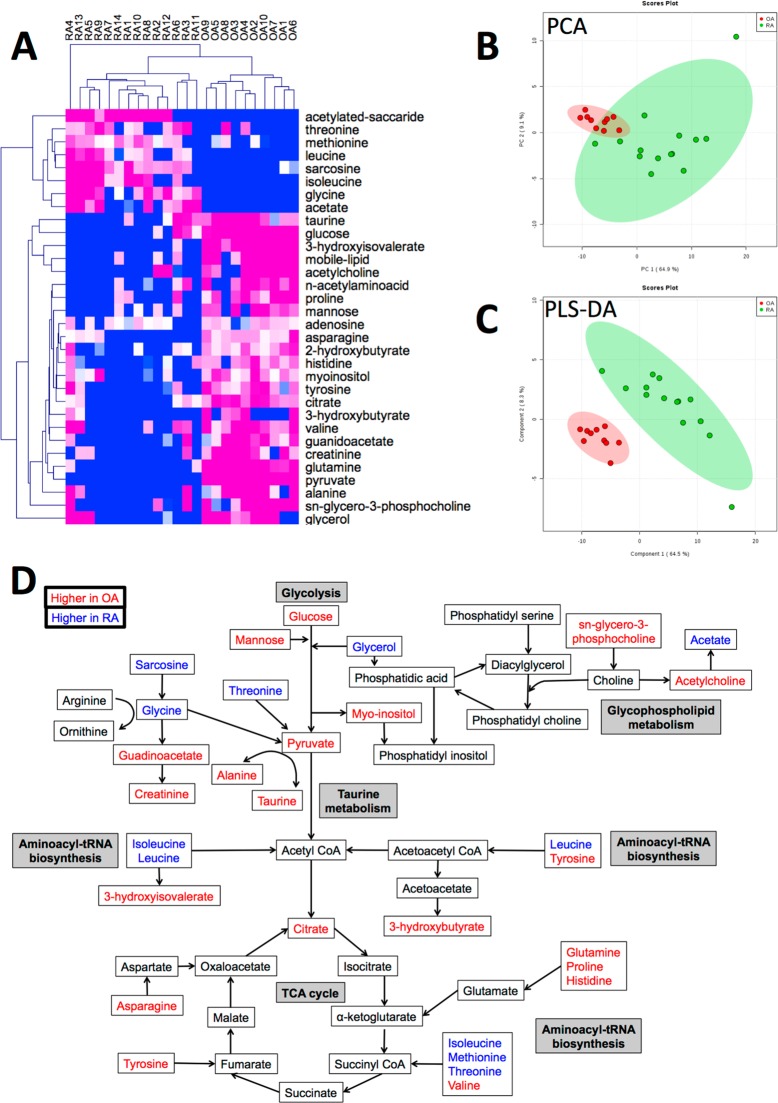
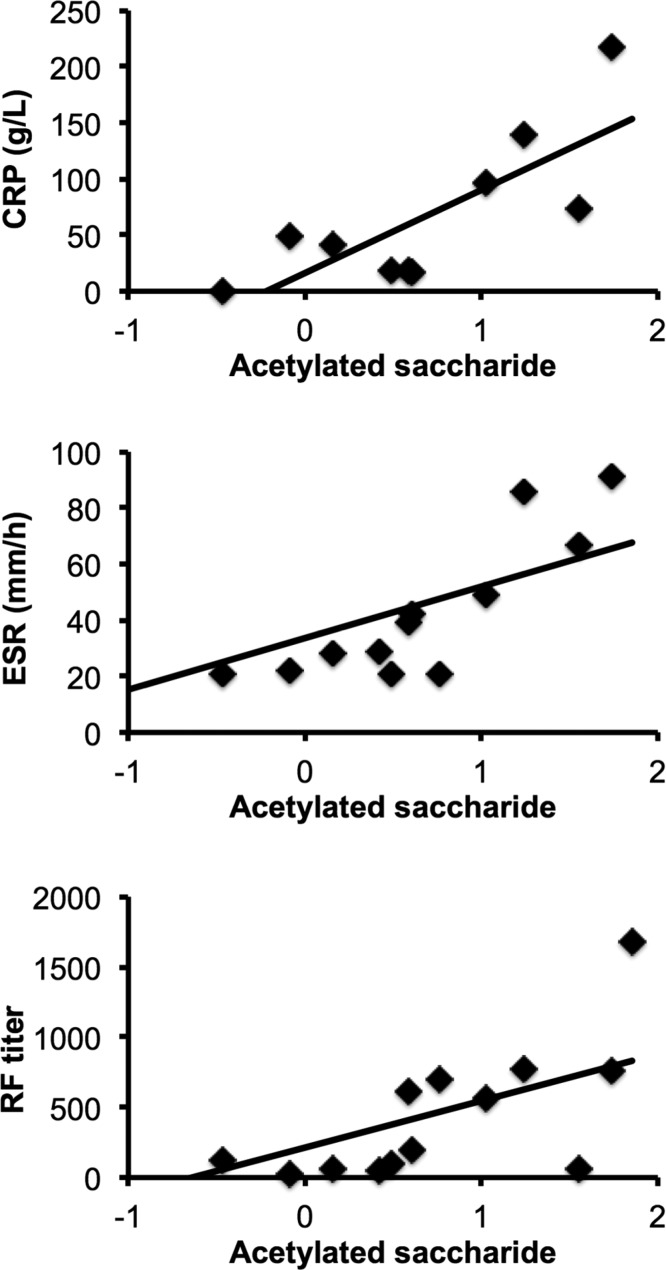
Despite osteoarthritis (OA) and rheumatoid arthritis (RA) being typically age-related, their underlying etiologies are markedly different. We used 1H nuclear magnetic resonance (NMR) spectroscopy to identify differences in metabolite profiles in low volumes of OA and RA synovial fluid (SF). SF was aspirated from knee joints of 10 OA and 14 RA patients. 100 μL SF was analyzed using a 700 MHz Avance IIIHD Bruker NMR spectrometer with a TCI cryoprobe. Spectra were analyzed by Chenomx, Bruker TopSpin and AMIX software. Statistical analysis was undertaken using Metaboanalyst. 50 metabolites were annotated, including amino acids, saccharides, nucleotides and soluble lipids. Discriminant analysis identified group separation between OA and RA cohorts, with 32 metabolites significantly different between OA and RA SF (false discovery rate (FDR) < 0.05). Metabolites of glycolysis and the tricarboxylic acid cycle were lower in RA compared to OA; these results concur with higher levels of inflammation, synovial proliferation and hypoxia found in RA compared to OA. Elevated taurine in OA may indicate increased subchondral bone sclerosis. We demonstrate that quantifiable differences in metabolite abundance can be measured in low volumes of SF by 1H NMR spectroscopy, which may be clinically useful to aid diagnosis and improve understanding of disease pathogenesis.

Keywords: metabolomics; nuclear magnetic resonance; osteoarthritis; rheumatoid arthritis; synovial fluid.


Conflict of interest statement

The authors declare no competing financial interest.

Figures

Figure 1
Figure 1
Quantile Plots of OA and RA spectra depicting the median spectral plot (black line) and variation from the median within each cohort (yellow to red scale) for the full spectral range (8.5–0.5 ppm) and a more detailed region (4.15–3.55 ppm). Peaks of interest are annotated as examples. Note multiple peaks for some metabolites, e.g., glucose.
Figure 2
Figure 2
Boxplots of representative metabolites identified from univariate analysis as significantly different between OA and RA SF (*p < 0.05, **p < 0.01, ***p < 0.001). Y-axis represents normalized peak intensity following median normalization and Pareto scaling.
Figure 3
Figure 3
Comparison of NMR SF metabolome between OA and RA. (A) Heatmap showing metabolites significantly different in OA and RA SF (p < 0.05). Blue = low, white = medium, pink = high concentration. (B) Unsupervised PCA scores plot showing metabolite profile is more variable between RA (green) than OA SF (red). Shading represents 95% confidence region. (C) Supervised multivariate analysis by PLS-DA segregated RA (green) and OA (red) SF samples. Shading represents 95% confidence region. Scores plot is shown for components 1 and 2. (D) Pathway scheme depicting metabolite levels detected in RA and OA SF. Blue = higher in RA SF, Red = higher in OA SF.
Figure 4
Figure 4
Correlation of acetylated saccharide with CRP, ESR and RF titer in RA patients. Levels of acetylated saccharide (median normalized with Pareto scaling) in RA SF correlated positively with serum levels of CRP (Pearson R2 = 0.78, p = 0.008, n = 10), ESR (Pearson R2 = 0.62, p = 0.02, n = 14) and RF titer (Pearson R2 = 0.618, p = 0.018, n = 14).

References

    1. Li H.; Hao Z.; Zhao L.; Liu W.; Han Y.; Bai Y.; et al. Comparison of molecular mechanisms of rheumatoid arthritis and osteoarthritis using gene microarrays. Mol. Med. Rep. 2016, 13 (6), 4599–605. 10.3892/mmr.2016.5144. - DOI - PMC - PubMed
    1. Sprangers M. A.; de Regt E. B.; Andries F.; van Agt H. M.; Bijl R. V.; de Boer J. B.; et al. Which chronic conditions are associated with better or poorer quality of life?. Journal of clinical epidemiology 2000, 53 (9), 895–907. 10.1016/S0895-4356(00)00204-3. - DOI - PubMed
    1. Majithia V.; Geraci S. A. Rheumatoid arthritis: diagnosis and management. Am. J. Med. 2007, 120 (11), 936–9. 10.1016/j.amjmed.2007.04.005. - DOI - PubMed
    1. Brouwers H.; von Hegedus J.; Toes R.; Kloppenburg M.; Ioan-Facsinay A. Lipid mediators of inflammation in rheumatoid arthritis and osteoarthritis. Best practice & research Clinical rheumatology 2015, 29 (6), 741–55. 10.1016/j.berh.2016.02.003. - DOI - PubMed
    1. Reynard L. N.; Loughlin J. Genetics and epigenetics of osteoarthritis. Maturitas 2012, 71 (3), 200–4. 10.1016/j.maturitas.2011.12.001. - DOI - PubMed

Publication types

MeSH terms