

A spatial regression model for the disaggregation of areal unit based data to high-resolution grids with application to vaccination coverage mapping
- PMID: 30229698
- PMCID: PMC6745613
- DOI: 10.1177/0962280218797362
A spatial regression model for the disaggregation of areal unit based data to high-resolution grids with application to vaccination coverage mapping
Abstract
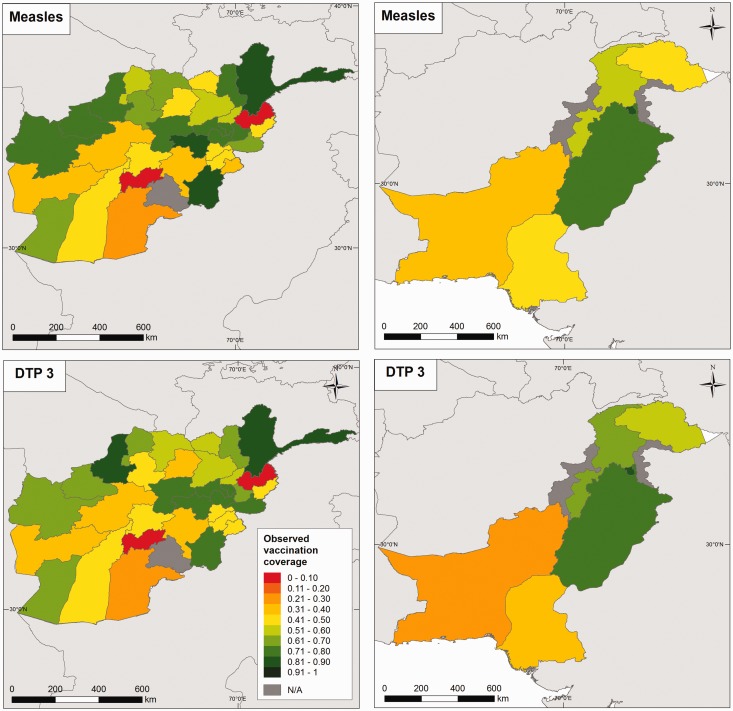
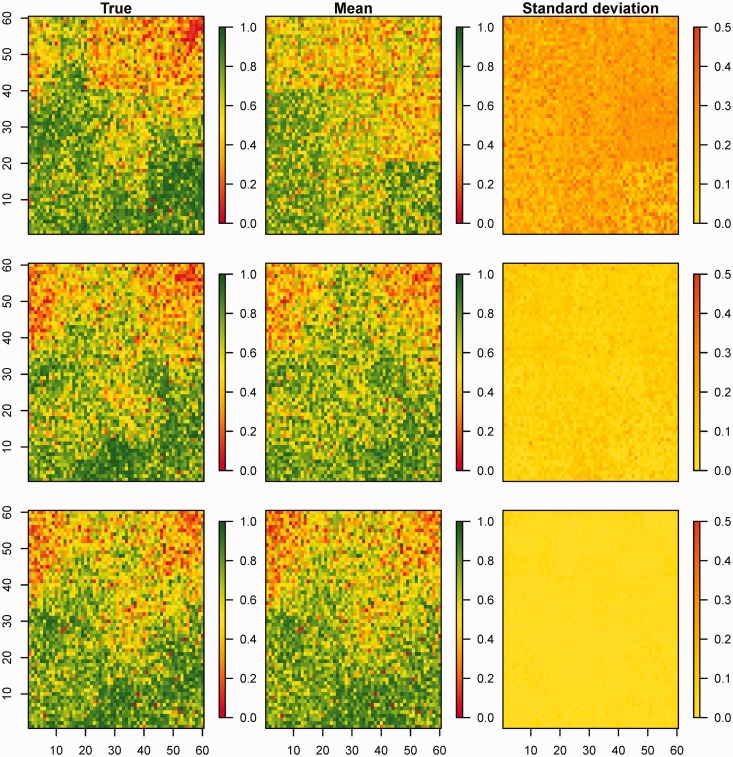
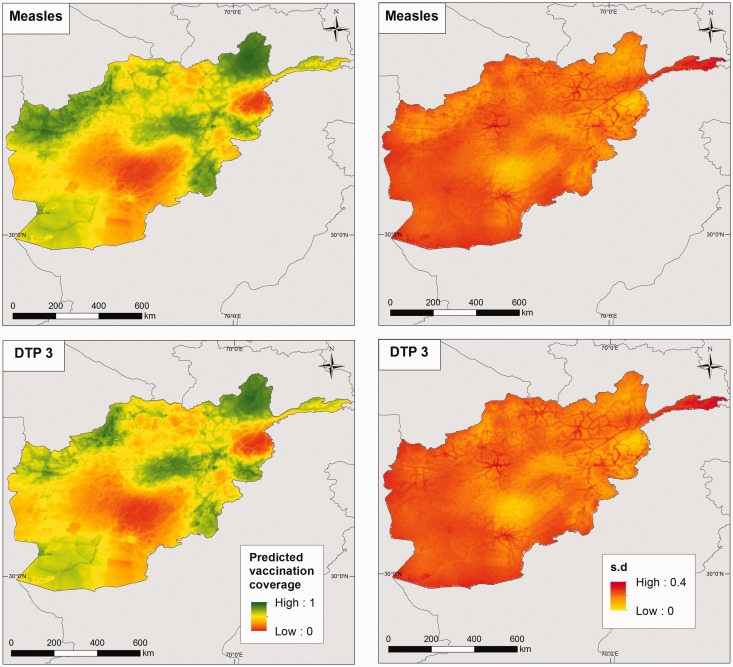
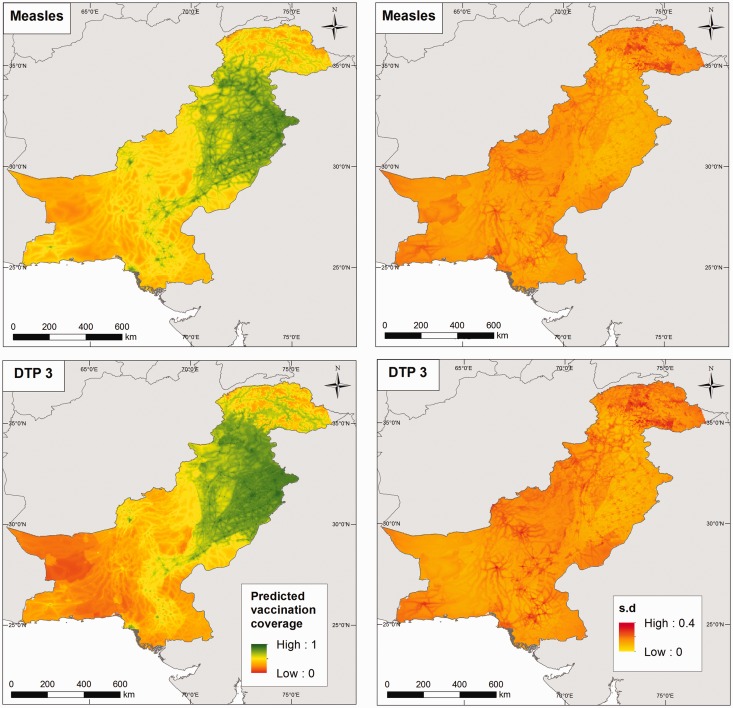
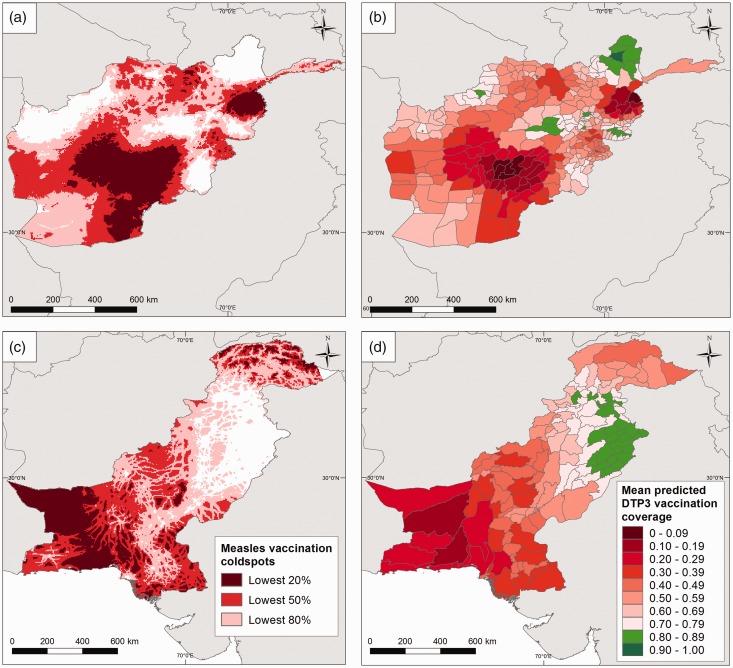
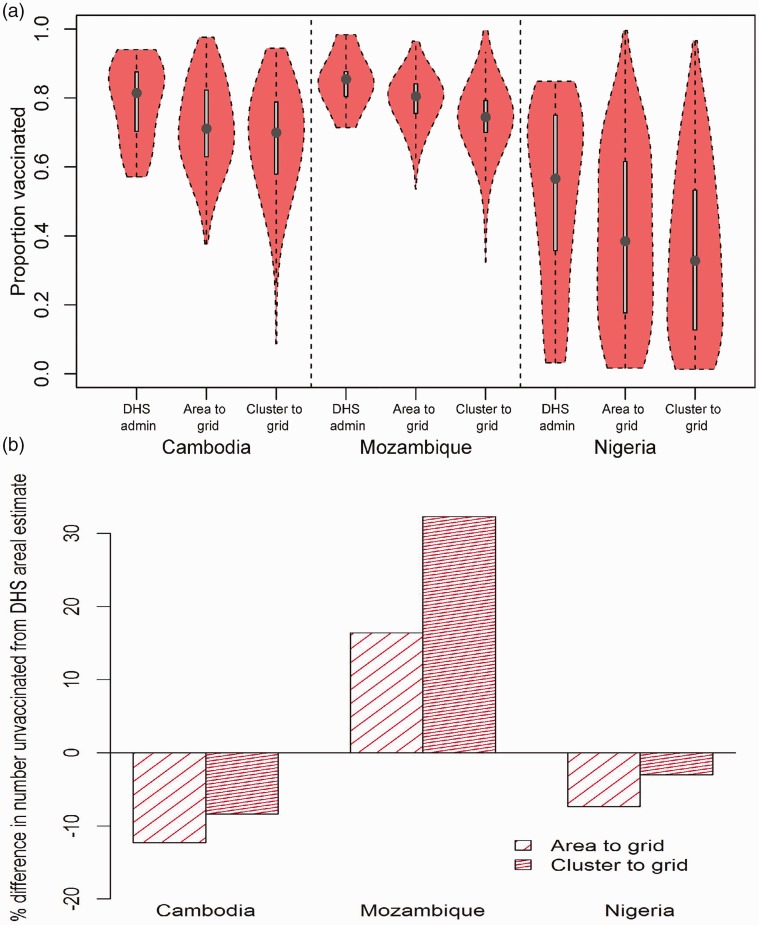
The growing demand for spatially detailed data to advance the Sustainable Development Goals agenda of 'leaving no one behind' has resulted in a shift in focus from aggregate national and province-based metrics to small areas and high-resolution grids in the health and development arena. Vaccination coverage is customarily measured through aggregate-level statistics, which mask fine-scale heterogeneities and 'coldspots' of low coverage. This paper develops a methodology for high-resolution mapping of vaccination coverage using areal data in settings where point-referenced survey data are inaccessible. The proposed methodology is a binomial spatial regression model with a logit link and a combination of covariate data and random effects modelling two levels of spatial autocorrelation in the linear predictor. The principal aspect of the model is the melding of the misaligned areal data and the prediction grid points using the regression component and each of the conditional autoregressive and the Gaussian spatial process random effects. The Bayesian model is fitted using the INLA-SPDE approach. We demonstrate the predictive ability of the model using simulated data sets. The results obtained indicate a good predictive performance by the model, with correlations of between 0.66 and 0.98 obtained at the grid level between true and predicted values. The methodology is applied to predicting the coverage of measles and diphtheria-tetanus-pertussis vaccinations at 5 × 5 km2 in Afghanistan and Pakistan using subnational Demographic and Health Surveys data. The predicted maps are used to highlight vaccination coldspots and assess progress towards coverage targets to facilitate the implementation of more geographically precise interventions. The proposed methodology can be readily applied to wider disaggregation problems in related contexts, including mapping other health and development indicators.
Keywords: Bayesian inference; Demographic and Health Surveys; INLA-SPDE; Vaccination coverage; spatial misalignment.
Figures

Similar articles
-
High resolution age-structured mapping of childhood vaccination coverage in low and middle income countries.Vaccine. 2018 Mar 14;36(12):1583-1591. doi: 10.1016/j.vaccine.2018.02.020. Epub 2018 Feb 14. Vaccine. 2018. PMID: 29454519 Free PMC article.
-
Geospatial variation in measles vaccine coverage through routine and campaign strategies in Nigeria: Analysis of recent household surveys.Vaccine. 2020 Mar 23;38(14):3062-3071. doi: 10.1016/j.vaccine.2020.02.070. Epub 2020 Feb 29. Vaccine. 2020. PMID: 32122718 Free PMC article.
-
Exploring the spatial heterogeneity in different doses of vaccination coverage in India.PLoS One. 2018 Nov 28;13(11):e0207209. doi: 10.1371/journal.pone.0207209. eCollection 2018. PLoS One. 2018. PMID: 30485291 Free PMC article.
-
Conditional probability and ratio-based approaches for mapping the coverage of multi-dose vaccines.Stat Med. 2022 Dec 20;41(29):5662-5678. doi: 10.1002/sim.9586. Epub 2022 Sep 21. Stat Med. 2022. PMID: 36129171 Free PMC article.
-
The integrated nested Laplace approximation applied to spatial log-Gaussian Cox process models.J Appl Stat. 2022 Jan 7;50(5):1128-1151. doi: 10.1080/02664763.2021.2023116. eCollection 2023. J Appl Stat. 2022. PMID: 37009597 Free PMC article. Review.
Cited by
-
Modeling and presentation of vaccination coverage estimates using data from household surveys.Vaccine. 2021 Apr 28;39(18):2584-2594. doi: 10.1016/j.vaccine.2021.03.007. Epub 2021 Apr 3. Vaccine. 2021. PMID: 33824039 Free PMC article.
-
Using models to shape measles control and elimination strategies in low- and middle-income countries: A review of recent applications.Vaccine. 2020 Jan 29;38(5):979-992. doi: 10.1016/j.vaccine.2019.11.020. Epub 2019 Nov 29. Vaccine. 2020. PMID: 31787412 Free PMC article. Review.
-
Generalized Geographically Weighted Regression Model within a Modularized Bayesian Framework.Bayesian Anal. 2023 Jan 1;-1(-1):1-36. doi: 10.1214/22-BA1357. Bayesian Anal. 2023. PMID: 36714467 Free PMC article.
-
Geospatial estimation of reproductive, maternal, newborn and child health indicators: a systematic review of methodological aspects of studies based on household surveys.Int J Health Geogr. 2020 Oct 13;19(1):41. doi: 10.1186/s12942-020-00239-9. Int J Health Geogr. 2020. PMID: 33050935 Free PMC article.
-
High-Resolution Geospatial Mapping of Zero-Dose and Underimmunized Children Following Nigeria's 2021 Multiple Indicator Cluster Survey/National Immunization Coverage Survey.J Infect Dis. 2024 Jul 25;230(1):e131-e138. doi: 10.1093/infdis/jiad476. J Infect Dis. 2024. PMID: 39052714 Free PMC article.
References
-
- United Nations General Assembly. Transforming our world: the 2030 agenda for sustainable development A/RES/70/1. Resolution adopted by the General Assembly on 25 September 2015, pp. 2015.
-
- Gething P, Tatem A, Bird T, et al. Creating spatial interpolation surfaces with DHS data. DHS Spatial Analysis Reports No 11. Rockville, MD: ICF International, 2015.
-
- Elbers C, Lanjouw JO, Lanjouw P. Micro-level estimation of poverty and inequality. Econometrica 2003; 71: 355–364.
Publication types
MeSH terms
Substances
Grants and funding
LinkOut - more resources
Full Text Sources
Other Literature Sources
Medical
