

Prostate Cancer Differentiation and Aggressiveness: Assessment With a Radiomic-Based Model vs. PI-RADS v2
- PMID: 30230108
- PMCID: PMC6620601
- DOI: 10.1002/jmri.26243
Prostate Cancer Differentiation and Aggressiveness: Assessment With a Radiomic-Based Model vs. PI-RADS v2
Abstract
Background: Multiparametric MRI (mp-MRI) combined with machine-aided approaches have shown high accuracy and sensitivity in prostate cancer (PCa) diagnosis. However, radiomics-based analysis has not been thoroughly compared with Prostate Imaging and Reporting and Data System version 2 (PI-RADS v2) scores.
Purpose: To develop and validate a radiomics-based model for differentiating PCa and assessing its aggressiveness compared with PI-RADS v2 scores.
Study type: Retrospective.
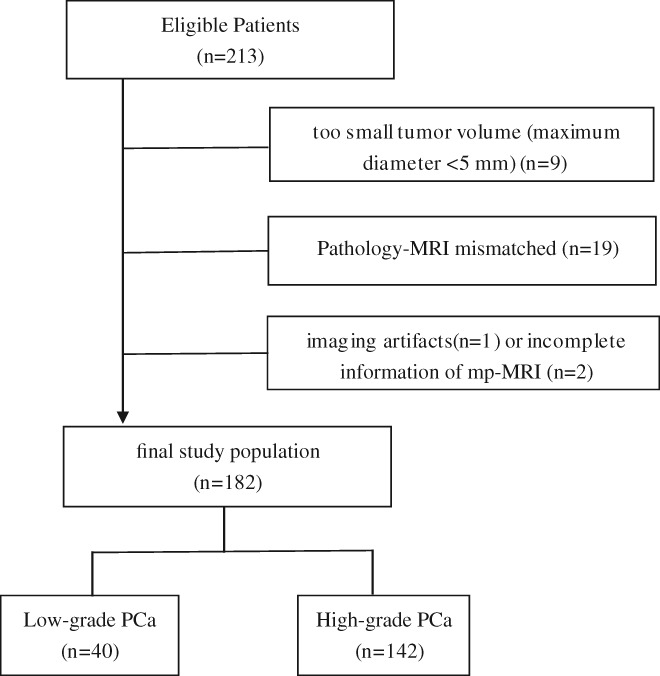
Population: In all, 182 patients with biopsy-proven PCa and 199 patients with a biopsy-proven absence of cancer were enrolled in our study.
Field strength/sequence: Conventional and diffusion-weighted MR images (b values = 0, 1000 sec/mm2 ) were acquired on a 3.0T MR scanner.
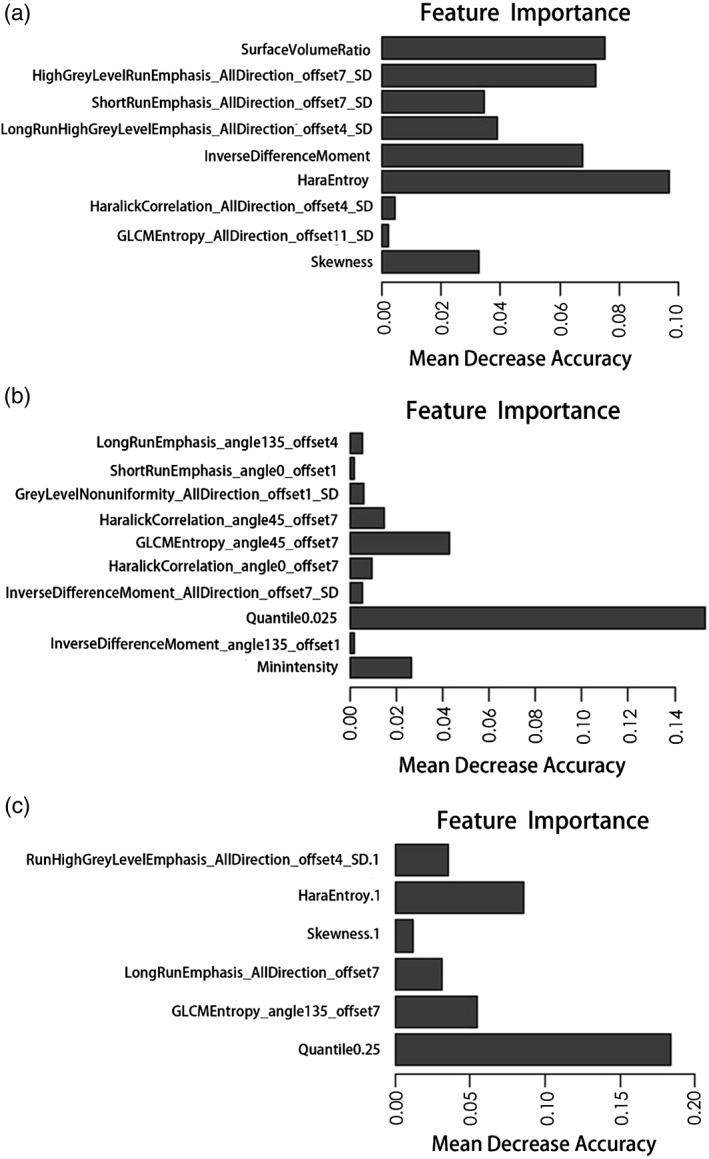
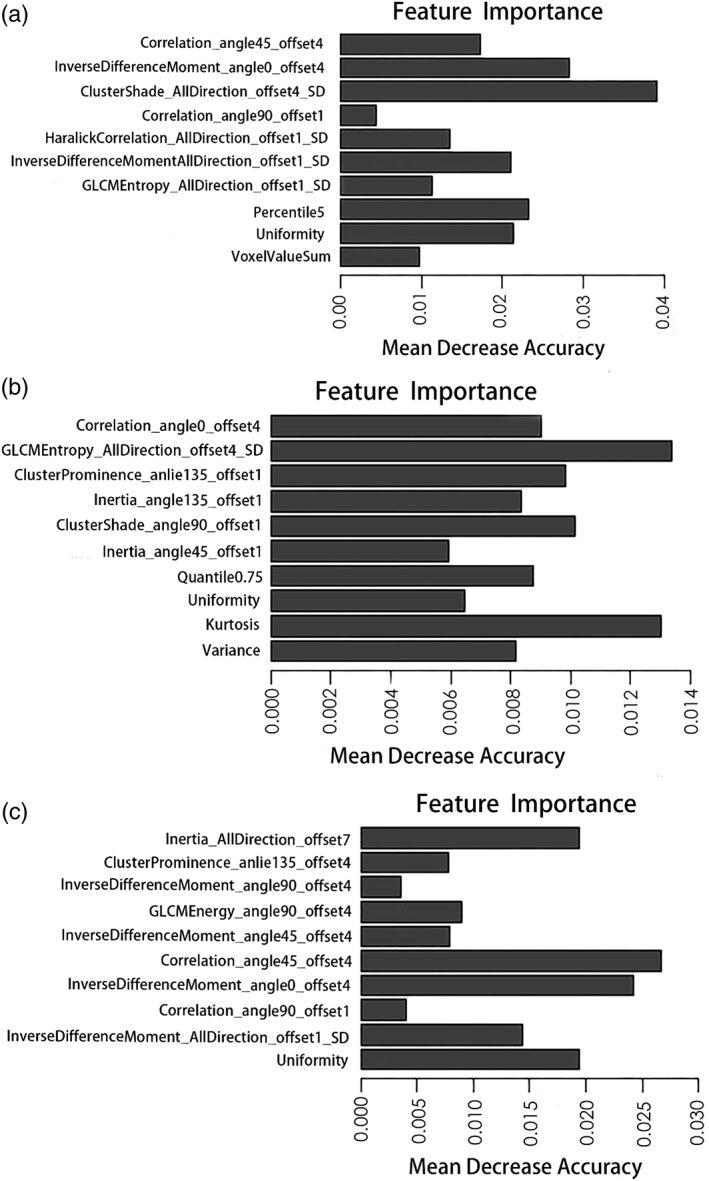
Assessment: A total of 396 features and 385 features were extracted from apparent diffusion coefficient (ADC) images and T2 WI, respectively. A predictive model was constructed for differentiating PCa from non-PCa and high-grade from low-grade PCa. The diagnostic performance of each radiomics-based model was compared with that of the PI-RADS v2 scores.
Statistical tests: A radiomics-based predictive model was constructed by logistic regression analysis. 70% of the patients were assigned to the training group, and the remaining were assigned to the validation group. The diagnostic efficacy was analyzed with receiver operating characteristic (ROC) in both the training and validation groups.
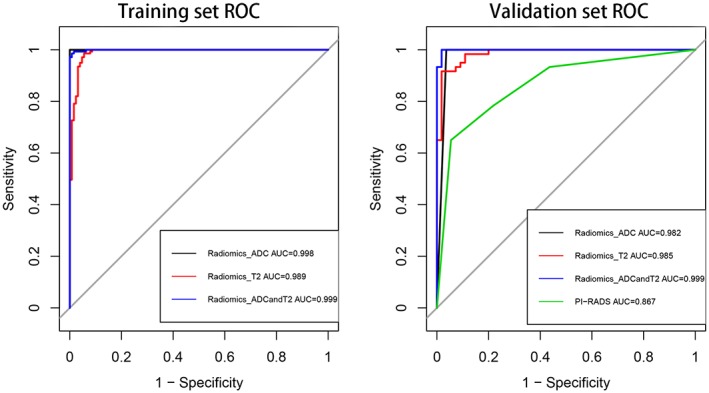
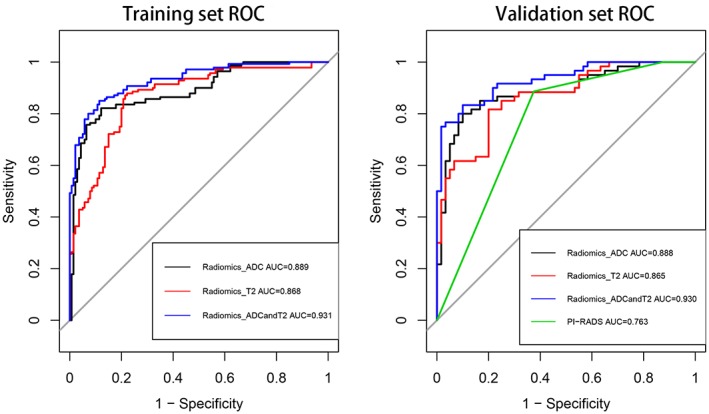
Results: For PCa versus non-PCa, the validation model had an area under the ROC curve (AUC) of 0.985, 0.982, and 0.999 with T2 WI, ADC, and T2 WI&ADC features, respectively. For low-grade versus high-grade PCa, the validation model had an AUC of 0.865, 0.888, and 0.93 with T2 WI, ADC, and T2 WI&ADC features, respectively. PI-RADS v2 had an AUC of 0.867 in differentiating PCa from non-PCa and an AUC of 0.763 in differentiating high-grade from low-grade PCa.
Data conclusion: Both the T2 WI- and ADC-based radiomics models showed high diagnostic efficacy and outperformed the PI-RADS v2 scores in distinguishing cancerous vs. noncancerous prostate tissue and high-grade vs. low-grade PCa.
Level of evidence: 3 Technical Efficacy: Stage 2 J. Magn. Reson. Imaging 2019;49:875-884.
© 2018 International Society for Magnetic Resonance in Medicine.
Conflict of interest statement
None of the authors have any conflicts of interest to disclose. We confirm that we have read the Journal's position on issues involved in ethical publication and affirm that this report is consistent with those guidelines.
Figures
Similar articles
-
Predicting the Grade of Prostate Cancer Based on a Biparametric MRI Radiomics Signature.Contrast Media Mol Imaging. 2021 Dec 23;2021:7830909. doi: 10.1155/2021/7830909. eCollection 2021. Contrast Media Mol Imaging. 2021. PMID: 35024015 Free PMC article.
-
Magnetic Resonance Imaging Radiomics-Based Machine Learning Prediction of Clinically Significant Prostate Cancer in Equivocal PI-RADS 3 Lesions.J Magn Reson Imaging. 2021 Nov;54(5):1466-1473. doi: 10.1002/jmri.27692. Epub 2021 May 10. J Magn Reson Imaging. 2021. PMID: 33970516
-
[Preliminary applicability evaluation of Prostate Imaging Reporting and Data System version 2 diagnostic score in 3.0T multi-parameters magnetic resonance imaging combined with prostate specific antigen density for prostate cancer].Zhonghua Yi Xue Za Zhi. 2017 Dec 19;97(47):3693-3698. doi: 10.3760/cma.j.issn.0376-2491.2017.47.003. Zhonghua Yi Xue Za Zhi. 2017. PMID: 29325321 Chinese.
-
Multiparametric MRI in detection and staging of prostate cancer.Dan Med J. 2017 Feb;64(2):B5327. Dan Med J. 2017. PMID: 28157066 Review.
-
A meta-analysis of use of Prostate Imaging Reporting and Data System Version 2 (PI-RADS V2) with multiparametric MR imaging for the detection of prostate cancer.Eur Radiol. 2017 Dec;27(12):5204-5214. doi: 10.1007/s00330-017-4843-7. Epub 2017 Jun 27. Eur Radiol. 2017. PMID: 28656462 Review.
Cited by
-
Artificial Intelligence Based Algorithms for Prostate Cancer Classification and Detection on Magnetic Resonance Imaging: A Narrative Review.Diagnostics (Basel). 2021 May 26;11(6):959. doi: 10.3390/diagnostics11060959. Diagnostics (Basel). 2021. PMID: 34073627 Free PMC article. Review.
-
A Combined Radiomics and Machine Learning Approach to Distinguish Clinically Significant Prostate Lesions on a Publicly Available MRI Dataset.J Imaging. 2021 Oct 18;7(10):215. doi: 10.3390/jimaging7100215. J Imaging. 2021. PMID: 34677301 Free PMC article.
-
Radiomic and Genomic Machine Learning Method Performance for Prostate Cancer Diagnosis: Systematic Literature Review.J Med Internet Res. 2021 Apr 1;23(4):e22394. doi: 10.2196/22394. J Med Internet Res. 2021. PMID: 33792552 Free PMC article.
-
Ultrasound-Based Radiomics Analysis for Preoperatively Predicting Different Histopathological Subtypes of Primary Liver Cancer.Front Oncol. 2020 Sep 24;10:1646. doi: 10.3389/fonc.2020.01646. eCollection 2020. Front Oncol. 2020. PMID: 33072550 Free PMC article.
-
More than Meets the Eye: Using Textural Analysis and Artificial Intelligence as Decision Support Tools in Prostate Cancer Diagnosis-A Systematic Review.J Pers Med. 2022 Jun 16;12(6):983. doi: 10.3390/jpm12060983. J Pers Med. 2022. PMID: 35743766 Free PMC article. Review.
References
-
- Torre LA, Bray F, Siegel RL, et al. Global cancer statistic, 2012. CA Cancer J Clin 2015;65:87–108. - PubMed
-
- Chen W, Zheng R, Baade PD, et al. Cancer statistics in China, 2015. CA Cancer J Clin 2016;66:115–132. - PubMed
-
- Schröder FH, Hugosson J, Roobol MJ, et al. Screening and prostate‐cancer mortality in a randomized European study. N Engl J Med 2009;360:1320. - PubMed
-
- Gupta RT, Kauffman CR, Polascik TJ, et al. The state of prostate MRI in 2013. Oncology 2013;27:262–270. - PubMed
-
- Yakar D, Debats OA, Bomers JG, et al. Predictive value of MRI in the localization, staging, volume estimation, assessment of aggressiveness, and guidance of radiotherapy and biopsies in prostate cancer. J Magn Reson Imaging 2012;35:20–31. - PubMed
Publication types
MeSH terms
Substances
LinkOut - more resources
Full Text Sources
Other Literature Sources
Medical
Research Materials
Miscellaneous
