. 2018 Dec;21(12):1833-1844.
doi: 10.1111/ele.13158. Epub 2018 Sep 19.

Climatically controlled reproduction drives interannual growth variability in a temperate tree species

Affiliations

Climatically controlled reproduction drives interannual growth variability in a temperate tree species

Andrew J Hacket-Pain et al. Ecol Lett. 2018 Dec.

Abstract

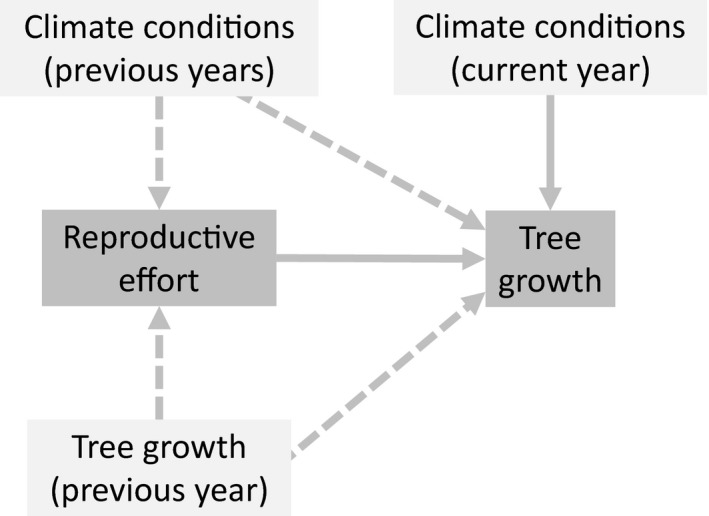
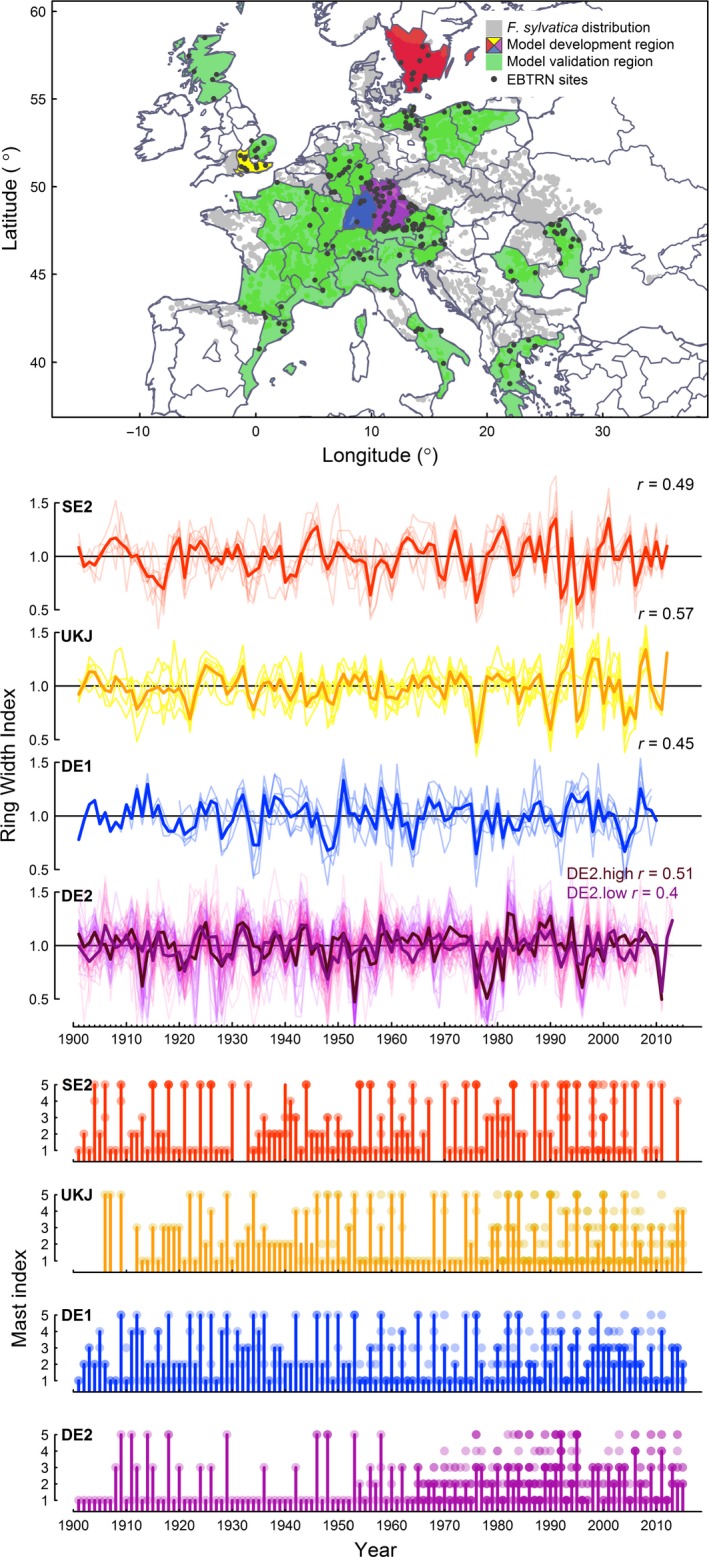
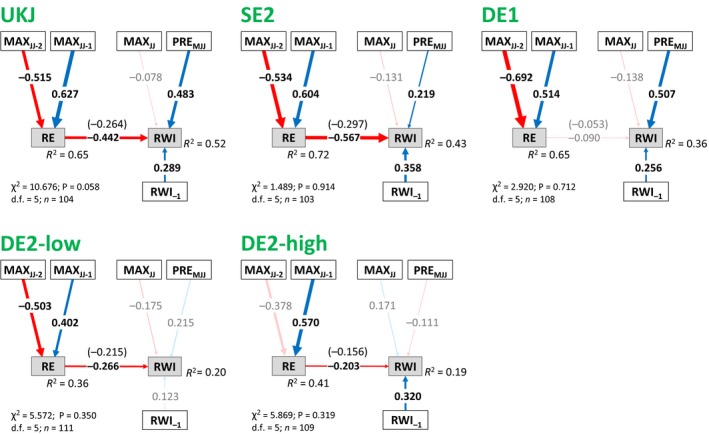
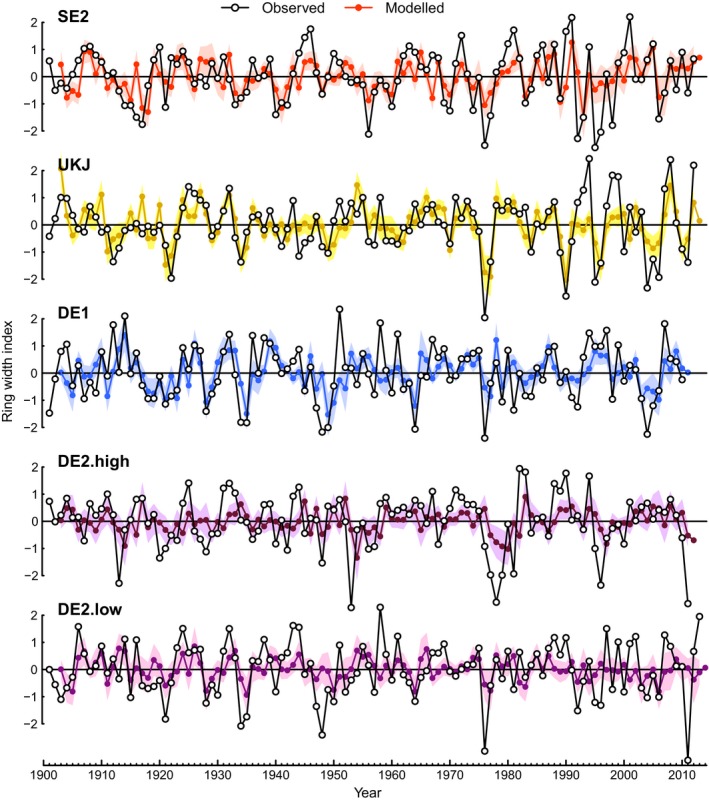
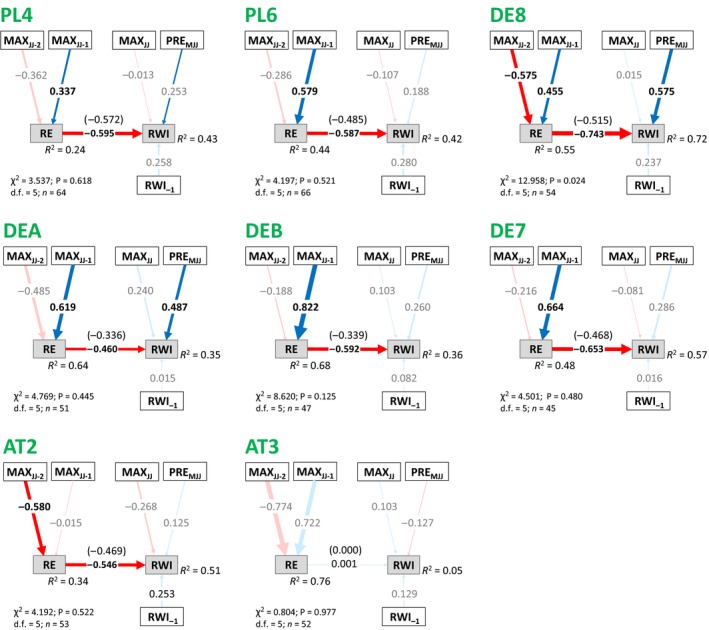
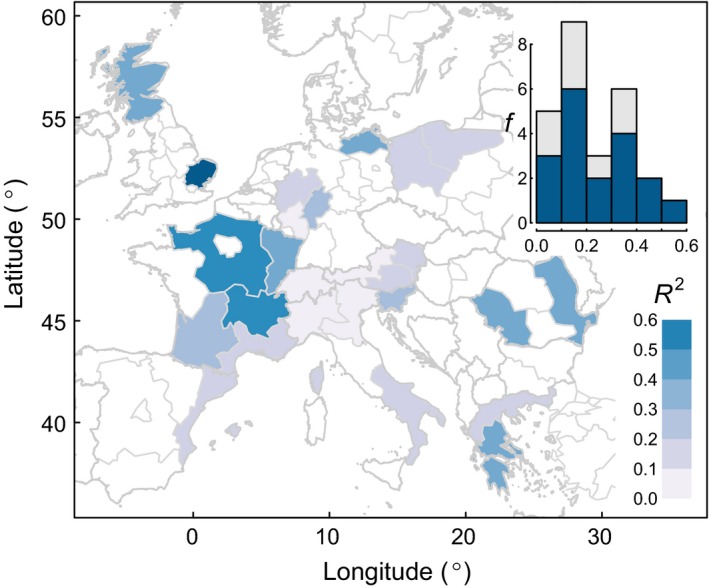
Climatically controlled allocation to reproduction is a key mechanism by which climate influences tree growth and may explain lagged correlations between climate and growth. We used continent-wide datasets of tree-ring chronologies and annual reproductive effort in Fagus sylvatica from 1901 to 2015 to characterise relationships between climate, reproduction and growth. Results highlight that variable allocation to reproduction is a key factor for growth in this species, and that high reproductive effort ('mast years') is associated with stem growth reduction. Additionally, high reproductive effort is associated with previous summer temperature, creating lagged climate effects on growth. Consequently, understanding growth variability in forest ecosystems requires the incorporation of reproduction, which can be highly variable. Our results suggest that future response of growth dynamics to climate change in this species will be strongly influenced by the response of reproduction.

Keywords: Fagus sylvatica; SEM; Dendrochronology; European beech; drought; forest growth; masting; path analysis; structural equation modelling; trade-off.


Figures

Figure 1
Figure 1
Theoretical model linking climate conditions across multiple years, tree reproductive effort and tree growth. Dashed lines indicate effects operating across years.
Figure 2
Figure 2
Study location and summary of data. (a) Study regions (NUTS‐1) including the geographic distribution of Fagus sylvatica (EURFORGEN 2009), and locations of individual RWI chronologies. (b) Ring‐width index chronologies for each region. Individual chronologies plotted in pale colours, and the mean regional chronology in dark colours. r represents the mean correlation between sites in each regional chronology. For DE2, cluster analysis revealed two distinct groups of chronologies, which correspond to high (paler purple) and low (darker purple) elevation (see Appendix B) (c) Annual reproductive effort (RE) (1‐2‐3 = non‐mast year; 4–5 = mast year) of Fagus sylvatica in each region. Individual records are plotted as points (colour intensity represents the number of records in a class), with the modal values plotted as bars.
Figure 3
Figure 3
Structural Equation Models for model development and fitting regions, representing the effects of temperature and precipitation on radial growth, with indirect pathways involving the effects of allocation to reproduction (RE). Following mediation analysis, direct pathways from MAXJJ ‐1 and MAXJJ ‐2 to RWI, and from RWI ‐1 to RE, have been removed. Blue and red arrows indicate positive and negative relationships respectively. Numbers on the arrows indicate the standardised path coefficients, with arrow thickness proportional to the coefficient strength. Coefficients in parenthesis refer to raw coefficients. Pale colours indicate non‐significant pathways (P < 0.05). The proportion of explained variance (R 2) for each endogenous variable is also shown.
Figure 4
Figure 4
Comparison of observed and predicted RWI for model development regions (models described in Fig. 3). Shading represents 95% confidence interval for model predictions. Note that RWI is modelled as a function of PREMJJ,MAXJJ , and RWI ‐1 , and predicted RE (predicted from MAXJJ ‐1 and MAXJJ ‐2) – i.e. observed RE is not used to predict RWI.
Figure 5
Figure 5
Model in Figure 3 fitted individually to each of an additional eight validation regions with ≥ 45 complete observations. Blue and red arrows indicate positive and negative relationships respectively. Numbers on the arrows indicate the standardised path coefficients, with arrow thickness proportional to the coefficient strength. Coefficients in parenthesis refer to raw coefficients. Pale colours indicate non‐significant pathways (P < 0.05). The proportion of explained variance (R 2) for each endogenous variable is also shown.
Figure 6
Figure 6
Comparison of predicted and observed tree ring chronologies from independent validation regions. RWI was predicted for each region using the multi‐group model. Note that in these models, RE was predicted using climate data, and predicted RE is then used in the model predicting RWI. The inset frequency plot shows the distribution of R 2, with light grey bars indicating regions where the regional RWI chronology shows low intraregion synchrony (mean correlation between sites < 0.3, see Appendix S3).

References

    1. Allen, R.B. , Hurst, J.M. , Portier, J. & Richardson, S.J. (2014). Elevation‐dependent responses of tree mast seeding to climate change over 45 years. Ecol. Evol., 4, 3525–3537. - PMC - PubMed
    1. Allen, R.B. , Millard, P. & Richardson, S.J. (2017). A resource centric view of climate and mast seeding in trees In: Progress in Botany (eds Cánovas F., Lüttge U. & Matyssek R.). Springer, Cham, pp. 233–268.
    1. Anderegg, W.R.L. , Schwalm, C. , Biondi, F. , Camarero, J.J. , Koch, G. , Litvak, M. et al (2015). Pervasive drought legacies in forest ecosystems and their implications for carbon cycle models. Science, 349, 528–532. - PubMed
    1. Ascoli, D. , Maringer, J. , Hacket‐Pain, A. , Conedera, M. , Drobyshev, I. , Motta, R. et al (2017a). Two centuries of masting data for European beech and Norway spruce across the European continent. Ecology, 98, 1473. - PubMed
    1. Ascoli, D. , Vacchiano, G. , Turco, M. , Conedera, M. , Drobyshev, I. , Maringer, J. et al (2017b). Inter‐annual and decadal changes in teleconnections drive continental‐scale synchronization of tree reproduction. Nat. Commun., 8, 2205. - PMC - PubMed